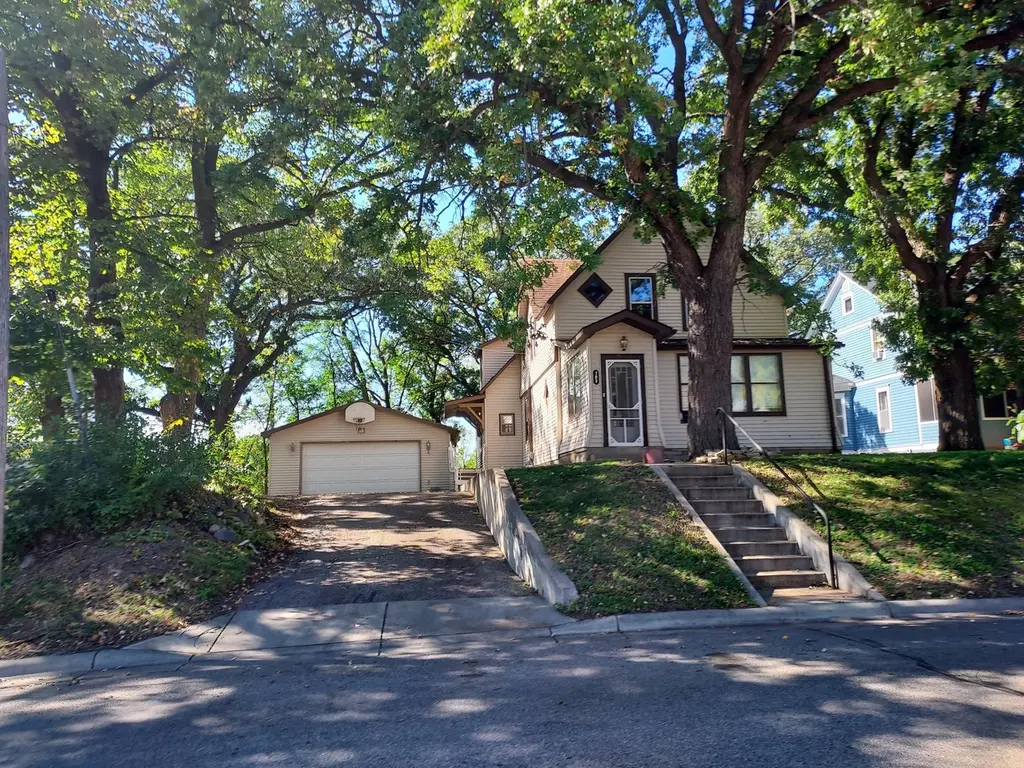
703 N 1st St · Montevideo, MN
Flood risk 1/10 · Minimal
- FEMA flood zone
- X (shaded)
- Chance of flooding over 30 yrs
- 0.0%
- Est. flood insurance / yr
- $473 – $860
Fire risk 4/10 · Minor
- Est. fire insurance / yr
- $888 – $1,650
Heat risk 2/10 · Minimal
- Hot days now (above 99°F)
- 7 days/yr
- Hot days in 30 yrs
- 13 days/yr
Wind risk 2/10 · Minimal
- Chance of severe wind over 30 yrs
- —
Air-quality risk 3/10 · Minor
- Unhealthy air days now
- 2 days/yr
- Unhealthy air days in 30 yrs
- 2 days/yr
Risk factors via First Street. Map © Google.
Why this score? — see what drove the D+ grade
The composite is a weighted blend of 9 inputs, each scored 0–100. Each bar is that input's sub-score; the figure is the points it added to the 100-point composite (weight × sub-score).
- Cash flow +15.0/30.0
- ARV discount +7.5/15.0
- 1% rule +4.9/10.0
- DSCR +4.6/10.0
- Schools +4.0/10.0
- Livability +4.0/5.0
- Rent growth +2.5/5.0
- Condition / age +2.5/5.0
- Appreciation +0.0/10.0
$119,900
🖨 Deal sheet (PDF) 📄 Offer letter ✓ Due diligence
Listing remarks
Buyer's Financing fell through, it can be yours! Don’t walk—RUN—to see this beautiful two-story home that blends timeless character with today’s conveniences. The main floor offers a huge family room, dining room, living room, and a bright sitting room that works perfectly as a home office or flex space, plus a convenient main-floor laundry with brand-new washer and dryer. Upstairs you’ll find four spacious bedrooms on one level. The kitchen is updated with all new stainless-steel appliances. New ceramic tile in the entry, kitchen, and family room; new tile-plank floors upstairs; updated bathrooms; brand-new water pipes throughout; new baseboard heat system, ne
Key facts
- Huge family room
- Bright sitting room
- Updated bathrooms
Tags
Property features AI
Finance
- Other: Lot approximately 0.45 acres (dimensions: 208 x 149 x 120 x 120)
Exterior
- Parking: Detached/asphalt driveway; 2-car garage
- Utilities: City water (connected); City sewer (connected); Electric service with circuit breakers; Electric fuel
- Home design: Residential property; Two levels; Main entry level is the main floor
- Construction: Block construction; Block foundation; Asphalt roof; Built with approximately 1,887 above-grade square feet
- Exterior features: Vinyl exterior; Composite decking; Porch (including enclosed porch); Medium tree coverage on lot; Road frontage on a city street
Interior
- Kitchen: Range; Microwave; Dishwasher; Refrigerator
- Bedrooms: 4 bedrooms (3 on upper level, 1 on main level); Bedroom sizes include 13.9 x 13.5; 13.3 x 10.4; 11.5 x 11.6; 11.6 x 11.6
- Flooring: Hardwood floors; Tile floors
- Bathrooms: One full bathroom on the upper level; Half bathroom on the main floor
- Heating & cooling: Hot water boiler with baseboard heat; No central air
- Interior features: Hardwood and tile floors; Stainless steel appliances; Deck and porch; Enclosed porch
- Laundry & utility: Main level laundry; Washer and dryer included
Neighborhood map
What this means for you Summary
Snapshot
- This is a 4-bed/2.0-bath single-family listed at $120k.
Deal economics
- At list price, monthly cash flow is $38 ($460/yr) — positive.
- The deal already cash-flows at list — no discount required.
- To meet the 1% rule (rent ≥ 1% of price), the offer needs to be $119k (0.9% below list).
- Recommended offer: $118k (1.5% below list) — sets the bar for market timing.
- Cap rate 6.7% vs local median 3.5% in Montevideo — top-decile yield for the area; either an underpriced asset or a hidden risk that comps aren't pricing in. Stress-test before assuming the spread holds.
Location & tenants
- Location reads 79/100 on livability (#101 in MN, #2,281 nationally) — a middle-class / working-renter tenant base. Strengths: crime A+, cost of living A+, housing A+; Watch: employment D+, amenities F, commute F.
- Montevideo Public School District (town): math 44% / reading 50% proficiency, ranked #159 of 301 in MN (top 53%) — families likely to look elsewhere, expect single-tenant / working-renter base with shorter leases.
- Zoned schools: Ramsey Elementary (math 47% / reading 42%, grade F, #534 of 857 statewide, top 66%, 338 students, 60% FRL); Montevideo Middle (math 46% / reading 51%, grade C-, #87 of 258 statewide, top 34%, 432 students, 58% FRL); Montevideo Senior High (math 42% / reading 52%, grade D-, #166 of 471 statewide, top 39%, 386 students, 47% FRL) — zoned schools average 55% FRL vs 30% district-wide (26 pts higher); higher-poverty schools than district average — tighter screening recommended.
- Market conditions: 87 active listings in the ZIP; 13 units permitted in Chippewa County in 2024 (0 in 5+ unit buildings).
Forward outlook
- Local home prices are declining (-3.0%/yr); year-one equity from $829 of loan paydown is wiped out by about $4k of value loss. Plan a longer hold.
- Chippewa County population projected at -12% by 2050 — secular population decline; favor cash flow + early exit over multi-decade hold.
Negotiation context
- It's been on market 16 days — a 2% lower offer ($118k) is reasonable based on typical stale-listing flexibility.
- 9 sale attempts since 14y ago with the ask held roughly flat each time — persistent listings suggest the price (not the market) is what's stuck; bring a comps-based counter.
- Current owner paid $102k; 18% above their basis — modest negotiation headroom, anchor on the comps not their cost.
Risks & watch-outs
- Watch-outs: built in 1887 — expect roof / HVAC / electrical / plumbing capex.
Questions for the listing agent
- Built in 1887 — when were the roof, HVAC, electrical panel, plumbing, and water heater last replaced?
- Is there a deadline driving the sale (1031 exchange, divorce, estate, relocation)? That informs how much negotiation room exists.
- Schools are B-rated — typically a magnet for longer-tenancy family renters. What's the average tenant stay here, and is there a school-zone premium baked into asking?
- The area grade is low — what's the realistic commute time and amenity access for the typical tenant pool here? Any planned neighborhood developments (good or bad) we should know about?
- What's the average days-on-market for RENTAL listings here right now (not sales)? A rising rental-DOM trend means longer vacancies and softer asking-rent achievability than the comps imply.
- What's the recent tenant-quality profile in this submarket — average credit score on applications, eviction rate, late-payment / NSF rate, and stable-employment percentage? A property-management company in the area should have these aggregated.
- How much new for-sale + rental construction is in the pipeline within 1–3 miles? Heavy new supply typically softens prices + rents 12–24 months out; constrained supply supports both.
Investment metrics
- 1% rule
- 0.99% ✗
- Cap rate
- 6.68%
- Cash-on-cash
- 1.37%
- DSCR
- 1.06
- GRM
- 8.4
CMA / ARV
No comps found within radius.
Projected returns pro-forma
-3.0% appreciation · 3.0% rent growth · sell at horizon
- IRR
- -14.1%
- Equity multiple
- 0.50×
- Total profit
- $-16,925
- Equity at exit
- $17,877
- IRR
- -5.2%
- Equity multiple
- 0.66×
- Total profit
- $-11,341
- Equity at exit
- $10,367
Cash invested: $33,572 (down + closing). Projections, not guarantees.
Landlord ↔ Tenant lean methodology
- Overall (STATE)
- 46 Balanced
- State Minnesota
- 46 Balanced · D+2
- County
- — inherits STATE
- City
- — inherits STATE
ZIP-level market 56265
- Home prices YoY
- -27.2%
- Active inventory
- 87
- Price-to-rent
- 8.4×
Monthly cashflow live
- Estimated rent
- $1,189 medium interval (Pro) →
- Mortgage (P&I)
- −$629
- Tax from tax record
- −$222 /mo · $2,664/yr
- Insurance
- −$50
- HOA
- −$0
- Vacancy / Maint / Mgmt
- −$250
- Net cashflow
- $38
Break-even live
Sensitivity live
| Price | -10% $106 | -5% $72 | +0% $38 | +5% $4 | +10% $-30 |
|---|---|---|---|---|---|
| Rent | -10% $-56 | -5% $-9 | +0% $38 | +5% $85 | +10% $132 |
| Rate | -1.0pp $99 | -0.5pp $69 | base $38 | +0.5pp $7 | +1.0pp $-24 |
UW: 25.0% down · 7.5% · 30yr · 1.5% tax · 5.0% vac · 8.0% maint · 8.0% mgmt
Financing live
Cash to close
- Down payment
- $29,975
- Closing costs
- $3,597
- Reserves months
- —
- Total cash needed
- —
Loan-product check · same deal, 3 products live
Conventional
25% down · 7.5% · 30yr
- Down + closing
- —
- Monthly P&I
- —
- Monthly cashflow
- —
- DSCR
- —
- Eligible?
- —
Personal DTI + credit; lowest rate.
DSCR
20% down · 8.5% · 30yr
- Down + closing
- —
- Monthly P&I
- —
- Monthly cashflow
- —
- DSCR
- —
- Eligible?
- —
No personal income docs; deal must DSCR.
Hard money
10% down · 12.0% · 12mo
- Down + closing
- —
- Monthly P&I
- —
- Monthly cashflow
- —
- DSCR
- —
- Eligible?
- —
Short-term bridge; refi at stabilization.
Listing history 12 events
-
2026-06-21days on market $119,900 Active 16 DOM
-
2026-06-21days on market $119,900 Active 15 DOM
-
2026-06-18days on market $119,900 Active 13 DOM
-
2026-06-17days on market $119,900 Active 12 DOM
-
2026-06-16days on market $119,900 Active 11 DOM
-
2026-06-15days on market $119,900 Active 10 DOM
-
2026-06-13days on market $119,900 Active 8 DOM
-
2026-06-12days on market $119,900 Active 7 DOM
-
2026-06-09days on market $119,900 Active 4 DOM
-
2026-06-08days on market $119,900 Active 3 DOM
-
2026-06-07remarks 669-char remark
-
2026-06-07$119,900 Active 2 DOM
ⓘ Source: listings_history table (triggers on properties + properties_extension) + one-shot
backfill from property_details.listing_events for pre-trigger history.
Tax reassessment forecast MN · Partial reset (capped growth)
- Current annual tax
- $2,664 · $222/mo
- Projected year-2 tax
- $2,664 · $222/mo
- Expected delta
- $0/yr ($0/mo · 0.0%)
ⓘ Screening estimate from a state-policy table — verify with the county assessor before closing.
Climate risk First Street
- Flood 1/10 Low FEMA zone X (shaded) · 0% chance over 30 yrs
- Wildfire 4/10 Moderate
- Heat 2/10 Low 7 d/yr ≥99°F today · 13 d/yr by 30 yrs out
- Wind 2/10 Low
- Air quality 3/10 Moderate 2 unhealthy d/yr today · 2 by 30 yrs out
Nearby sold comps map
Loading sold comps map…
Walkable amenities ~0.75 mi
Loading nearby amenities…
Taxation est. · year 1
- Rental income
- $14,264
- − Mortgage interest
- −$6,716
- − Property taxes
- −$2,664
- − Insurance
- −$600
- − Repairs & maintenance
- −$1,141
- − Management
- −$1,141
- − Depreciation
- −$3,488
- Taxable loss
- −$1,486
- Est. tax savings @ 24.0%
- +$357
- After-tax cash flow
- $817/yr
For passive investors: Depreciation is non-cash, so a rental often shows a tax loss while cash-flowing — sheltering income. Rental losses are passive: they offset passive income freely, and up to $25,000/yr can offset ordinary (W-2) income if you actively participate and your MAGI is under $100k (phasing out to $0 by $150k); unused losses carry forward. On sale, claimed depreciation is recaptured at up to 25%, and gains may owe capital-gains tax (a 1031 exchange can defer both). Figures are a year-1 estimate at your 24.0% rate — not tax advice; consult a CPA.
Schools (NCES district)
- District
- Montevideo Public School District
- NCES district ID
- 2721320
- Math proficiency
- 44% ▼ -10.00%
- Reading proficiency
- 50% ▼ -9.00%
- Median HH income
- $49,188
- Composite
- 40.2/100
- National rank
- #3783
- State rank
- #159 of 301 in MN
Livability — Montevideo
- Score
- 79/100
- State rank
- #101
- US rank
- #2281
Category grades
Schools grade is shown separately in the Schools card above.
Census & demographics
- Census place
- Montevideo, MN
- Population (ZIP)
- 7,433
Population outlook (Chippewa County) Hauer SSP2
- Today (2025)
- 11,593 people
- By 2030
- 11,294 · -2.6%
- By 2040
- 10,715 · -7.6%
- By 2050
- 10,229 · -11.8%
- By 2075
- 9,600 · -17.2%
- By 2100
- 8,500 · -26.7%
Race, ethnicity, and origin ACS 2023
- Neighborhood character
- Predominantly White (85%)
- Race & ethnicity
- White 85% Hispanic / Latino 10% Two or more races 4% Asian 2% Black 1%
- Hispanic origin (detail)
- Mexican 3%
- Common ancestry
- Portuguese 35% Iranian 3% Romanian 2%
- Foreign-born
- 6% · Canada
- Languages at home
- 92% English-only · Spanish 6% Other Asian/Pacific 2%
Political lean MEDSL · Chippewa
- 2024 margin
- Solid R (+34.1) · D 32.2% · R 66.3% · Other 1.6%
- 2008→2024 swing
- -40.0pp toward R · 2008: 5.9pp · 2024: -34.1pp
- All cycles
- 2024: R+34.1 2020: R+30.6 2016: R+28.9 2012: D+1.9 2008: D+5.9
Not yet ingested
- Civics
- —
Market trends
- HPI YoY
- ▼ -83.18%
- Current HPI
- 222.6691
- Rent YoY
- —
- Metro
- —
- State GDP YoY
- ▲ 2.41%
- F500 in state
- 34
Industry mix (Fortune 500 HQ in MN)
| Industry | F500 HQs | Revenue |
|---|---|---|
| Healthcare | 2 | $407B |
|
||
| Retail | 2 | $150B |
|
||
| Consumer Goods | 2 | $32B |
|
||
| Industrial Machinery | 2 | $6B |
|
||
| Agriculture | 1 | $40B |
|
||
| Healthcare / Medical Devices | 1 | $32B |
|
||
Price history
+26.3% since first listed25 events — show timeline
- 2026-06-05 Listed $119,900 NORTHSTARMLS as Distributed by MLS Grid
- 2026-03-13 Pending — NORTHSTARMLS as Distributed by MLS Grid
- 2026-03-04 Contingent — NORTHSTARMLS as Distributed by MLS Grid
- 2026-02-11 Price Changed $119,900 NORTHSTARMLS as Distributed by MLS Grid
- 2026-02-11 Relisted — NORTHSTARMLS as Distributed by MLS Grid
- 2026-02-02 Contingent — NORTHSTARMLS as Distributed by MLS Grid
- 2026-01-20 Listed $129,900 NORTHSTARMLS as Distributed by MLS Grid
- 2025-12-31 Listing Removed — NORTHSTARMLS as Distributed by MLS Grid
- 2025-12-17 Relisted — NORTHSTARMLS as Distributed by MLS Grid
- 2025-12-10 Contingent — NORTHSTARMLS as Distributed by MLS Grid
- 2025-11-24 Price Changed $139,900 NORTHSTARMLS as Distributed by MLS Grid
- 2025-11-01 Price Changed $149,900 NORTHSTARMLS as Distributed by MLS Grid
- 2025-10-21 Price Changed $159,900 NORTHSTARMLS as Distributed by MLS Grid
- 2025-09-26 Listed $169,900 NORTHSTARMLS as Distributed by MLS Grid
- 2019-02-02 Listing Removed — NORTHSTARMLS as Distributed by MLS Grid
- 2019-02-02 Listing Removed — NORTHSTARMLS as Distributed by MLS Grid
- 2019-02-02 Listing Removed — NORTHSTARMLS as Distributed by MLS Grid
- 2018-08-27 Sold (Public Records) $102,000 Public Records
- 2018-08-27 Sold (MLS) $102,000 NORTHSTARMLS as Distributed by MLS Grid
- 2017-08-01 Listed $109,700 NORTHSTARMLS as Distributed by MLS Grid
- 2015-09-30 Sold (Public Records) $83,000 Public Records
- 2015-09-29 Sold (MLS) $83,000 NORTHSTARMLS as Distributed by MLS Grid
- 2015-01-19 Listed $87,300 NORTHSTARMLS as Distributed by MLS Grid
- 2012-09-11 Listed $94,900 NORTHSTARMLS as Distributed by MLS Grid
- 2012-09-11 Listed $94,900 NORTHSTARMLS as Distributed by MLS Grid
Property tax history
+6.0%/yrLatest (2026): $2,664 · -20.2% YoY. Source: county tax records.
Cash-flow waterfall
monthlySold comps — $/sqft
last 12 mo · ≤1 miLoading sold comps…