 Duplex
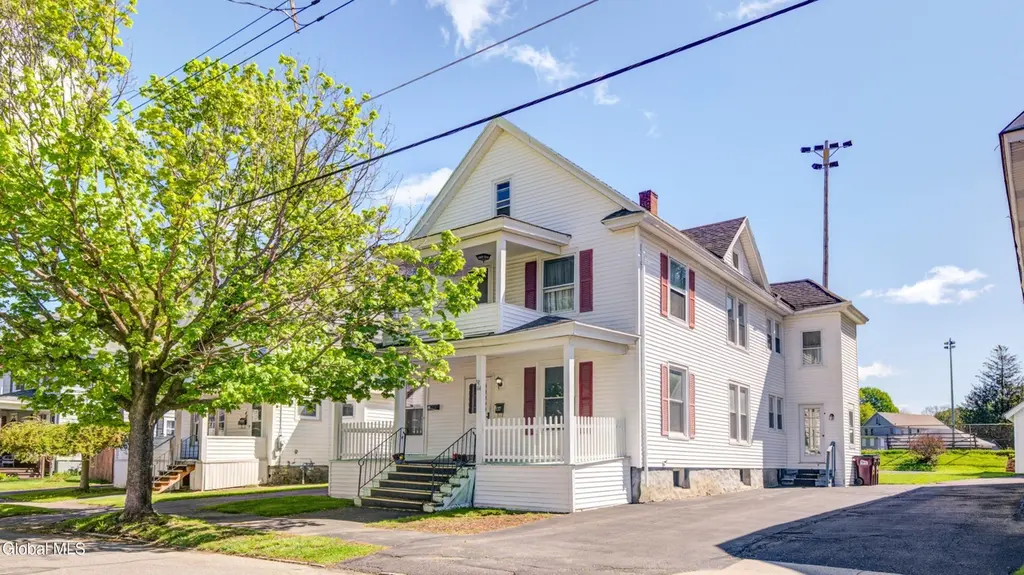
44 Temple St · Gloversville, NY
Flood risk 1/10 · Minimal
- FEMA flood zone
- X
- Chance of flooding over 30 yrs
- 0.0%
- Est. flood insurance / yr
- $473 – $860
Fire risk 3/10 · Minor
- Est. fire insurance / yr
- $691 – $1,283
Heat risk 2/10 · Minimal
- Hot days now (above 93°F)
- 7 days/yr
- Hot days in 30 yrs
- 16 days/yr
Wind risk 2/10 · Minimal
- Chance of severe wind over 30 yrs
- 2.0%
Air-quality risk 1/10 · Minimal
- Unhealthy air days now
- 0 days/yr
- Unhealthy air days in 30 yrs
- 0 days/yr
Risk factors via First Street. Map © Google.
Why this score? — see what drove the A grade
The composite is a weighted blend of 9 inputs, each scored 0–100. Each bar is that input's sub-score; the figure is the points it added to the 100-point composite (weight × sub-score).
- Cash flow +30.0/30.0
- ARV discount +15.0/15.0
- 1% rule +10.0/10.0
- DSCR +10.0/10.0
- Appreciation +10.0/10.0
- Livability +4.1/5.0
- Schools +2.8/10.0
- Rent growth +2.5/5.0
- Condition / age +2.2/5.0
$134,500
🖨 Deal sheet 📄 Offer letter ✓ Due diligence
Multi-family units
County records classify this as Multi-Family (2-4 Unit). Listing-text estimate: 2 units. confirmed
Listing remarks
Charming 2-family home offering a wonderful opportunity for both owner-occupants and investors alike! Each spacious unit features 2 bedrooms and 1 full bath, with beautiful hardwood floors, inviting dining rooms, and bright eat-in kitchens full of character and functionality. Enjoy relaxing mornings or evenings on the welcoming covered front porch overlooking a picturesque tree-lined street. The backyard is perfect for recreation and entertaining with a basketball court and backing up to a baseball field for an open, park-like feel. Conveniently located within walking distance to restaurants, shopping, and schools. Low-maintenance vinyl siding and off-street parking for up to 4 vehicles mak
Key facts
- Covered front porch
- Eat-in kitchens
- Dining rooms
Tags
Property features AI
Finance
- Financial info: Two-unit multifamily property
Exterior
- Parking: Driveway with space for 3 vehicles
- Utilities: 100 amp electric service with circuit breakers; Public water; Public sewer
- Home design: Duplex
- Construction: Vinyl siding; Stone foundation
- Exterior features: Front porch
Interior
- Bedrooms: Two 2-bedroom units (each unit has 2 bedrooms)
- Flooring: Carpet; Hardwood; Laminate
- Bathrooms: Each unit has one full bathroom (2 full bathrooms total)
- Heating & cooling: Forced air heating; Natural gas
- Interior features: Carpet, hardwood, and laminate flooring; Full basement
Neighborhood map
What this means for you Summary
Snapshot
- This is a 2 × 2-bed/1-bath units multifamily listed at $134k. Condition is rated fair.
Deal economics
- At list price, monthly cash flow is $865 ($10k/yr) — positive. Per door: $432/mo.
- The deal already cash-flows at list — no discount required.
- Meets the 1% rule at list price ($2k rent vs $134k).
- Cap rate 14.0% vs local median 8.7% in Gloversville — top-decile yield for the area; either an underpriced asset or a hidden risk that comps aren't pricing in. Stress-test before assuming the spread holds.
Location & tenants
- Location reads 82/100 on livability (#70 in NY, #1,048 nationally) — a professional / high-income tenant draw. Strengths: amenities A+, commute A+, cost of living A+; Watch: employment F.
- Gloversville City School District (town): math 26% / reading 42% proficiency, ranked #565 of 590 in NY (top 96%) — families likely to look elsewhere, expect single-tenant / working-renter base with shorter leases.
- Zoned schools: Gloversville High School (math 82% / reading 77%, grade A-, #518 of 1,100 statewide, top 51%, 697 students, 71% FRL) — zoned schools average 71% FRL vs 54% district-wide (17 pts higher); higher-poverty schools than district average — tighter screening recommended.
- Zoned-school proficiency averages 80% at this address vs 34% district-wide (+46 pts) — the actual schools serving this property are materially stronger than the Gloversville City School District average implies; a family-tenant draw the district grade alone would hide.
- Market conditions: 165 active listings in the ZIP; 1 comparable units currently listed for rent nearby; 112 units permitted in Fulton County in 2024 (50 in 5+ unit buildings).
Forward outlook
- In year one you build about $14k of equity ($930 loan paydown + $13k appreciation (10.0% local appreciation)).
- Fulton County population projected at -23% by 2050 — secular population decline; favor cash flow + early exit over multi-decade hold.
- At projected returns (10.0% appreciation + 3.0% rent growth), your $38k cash investment doubles in ~2 years — after that, you're playing with house money.
- By year 3, paydown + projected appreciation supports a ~$36k cash-out refi (75% LTV) — recoverable capital for the next deal without selling this one.
Negotiation context
- Only 6 days on market — expect competitive offers; lowballing is unlikely to land.
Risks & watch-outs
- Watch-outs: built in 1910 — expect roof / HVAC / electrical / plumbing capex.
Questions for the listing agent
- Can we see the unit-by-unit rent roll, current vacancy, and any below-market leases? What's the average tenancy length?
- What capital expenditures (roof, boiler, parking lot, exteriors) have been made in the last 5 years, and what's planned in the next 2?
- Have any recent inspections been done? Can we get a copy of the seller's disclosures and any deferred-maintenance estimates?
- Built in 1910 — when were the roof, HVAC, electrical panel, plumbing, and water heater last replaced?
- Is there a deadline driving the sale (1031 exchange, divorce, estate, relocation)? That informs how much negotiation room exists.
- Schools are D-rated, which usually means shorter tenancies and higher turnover. Who's the typical renter profile here, and what's been the actual vacancy rate?
- What's the average days-on-market for RENTAL listings here right now (not sales)? A rising rental-DOM trend means longer vacancies and softer asking-rent achievability than the comps imply.
- What's the recent tenant-quality profile in this submarket — average credit score on applications, eviction rate, late-payment / NSF rate, and stable-employment percentage? A property-management company in the area should have these aggregated.
- How much new apartment / multifamily construction is in the pipeline within 1–3 miles? Heavy new supply (>2% of stock underway) typically softens rents 12–24 months out; light construction supports rent growth.
Investment metrics
- 1% rule
- 1.69% ✓
- Cap rate
- 14.01%
- Cash-on-cash
- 27.55%
- DSCR
- 2.23
- GRM
- 4.9
CMA / ARV
- ARV (median comp)
- $183,009
- List price
- $134,500
- Delta
- -26.51%
- Verdict
- UNDERPRICED
- Comps
- 20 within 1.0 mi
Show comp detail 12 sales within ~0.75 mi
| Address | Dist | Beds/Ba | Sqft | Sold | Price | $/sf | Match |
|---|---|---|---|---|---|---|---|
| 45 Temple St | 0.02mi | 4/2.0 | 2,182 (+1%) | 6mo | $114,000 | $52 | 92 |
| 38 Temple St | 0.03mi | 4/2.0 | 2,296 (+6%) | 1mo | $107,000 | $47 | 88 |
| 40 Temple St | 0.02mi | 4/2.0 | 1,956 (-9%) | 2mo | $137,000 | $70 | 82 |
| 65 Temple St | 0.09mi | 4/2.0 | 2,256 (+4%) | 10mo | $160,000 | $71 | 80 |
| 36 Helwig St | 0.41mi | 4/2.0 | 2,080 (-4%) | 9mo | $110,000 | $53 | 68 |
| 26 Grand St | 0.15mi | 3/3.0 (-1) | 2,360 (+9%) | 4mo | $110,000 | $47 | 65 |
| 242 Bleecker St | 0.17mi | 5/2.0 (+1) | 1,904 (-12%) | 6mo | $125,000 | $66 | 62 |
| 24 4th Ave | 0.24mi | 5/2.0 (+1) | 2,400 (+11%) | 5mo | $120,000 | $50 | 61 |
| 32 5th Ave | 0.31mi | 4/2.0 | 1,890 (-12%) | 10mo | $88,000 | $47 | 56 |
| 70 6th Ave | 0.48mi | 5/2.0 (+1) | 1,952 (-10%) | 4mo | $120,000 | $61 | 54 |
| 128 Broad St | 0.63mi | 4/2.0 | 2,336 (+8%) | 6mo | $150,000 | $64 | 52 |
| 73 Fremont St | 0.58mi | 5/2.0 (+1) | 1,914 (-11%) | 8mo | $75,000 | $39 | 42 |
Match score weights: distance 35% · size 25% · config 20% · recency 20%. Top-matched comps best support the ARV.
Projected returns pro-forma
10.0% appreciation · 3.0% rent growth · sell at horizon
- IRR
- 45.1%
- Equity multiple
- 4.41×
- Total profit
- $128,353
- Equity at exit
- $121,168
- IRR
- 39.1%
- Equity multiple
- 9.89×
- Total profit
- $334,742
- Equity at exit
- $261,304
Cash invested: $37,660 (down + closing). Projections, not guarantees.
Landlord ↔ Tenant lean methodology
- Overall (STATE)
- 15 Strongly Tenant-Friendly
- State New York
- 15 Strongly Tenant-Friendly · D+10
- County
- — inherits STATE
- City
- — inherits STATE
ZIP-level market 12078
- Home prices YoY
- 12.2%
- Active inventory
- 165
- Price-to-rent
- 9.9×
Monthly cashflow live
- Estimated rent
- $2,271 medium interval (Pro) →
- Mortgage (P&I)
- −$705
- Tax est. 1.5%
- −$168 /mo · $2,018/yr
- Insurance
- −$56
- HOA
- −$0
- Vacancy / Maint / Mgmt
- −$477
- Net cashflow
- $865
Break-even live
2-unit breakdown (identical units grouped — click to expand)
| Units | Beds | Baths | Est. rent |
|---|---|---|---|
| 2× units | 2 | 1 | $2,272 |
| #1 | 2 | 1 | $1,136 |
| #2 | 2 | 1 | $1,136 |
| Total (2 units) | $2,271 | ||
UW: 25.0% down · 7.5% · 30yr · 1.5% tax · 5.0% vac · 8.0% maint · 8.0% mgmt
Financing live
Cash to close
- Down payment
- $33,625
- Closing costs
- $4,035
- Reserves months
- —
- Total cash needed
- —
Loan-product check · same deal, 3 products live
Conventional
25% down · 7.5% · 30yr
- Down + closing
- —
- Monthly P&I
- —
- Monthly cashflow
- —
- DSCR
- —
- Eligible?
- —
Personal DTI + credit; lowest rate.
DSCR
20% down · 8.5% · 30yr
- Down + closing
- —
- Monthly P&I
- —
- Monthly cashflow
- —
- DSCR
- —
- Eligible?
- —
No personal income docs; deal must DSCR.
Hard money
10% down · 12.0% · 12mo
- Down + closing
- —
- Monthly P&I
- —
- Monthly cashflow
- —
- DSCR
- —
- Eligible?
- —
Short-term bridge; refi at stabilization.
Rent comps 1 comps
| Address | Beds | Baths | Sqft | Rent | $/sqft | DOM | Units | Dist |
|---|---|---|---|---|---|---|---|---|
| 11 Fremont St Gloversville, NY | 2.0–3.0 | 1.5–2.0 | 1612 | $1,650 | $1.02 | 43d | 3 | 0.35mi |
Listing history 1 events
-
2026-05-13$134,500 Active 768-char remark
ⓘ Source: listings_history table (triggers on properties + properties_extension) + one-shot
backfill from property_details.listing_events for pre-trigger history.
Climate risk First Street
- Flood 1/10 Low FEMA zone X · 0% chance over 30 yrs
- Wildfire 3/10 Moderate
- Heat 2/10 Low 7 d/yr ≥93°F today · 16 d/yr by 30 yrs out
- Wind 2/10 Low 2% chance of damaging wind over 30 yrs
- Air quality 1/10 Low 0 unhealthy d/yr today · 0 by 30 yrs out
Nearby sold comps map
Loading sold comps map…
Walkable amenities ~0.75 mi
Loading nearby amenities…
Taxation est. · year 1
- Rental income
- $27,252
- − Mortgage interest
- −$7,534
- − Property taxes
- −$2,018
- − Insurance
- −$672
- − Repairs & maintenance
- −$2,180
- − Management
- −$2,180
- − Depreciation
- −$3,913
- Taxable income
- $8,755
- Est. tax owed @ 24.0%
- −$2,101
- After-tax cash flow
- $8,274/yr
For passive investors: Depreciation is non-cash, so a rental often shows a tax loss while cash-flowing — sheltering income. Rental losses are passive: they offset passive income freely, and up to $25,000/yr can offset ordinary (W-2) income if you actively participate and your MAGI is under $100k (phasing out to $0 by $150k); unused losses carry forward. On sale, claimed depreciation is recaptured at up to 25%, and gains may owe capital-gains tax (a 1031 exchange can defer both). Figures are a year-1 estimate at your 24.0% rate — not tax advice; consult a CPA.
Condition & rehab AI · 30 photos
This 2-family home requires moderate renovations to improve its condition and increase its value. The kitchen and bathroom need major updates, and the flooring and paint need attention. The home has a good roof and foundation, and the exterior could benefit from some maintenance. The backyard is a plus, but the landscaping could be improved.
Repairs flagged
- Major Kitchen cabinets — Old and outdated
- Major Kitchen appliances — Outdated and worn
- Major Bathroom fixtures — Old and outdated
- Major Flooring — Worn and outdated
- Minor Paint — Some wear
Value-add opportunities
- Resale New kitchen cabinets and appliances — Modern kitchen will attract more buyers
- Resale New bathroom fixtures — Modern bathroom will attract more buyers
- Resale New flooring — New flooring will make the home more appealing
- Resale Paint exterior — Fresh paint will improve curb appeal
- Resale Replace windows — New windows will improve energy efficiency and curb appeal
- Rental Replace HVAC system — Modern HVAC system will attract more renters and reduce utility costs
Renovation cost estimate screening
| Repair item | Severity | Est. cost |
|---|---|---|
| Kitchen cabinets · Old and outdated | Major | $15,000–50,000 |
| Kitchen appliances · Outdated and worn | Major | $15,000–50,000 |
| Bathroom fixtures · Old and outdated | Major | $15,000–50,000 |
| Flooring · Worn and outdated | Major | $15,000–50,000 |
| Paint · Some wear | Minor | $500–3,000 |
| Total estimated repair cost · 5 items | $60,500–203,000 |
Value-add ROI direction
- Resale New kitchen cabinets and appliances — Modern kitchen will attract more buyers ↑
- Resale New bathroom fixtures — Modern bathroom will attract more buyers ↑
- Resale New flooring — New flooring will make the home more appealing ↑
- Resale Paint exterior — Fresh paint will improve curb appeal ↑
- Resale Replace windows — New windows will improve energy efficiency and curb appeal ↑
- Rental Replace HVAC system — Modern HVAC system will attract more renters and reduce utility costs ↑
ⓘ Cost ranges are severity-bucket heuristics (US national rule-of-thumb). Get contractor quotes + a written scope before underwriting a rehab budget.
Schools (NCES district)
- District
- Gloversville City School District
- NCES district ID
- 3612270
- Math proficiency
- 26% ▼ -6.00%
- Reading proficiency
- 42% ▲ 7.00%
- Median HH income
- $36,775
- Composite
- 28.2/100
- National rank
- #6806
- State rank
- #565 of 590 in NY
Livability — Gloversville
- Score
- 82/100
- State rank
- #70
- US rank
- #1048
Category grades
Schools grade is shown separately in the Schools card above.
Census & demographics
- Census place
- Gloversville, NY
- Population (ZIP)
- 23,087
Population outlook (Fulton County) Hauer SSP2
- Today (2025)
- 51,132 people
- By 2030
- 49,114 · -3.9%
- By 2040
- 44,373 · -13.2%
- By 2050
- 39,321 · -23.1%
- By 2075
- 28,503 · -44.3%
- By 2100
- 19,268 · -62.3%
Race, ethnicity, and origin ACS 2023
- Neighborhood character
- Predominantly White (86%)
- Race & ethnicity
- White 86% Two or more races 8% Hispanic / Latino 5% Black 2% Asian 1%
- Hispanic origin (detail)
- Puerto Rican 3%
- Common ancestry
- Lithuanian 5% Romanian 4% Iranian 4%
- Foreign-born
- 2% · Canada, China
- Languages at home
- 97% English-only · Spanish 2%
Political lean MEDSL · Fulton
- 2024 margin
- Solid R (+35.9) · D 32.1% · R 67.9%
- 2008→2024 swing
- -26.6pp toward R · 2008: -9.2pp · 2024: -35.9pp
- All cycles
- 2024: R+35.9 2020: R+31.4 2016: R+35.5 2012: R+10.5 2008: R+9.2
Not yet ingested
- Civics
- —
Market trends
- HPI YoY
- ▲ 34.22%
- Current HPI
- 315.1368
- Rent YoY
- —
- Metro
- —
- State GDP YoY
- ▲ 2.60%
- F500 in state
- 92
Industry mix (Fortune 500 HQ in NY)
| Industry | F500 HQs | Revenue |
|---|---|---|
| Financial Services | 10 | $950B |
|
||
| Consumer Goods | 9 | $162B |
|
||
| Insurance | 4 | $225B |
|
||
| Telecommunications | 2 | $144B |
|
||
| Pharmaceuticals | 2 | $112B |
|
||
| Media / Entertainment | 2 | $69B |
|
||
Price history
2 events — show timeline
- 2026-05-19 Pending — Global MLS
- 2026-05-13 Listed $134,500 Global MLS
Cash-flow waterfall
monthlySold comps — $/sqft
last 12 mo · ≤1 miLoading sold comps…