 🏢 Co-op
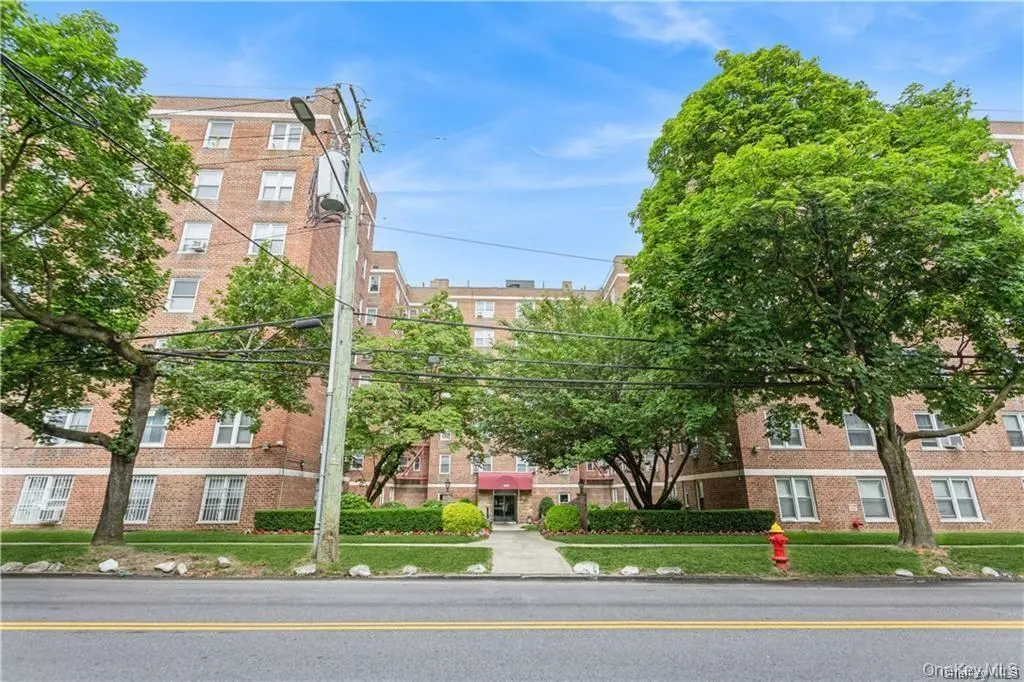
485 Bronx River Rd Unit B64 · Yonkers, NY
Flood risk 5/10 · Moderate
- FEMA flood zone
- X (unshaded)
- Chance of flooding over 30 yrs
- 0.27%
- Est. flood insurance / yr
- $473 – $860
Fire risk 1/10 · Minimal
- Est. fire insurance / yr
- $691 – $1,283
Heat risk 6/10 · Moderate
- Hot days now (above 98°F)
- 7 days/yr
- Hot days in 30 yrs
- 15 days/yr
Wind risk 6/10 · Moderate
- Chance of severe wind over 30 yrs
- 27.0%
Air-quality risk 5/10 · Moderate
- Unhealthy air days now
- 6 days/yr
- Unhealthy air days in 30 yrs
- 8 days/yr
Risk factors via First Street. Map © Google.
Why this score? — see what drove the B+ grade
The composite is a weighted blend of 9 inputs, each scored 0–100. Each bar is that input's sub-score; the figure is the points it added to the 100-point composite (weight × sub-score).
- Cash flow +30.0/30.0
- ARV discount +11.4/15.0
- 1% rule +10.0/10.0
- DSCR +10.0/10.0
- Rent growth +5.0/5.0
- Schools +4.1/10.0
- Condition / age +4.0/5.0
- Livability +3.4/5.0
- Appreciation +0.0/10.0
$114,500
🖨 Deal sheet 📄 Offer letter ✓ Due diligence
Listing remarks MLS
Well maintained studio apartment is a Commuter's Dream. Top floor unit is bright and spacious and boasts unobstructed eastern exposure, ample living and closet spaces, wall-to-wall carpeting, and lots of charm. The well-maintained building includes amenities such as an exercise room, multiple laundry rooms, elevators, an updated security camera system, a live-in superintendent, and is conveniently located near a Metro North station, bus stops, highways, parks, and shops. Board approval is necessary for this property.
Key facts
- Garage
- Built 1950
- Listed 84 days
Neighborhood map
What this means for you Summary
Snapshot
- This is a ?-bed/1.0-bath townhouse listed at $114k. Condition is rated good.
Deal economics
- At list price, monthly cash flow is $1k ($13k/yr) — positive.
- The deal already cash-flows at list — no discount required.
- Meets the 1% rule at list price ($2k rent vs $114k).
- Recommended offer: $108k (6.0% below list) — sets the bar for market timing.
- Cap rate 18.0% vs local median 5.3% in Yonkers — top-decile yield for the area; either an underpriced asset or a hidden risk that comps aren't pricing in. Stress-test before assuming the spread holds.
Location & tenants
- Location reads 68/100 on livability (#528 in NY) — a middle-class / working-renter tenant base. Strengths: employment A, commute B; Watch: amenities F, cost of living F.
- Yonkers City School District (suburban): math 41% / reading 54% proficiency, ranked #413 of 590 in NY (top 70%) — families likely to look elsewhere, expect single-tenant / working-renter base with shorter leases; 64% free/reduced lunch — lower-income household profile, screen leases tightly.
- Market conditions: Rents rising fast (+21.0%/yr); 165 active listings in the ZIP; 14 comparable units currently listed for rent nearby; rentals at typical pace (median 24d on market — plan ~3-4 weeks tenant-placement turnaround); solid renter incomes; 954 units permitted in Westchester County in 2024 (649 in 5+ unit buildings).
Forward outlook
- Local home prices are declining (-3.0%/yr); year-one equity from $792 of loan paydown is wiped out by about $3k of value loss. Plan a longer hold.
- Westchester County population projected at +10% by 2050 — modest demand growth; plan on rents tracking national, not racing it.
- At projected returns (-3.0% appreciation + 8.0% rent growth), your $32k cash investment doubles in ~3 years — after that, you're playing with house money.
Negotiation context
- It's been on market 84 days — a 6% lower offer ($108k) is reasonable based on typical stale-listing flexibility.
- 2 sale attempts since 2y ago; this cycle's ask has dropped $10k (8%) from the opening price — seller is motivated, your offer sets the floor, not the list.
Risks & watch-outs
- Watch-outs: built in 1950 — expect roof / HVAC / electrical / plumbing capex.
- Climate carrying-cost: moderate flood risk; major wind risk, 27% chance of damaging wind over 30y; extreme-heat days projected 7→15/yr by 2055 (HVAC capex compounding) — expect insurance premiums to compound above CPI over the hold.
Questions for the listing agent
- It's been on market 84 days. Have you received any prior offers? Is the seller open to a 6% concession, seller financing, or rate buy-down credit?
- Built in 1950 — when were the roof, HVAC, electrical panel, plumbing, and water heater last replaced?
- Why hasn't it sold? Are there any deal-killer items the seller is aware of (foundation, flood, title, zoning, code violations)?
- Is there a deadline driving the sale (1031 exchange, divorce, estate, relocation)? That informs how much negotiation room exists.
- What's the average days-on-market for RENTAL listings here right now (not sales)? A rising rental-DOM trend means longer vacancies and softer asking-rent achievability than the comps imply.
- What's the recent tenant-quality profile in this submarket — average credit score on applications, eviction rate, late-payment / NSF rate, and stable-employment percentage? A property-management company in the area should have these aggregated.
- How much new for-sale + rental construction is in the pipeline within 1–3 miles? Heavy new supply typically softens prices + rents 12–24 months out; constrained supply supports both.
Investment metrics
- 1% rule
- 2.11% ✓
- Cap rate
- 18.04%
- Cash-on-cash
- 41.96%
- DSCR
- 2.87
- GRM
- 3.9
CMA / ARV
- ARV (median comp)
- $125,497
- List price
- $114,500
- Delta
- -8.76%
- Verdict
- FAIR
- Comps
- 20 within 1.0 mi
Show comp detail 10 sales within ~0.75 mi
| Address | Dist | Beds/Ba | Sqft | Sold | Price | $/sf | Match |
|---|---|---|---|---|---|---|---|
| 555 Bronx River Rd Unit 2K | 0.22mi | —/1.0 | 500 (0%) | 7mo | $145,000 | $290 | 84 |
| 355 Bronx River Rd Unit 4B | 0.32mi | —/1.0 | 500 (0%) | 10mo | $80,000 | $160 | 77 |
| 333 Bronx River Rd #123 | 0.40mi | —/1.0 | 500 (0%) | 9mo | $141,000 | $282 | 74 |
| 766 Bronx River Rd Unit B64 | 0.69mi | —/1.0 | 500 (0%) | 1mo | $97,000 | $194 | 67 |
| 277 Bronx River Rd Unit 5M | 0.50mi | —/1.0 | 550 (+10%) | 0mo | $115,000 | $209 | 60 |
| 245 Bronx River Rd Unit 6A | 0.56mi | —/1.0 | 525 (+5%) | 9mo | $87,000 | $166 | 58 |
| 277 Bronx River Rd Unit 2A | 0.50mi | —/1.0 | 550 (+10%) | 5mo | $110,000 | $200 | 56 |
| 80 William St Unit 3C | 0.65mi | —/1.0 | 525 (+5%) | 12mo | $97,500 | $186 | 51 |
| 687 Bronx River Rd Unit 6H | 0.52mi | —/1.0 | 475 (-5%) | 21mo | $105,000 | $221 | 50 |
| 277 Bronx River Rd Unit 4J | 0.50mi | —/1.0 | 550 (+10%) | 22mo | $130,000 | $236 | 42 |
Match score weights: distance 35% · size 25% · config 20% · recency 20%. Top-matched comps best support the ARV.
Projected returns pro-forma
-3.0% appreciation · 8.0% rent growth · sell at horizon
- IRR
- 44.2%
- Equity multiple
- 3.05×
- Total profit
- $65,674
- Equity at exit
- $17,072
- IRR
- 52.4%
- Equity multiple
- 7.47×
- Total profit
- $207,498
- Equity at exit
- $9,900
Cash invested: $32,060 (down + closing). Projections, not guarantees.
Landlord ↔ Tenant lean methodology
- Overall (CITY)
- 5 Strongly Tenant-Friendly
- State New York
- 15 Strongly Tenant-Friendly · D+10
- County
- — inherits STATE
- City Yonkers
- 5 Strongly Tenant-Friendly · D+20
ZIP-level market 10704
- Rents YoY
- 21.0%
- Active inventory
- 165
- Price-to-rent
- 3.9×
Monthly cashflow live
- Estimated rent
- $2,421 high interval (Pro) →
- Mortgage (P&I)
- −$600
- Tax est. 1.5%
- −$143 /mo · $1,718/yr
- Insurance
- −$48
- HOA
- −$0
- Vacancy / Maint / Mgmt
- −$508
- Net cashflow
- $1,121
Break-even live
UW: 25.0% down · 7.5% · 30yr · 1.5% tax · 5.0% vac · 8.0% maint · 8.0% mgmt
Financing live
Cash to close
- Down payment
- $28,625
- Closing costs
- $3,435
- Reserves months
- —
- Total cash needed
- —
Loan-product check · same deal, 3 products live
Conventional
25% down · 7.5% · 30yr
- Down + closing
- —
- Monthly P&I
- —
- Monthly cashflow
- —
- DSCR
- —
- Eligible?
- —
Personal DTI + credit; lowest rate.
DSCR
20% down · 8.5% · 30yr
- Down + closing
- —
- Monthly P&I
- —
- Monthly cashflow
- —
- DSCR
- —
- Eligible?
- —
No personal income docs; deal must DSCR.
Hard money
10% down · 12.0% · 12mo
- Down + closing
- —
- Monthly P&I
- —
- Monthly cashflow
- —
- DSCR
- —
- Eligible?
- —
Short-term bridge; refi at stabilization.
Rent comps 14 comps
| Address | Beds | Baths | Sqft | Rent | $/sqft | DOM | Units | Dist |
|---|---|---|---|---|---|---|---|---|
| 18 N Bond St Unit 3D Mt Vernon, NY | 1.0 | 1.0 | 750 | $2,000 | $2.67 | 24d | 1 | 0.38mi |
| 13 N Bond St Mount Vernon, NY | 1.0 | 1.0 | 600 | $1,785 | $2.98 | 24d | 1 | 0.41mi |
| 103 North St Mount Vernon, NY | 1.0 | 1.0 | 720 | $1,900 | $2.64 | 20d | 1 | 0.45mi |
| 2325 Cortlandt St Unit 4 Mt Vernon, NY | 2.0 | 1.0 | 700 | $2,300 | $3.29 | 24d | 1 | 0.56mi |
| 216 1st St Unit 1 Yonkers, NY | 1.0 | 1.0 | 600 | $2,000 | $3.33 | 43d | 1 | 0.67mi |
| 119 S 11th Ave Unit 1 Mt Vernon, NY | 2.0 | 1.0 | 700 | $2,800 | $4.00 | 11d | 1 | 0.73mi |
| 33 William St Mount Vernon, NY | 1.0–2.0 | 1.0 | 725 | $2,675 | $3.69 | 22d | 2 | 0.76mi |
| 669 N Terrace Ave Mount Vernon, NY | 1.0 | 1.0 | 750 | $2,031 | $2.71 | 24d | 1 | 0.86mi |
| 42 Broad St W Mount Vernon, NY | 3.0 | 1.0–2.0 | 955 | $3,199 | $3.35 | 2d | 16 | 0.95mi |
| 42 Broad St W Mount Vernon, NY | 3.0 | 1.0–2.0 | 1014 | $5,080 | $5.01 | 24d | 15 | 0.95mi |
| 7 Monroe St Unit 3A Mt Vernon, NY | 2.0 | 1.0 | 600 | $2,200 | $3.67 | 19d | 1 | 1.22mi |
| 118 N Columbus Ave Mount Vernon, NY | 1.0 | 1.0 | 650 | $1,700 | $2.62 | 24d | 1 | 1.33mi |
| 429 S 3rd Ave Mount Vernon, NY | 1.0 | 1.0 | 600 | $2,300 | $3.83 | 3d | 1 | 1.39mi |
| 675 McLean Ave Unit 006H Yonkers, NY | 1.0 | 1.0 | 577 | $2,071 | $3.59 | 4d | 1 | 1.49mi |
Listing history 16 events
-
2026-06-18days on market $114,500 Active 84 DOM
-
2026-06-17days on market $114,500 Active 83 DOM
-
2026-06-16days on market $114,500 Active 82 DOM
-
2026-06-15days on market $114,500 Active 81 DOM
-
2026-06-13days on market $114,500 Active 79 DOM
-
2026-06-09days on market $114,500 Active 75 DOM
-
2026-06-08days on market $114,500 Active 74 DOM
-
2026-06-07days on market $114,500 Active 73 DOM
-
2026-06-04days on market $114,500 Active 70 DOM
-
2026-06-03days on market $114,500 Active 69 DOM
-
2026-06-02days on market $114,500 Active 68 DOM
-
2026-06-01days on market $114,500 Active 67 DOM
-
2026-05-31days on market $114,500 Active 66 DOM
-
2026-03-25$125,000 Active 523-char remark
Show marketing remark (523 chars)
Well maintained studio apartment is a Commuter's Dream. Top floor unit is bright and spacious and boasts unobstructed eastern exposure, ample living and closet spaces, wall-to-wall carpeting, and lots of charm. The well-maintained building includes amenities such as an exercise room, multiple laundry rooms, elevators, an updated security camera system, a live-in superintendent, and is conveniently located near a Metro North station, bus stops, highways, parks, and shops. Board approval is necessary for this property.
-
2024-11-26historical $1,650
-
2024-10-23$1,650
ⓘ Source: listings_history table (triggers on properties + properties_extension) + one-shot
backfill from property_details.listing_events for pre-trigger history.
Climate risk First Street
- Flood 5/10 Major FEMA zone X (unshaded) · 27% chance over 30 yrs
- Wildfire 1/10 Low
- Heat 6/10 Major 7 d/yr ≥98°F today · 15 d/yr by 30 yrs out
- Wind 6/10 Major 27% chance of damaging wind over 30 yrs
- Air quality 5/10 Major 6 unhealthy d/yr today · 8 by 30 yrs out
Nearby sold comps map
Loading sold comps map…
Walkable amenities ~0.75 mi
Loading nearby amenities…
Taxation est. · year 1
- Rental income
- $29,048
- − Mortgage interest
- −$6,414
- − Property taxes
- −$1,718
- − Insurance
- −$572
- − Repairs & maintenance
- −$2,324
- − Management
- −$2,324
- − Depreciation
- −$3,331
- Taxable income
- $12,365
- Est. tax owed @ 24.0%
- −$2,968
- After-tax cash flow
- $10,485/yr
For passive investors: Depreciation is non-cash, so a rental often shows a tax loss while cash-flowing — sheltering income. Rental losses are passive: they offset passive income freely, and up to $25,000/yr can offset ordinary (W-2) income if you actively participate and your MAGI is under $100k (phasing out to $0 by $150k); unused losses carry forward. On sale, claimed depreciation is recaptured at up to 25%, and gains may owe capital-gains tax (a 1031 exchange can defer both). Figures are a year-1 estimate at your 24.0% rate — not tax advice; consult a CPA.
Condition & rehab AI · 12 photos
A well-maintained studio apartment in a multi-family building with good curb appeal and updated fixtures. Minor cosmetic improvements can further enhance its value.
Value-add opportunities
- Both Painting the exterior brick — Enhances curb appeal and property value
- Resale Updating the kitchen appliances — Modernizes the kitchen and attracts more buyers
- Resale Upgrading the flooring — New flooring can significantly increase the home's appeal
Renovation cost estimate screening
Value-add ROI direction
- Both Painting the exterior brick — Enhances curb appeal and property value ↑
- Resale Updating the kitchen appliances — Modernizes the kitchen and attracts more buyers ↑
- Resale Upgrading the flooring — New flooring can significantly increase the home's appeal ↑
ⓘ Cost ranges are severity-bucket heuristics (US national rule-of-thumb). Get contractor quotes + a written scope before underwriting a rehab budget.
Schools (NCES district)
- District
- Yonkers City School District
- NCES district ID
- 3631920
- Math proficiency
- 41% ▼ -1.00%
- Reading proficiency
- 54% ▲ 14.00%
- Median HH income
- $58,042
- Composite
- 41.43/100
- National rank
- #3471
- State rank
- #413 of 590 in NY
Livability — Yonkers
- Score
- 68/100
- State rank
- #528
- US rank
- #9394
Category grades
Schools grade is shown separately in the Schools card above.
Census & demographics
- Census place
- Yonkers, NY
- County
- Westchester County · 709,332 people
- City population
- 212,407
- Metro
- New York-Newark-Jersey City, NY-NJ-PA
- Population (ZIP)
- 31,921
- Household income
- $106,786
- Rent vs Own
- Severe rent burden
- 1078.0
Population outlook (Westchester County) Hauer SSP2
- Today (2025)
- 1,028,035 people
- By 2030
- 1,051,636 · +2.3%
- By 2040
- 1,098,520 · +6.9%
- By 2050
- 1,136,044 · +10.5%
- By 2075
- 1,196,925 · +16.4%
- By 2100
- 1,175,147 · +14.3%
Race, ethnicity, and origin ACS 2023
- Neighborhood character
- Diverse neighborhood (Simpson 0.64)
- Race & ethnicity
- White 50% Hispanic / Latino 32% Two or more races 15% Black 7% Asian 5%
- Hispanic origin (detail)
- Mexican 1% Puerto Rican 11% Cuban 2% Dominican 9%
- Common ancestry
- Romanian 2% Subsaharan African 2% Scotch-Irish 2%
- Foreign-born
- 32% · Canada, Jamaica, China
- Languages at home
- 54% English-only · Spanish 25% Other Indo-European 13% Russian/Polish/Slavic 2%
Political lean MEDSL · Westchester
- 2024 margin
- Strong D (+26.3) · D 63.1% · R 36.9%
- 2008→2024 swing
- -1.3pp toward R · 2008: 27.6pp · 2024: 26.3pp
- All cycles
- 2024: D+26.3 2020: D+36.3 2016: D+32.8 2012: D+22.2 2008: D+27.6
Not yet ingested
- Civics
- —
Market trends
- HPI YoY
- ▼ -466.66%
- Current HPI
- 293.4414
- Rent YoY
- ▲ 21.03%
- Metro
- New York-Newark-Jersey City, NY-NJ-PA
- State GDP YoY
- ▲ 2.60%
- F500 in state
- 92
Industry mix (Fortune 500 HQ in NY)
| Industry | F500 HQs | Revenue |
|---|---|---|
| Financial Services | 10 | $950B |
|
||
| Consumer Goods | 9 | $162B |
|
||
| Insurance | 4 | $225B |
|
||
| Telecommunications | 2 | $144B |
|
||
| Pharmaceuticals | 2 | $112B |
|
||
| Media / Entertainment | 2 | $69B |
|
||
Price history
+7475.8% since first listed3 events — show timeline
- 2026-03-25 Listed $125,000 OneKey® MLS as Distributed by MLS Grid
- 2024-11-26 Rental Removed $1,650 ONEKEY
- 2024-10-23 Listed for Rent $1,650 ONEKEY
Cash-flow waterfall
monthlySold comps — $/sqft
last 12 mo · ≤1 miLoading sold comps…