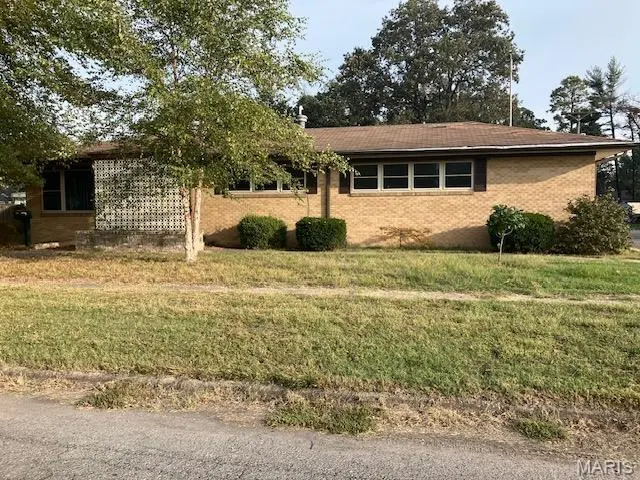
208 W Cleveland St · Malden, MO
Flood risk 1/10 · Minimal
- FEMA flood zone
- X
- Chance of flooding over 30 yrs
- 0.0%
- Est. flood insurance / yr
- $473 – $860
Fire risk 1/10 · Minimal
- Est. fire insurance / yr
- $1,054 – $1,958
Heat risk 6/10 · Moderate
- Hot days now (above 110°F)
- 7 days/yr
- Hot days in 30 yrs
- 20 days/yr
Wind risk 3/10 · Minor
- Chance of severe wind over 30 yrs
- 6.0%
Air-quality risk 2/10 · Minimal
- Unhealthy air days now
- 1 days/yr
- Unhealthy air days in 30 yrs
- 1 days/yr
Risk factors via First Street. Map © Google.
Why this score? — see what drove the C grade
The composite is a weighted blend of 9 inputs, each scored 0–100. Each bar is that input's sub-score; the figure is the points it added to the 100-point composite (weight × sub-score).
- Cash flow +23.0/30.0
- ARV discount +7.5/15.0
- DSCR +7.4/10.0
- Appreciation +6.6/10.0
- 1% rule +5.0/10.0
- Livability +3.0/5.0
- Rent growth +2.5/5.0
- Condition / age +2.5/5.0
- Schools +2.0/10.0
$132,500
🖨 Deal sheet (PDF) 📄 Offer letter ✓ Due diligence
Key facts
- 0.79 acre lot
- 2 parking spots
- Built 1955
Property features AI
Exterior
- Parking: Carport with 2 spaces
- Utilities: Public water; Public sewer; Electric with 220 volts; Electricity available; Sewer available; Water available
- Home design: Single-family residence; One level
- Construction: Brick construction
- Exterior features: City lot
Interior
- Bedrooms: 3 bedrooms on the main level
- Bathrooms: 2 full bathrooms; 1 half bathroom
- Interior features: Living room fireplace; Cellar/partial basement; Forced air heating; Ceiling fans; Central air conditioning
Neighborhood map
What this means for you Summary
Snapshot
- This is a 3-bed/2.5-bath other listed at $132k.
Deal economics
- At list price, monthly cash flow is $236 ($3k/yr) — positive.
- The deal already cash-flows at list — no discount required.
- To meet the 1% rule (rent ≥ 1% of price), the offer needs to be $132k (0.2% below list).
- Recommended offer: $132k (0.2% below list) — sets the bar for 1% rule.
- Cap rate 8.4% vs local median 6.6% in Malden — meaningfully above typical; check what's discounted (condition, days-on-market, listing class) to confirm the premium yield is real.
Location & tenants
- Location reads 59/100 on livability (#572 in MO) — a working-class tenant base; expect higher turnover. Strengths: cost of living A+, housing A+; Watch: health & safety C-, crime F, amenities F.
- Malden R-I (town): math 19% / reading 31% proficiency, ranked #294 of 324 in MO (top 91%) — low school quality limits family demand, transient renter base, plan for 1-2y turnover; 63% free/reduced lunch — lower-income household profile, screen leases tightly.
- Zoned schools: Malden Lower Elem. (math 23% / reading 35%, grade F, #842 of 1,115 statewide, top 76%, 454 students, 100% FRL); Malden High (math 12% / reading 27%, grade F, #478 of 521 statewide, top 92%, 425 students, 100% FRL) — zoned schools average 100% FRL vs 63% district-wide (37 pts higher); higher-poverty schools than district average — tighter screening recommended.
- Market conditions: 36 active listings in the ZIP; 30 units permitted in Dunklin County in 2024 (0 in 5+ unit buildings).
Forward outlook
- In year one you build about $5k of equity ($916 loan paydown + $4k appreciation (3.3% local appreciation)).
- Dunklin County population projected at -22% by 2050 — secular population decline; favor cash flow + early exit over multi-decade hold.
- At projected returns (3.3% appreciation + 3.0% rent growth), your $37k cash investment doubles in ~5 years — after that, you're playing with house money.
- By year 7, paydown + projected appreciation supports a ~$33k cash-out refi (75% LTV) — recoverable capital for the next deal without selling this one.
Negotiation context
- Only 1 days on market — expect competitive offers; lowballing is unlikely to land.
- 6 sale attempts since 3y ago with the ask held roughly flat each time — persistent listings suggest the price (not the market) is what's stuck; bring a comps-based counter.
Risks & watch-outs
- Watch-outs: built in 1955 — expect roof / HVAC / electrical / plumbing capex.
- Climate carrying-cost: extreme-heat days projected 7→20/yr by 2055 (HVAC capex compounding) — expect insurance premiums to compound above CPI over the hold.
Questions for the listing agent
- Built in 1955 — when were the roof, HVAC, electrical panel, plumbing, and water heater last replaced?
- Is there a deadline driving the sale (1031 exchange, divorce, estate, relocation)? That informs how much negotiation room exists.
- Schools are F-rated, which usually means shorter tenancies and higher turnover. Who's the typical renter profile here, and what's been the actual vacancy rate?
- Crime grade is F in this area — have there been break-ins, vandalism, or insurance claims at this property in the last 3 years? What carrier currently insures it and at what premium?
- What's the average days-on-market for RENTAL listings here right now (not sales)? A rising rental-DOM trend means longer vacancies and softer asking-rent achievability than the comps imply.
- What's the recent tenant-quality profile in this submarket — average credit score on applications, eviction rate, late-payment / NSF rate, and stable-employment percentage? A property-management company in the area should have these aggregated.
- How much new for-sale + rental construction is in the pipeline within 1–3 miles? Heavy new supply typically softens prices + rents 12–24 months out; constrained supply supports both.
Investment metrics
- 1% rule
- 1.00% ✗
- Cap rate
- 8.43%
- Cash-on-cash
- 7.64%
- DSCR
- 1.34
- GRM
- 8.4
CMA / ARV
No comps found within radius.
Projected returns pro-forma
3.26% appreciation · 3.0% rent growth · sell at horizon
- IRR
- 15.3%
- Equity multiple
- 1.88×
- Total profit
- $32,771
- Equity at exit
- $61,514
- IRR
- 16.8%
- Equity multiple
- 3.52×
- Total profit
- $93,314
- Equity at exit
- $96,334
Cash invested: $37,100 (down + closing). Projections, not guarantees.
Landlord ↔ Tenant lean methodology
- Overall (STATE)
- 81 Strongly Landlord-Friendly
- State Missouri
- 81 Strongly Landlord-Friendly · R+10
- County
- — inherits STATE
- City
- — inherits STATE
ZIP-level market 63863
- Home prices YoY
- 2.9%
- Active inventory
- 36
- Price-to-rent
- 8.4×
Monthly cashflow live
- Estimated rent
- $1,322 medium interval (Pro) →
- Mortgage (P&I)
- −$695
- Tax from tax record
- −$58 /mo · $702/yr
- Insurance
- −$55
- HOA
- −$0
- Vacancy / Maint / Mgmt
- −$278
- Net cashflow
- $236
Break-even live
Sensitivity live
| Price | -10% $311 | -5% $274 | +0% $236 | +5% $199 | +10% $161 |
|---|---|---|---|---|---|
| Rent | -10% $132 | -5% $184 | +0% $236 | +5% $288 | +10% $341 |
| Rate | -1.0pp $303 | -0.5pp $270 | base $236 | +0.5pp $202 | +1.0pp $167 |
UW: 25.0% down · 7.5% · 30yr · 1.5% tax · 5.0% vac · 8.0% maint · 8.0% mgmt
Financing live
Cash to close
- Down payment
- $33,125
- Closing costs
- $3,975
- Reserves months
- —
- Total cash needed
- —
Loan-product check · same deal, 3 products live
Conventional
25% down · 7.5% · 30yr
- Down + closing
- —
- Monthly P&I
- —
- Monthly cashflow
- —
- DSCR
- —
- Eligible?
- —
Personal DTI + credit; lowest rate.
DSCR
20% down · 8.5% · 30yr
- Down + closing
- —
- Monthly P&I
- —
- Monthly cashflow
- —
- DSCR
- —
- Eligible?
- —
No personal income docs; deal must DSCR.
Hard money
10% down · 12.0% · 12mo
- Down + closing
- —
- Monthly P&I
- —
- Monthly cashflow
- —
- DSCR
- —
- Eligible?
- —
Short-term bridge; refi at stabilization.
Listing history 2 events
-
2026-06-18status $132,500 Coming Soon 1 DOM
-
2026-06-18$132,500 Active 1 DOM
ⓘ Source: listings_history table (triggers on properties + properties_extension) + one-shot
backfill from property_details.listing_events for pre-trigger history.
Tax reassessment forecast MO · Resets to sale price
- Current annual tax
- $702 · $58/mo
- Projected year-2 tax
- $1,285 · $107/mo
- Expected delta
- +$583/yr (+$49/mo · 83.1%)
ⓘ Screening estimate from a state-policy table — verify with the county assessor before closing.
Climate risk First Street
- Flood 1/10 Low FEMA zone X · 0% chance over 30 yrs
- Wildfire 1/10 Low
- Heat 6/10 Major 7 d/yr ≥110°F today · 20 d/yr by 30 yrs out
- Wind 3/10 Moderate 6% chance of damaging wind over 30 yrs
- Air quality 2/10 Low 1 unhealthy d/yr today · 1 by 30 yrs out
Nearby sold comps map
Loading sold comps map…
Walkable amenities ~0.75 mi
Loading nearby amenities…
Taxation est. · year 1
- Rental income
- $15,867
- − Mortgage interest
- −$7,422
- − Property taxes
- −$702
- − Insurance
- −$662
- − Repairs & maintenance
- −$1,269
- − Management
- −$1,269
- − Depreciation
- −$3,855
- Taxable income
- $688
- Est. tax owed @ 24.0%
- −$165
- After-tax cash flow
- $2,668/yr
For passive investors: Depreciation is non-cash, so a rental often shows a tax loss while cash-flowing — sheltering income. Rental losses are passive: they offset passive income freely, and up to $25,000/yr can offset ordinary (W-2) income if you actively participate and your MAGI is under $100k (phasing out to $0 by $150k); unused losses carry forward. On sale, claimed depreciation is recaptured at up to 25%, and gains may owe capital-gains tax (a 1031 exchange can defer both). Figures are a year-1 estimate at your 24.0% rate — not tax advice; consult a CPA.
Schools (NCES district)
- District
- Malden R-I
- NCES district ID
- 2919890
- Math proficiency
- 19% ▼ -13.00%
- Reading proficiency
- 31% ▼ -3.00%
- Median HH income
- $29,537
- Composite
- 20.06/100
- National rank
- #8656
- State rank
- #294 of 324 in MO
Livability — Malden
- Score
- 59/100
- State rank
- #572
- US rank
- #20610
Category grades
Schools grade is shown separately in the Schools card above.
Census & demographics
- Census place
- Malden, MO
- City population
- 5,348
- Population (ZIP)
- 5,348
Population outlook (Dunklin County) Hauer SSP2
- Today (2025)
- 28,599 people
- By 2030
- 27,230 · -4.8%
- By 2040
- 24,696 · -13.6%
- By 2050
- 22,402 · -21.7%
- By 2075
- 17,776 · -37.8%
- By 2100
- 13,890 · -51.4%
Race, ethnicity, and origin ACS 2023
- Neighborhood character
- Predominantly White (79%)
- Race & ethnicity
- White 79% Black 11% Two or more races 6% Hispanic / Latino 3%
- Common ancestry
- Italian 3% Slovak 2% Serbian 2%
- Foreign-born
- 2% · Canada
- Languages at home
- 97% English-only · Spanish 3% Other Indo-European 1%
Political lean MEDSL · Dunklin
- 2024 margin
- Solid R (+61.8) · D 18.8% · R 80.5%
- 2008→2024 swing
- -40.5pp toward R · 2008: -21.3pp · 2024: -61.8pp
- All cycles
- 2024: R+61.8 2020: R+57.0 2016: R+53.6 2012: R+30.2 2008: R+21.3
Not yet ingested
- Civics
- —
Market trends
- HPI YoY
- ▲ 3.26%
- Current HPI
- 116.067
- Rent YoY
- —
- Metro
- —
- State GDP YoY
- ▲ 1.84%
- F500 in state
- 20
Industry mix (Fortune 500 HQ in MO)
| Industry | F500 HQs | Revenue |
|---|---|---|
| Healthcare | 1 | $163B |
|
||
| Insurance | 1 | $21B |
|
||
| Industrial Technology | 1 | $17B |
|
||
| Retail | 1 | $16B |
|
||
| Industrial Distribution | 1 | $10B |
|
||
| Utilities | 1 | $9B |
|
||
Price history
-19.7% since first listed12 events — show timeline
- 2026-06-17 Listed $132,500 MARIS as Distributed by MLS Grid
- 2025-07-17 Listed $135,000 MARIS as Distributed by MLS Grid
- 2025-02-21 Price Changed $142,000 MARIS as Distributed by MLS Grid
- 2024-12-09 Listed $150,000 MARIS as Distributed by MLS Grid
- 2024-10-07 Delisted — MARIS as Distributed by MLS Grid
- 2024-05-02 Relisted — MARIS as Distributed by MLS Grid
- 2024-04-07 Delisted — MARIS as Distributed by MLS Grid
- 2024-03-04 Relisted — MARIS as Distributed by MLS Grid
- 2024-02-06 Contingent — MARIS as Distributed by MLS Grid
- 2023-10-07 Listed $165,000 MARIS as Distributed by MLS Grid
- 1996-09-24 Sold (Public Records) — Public Records
- 1994-04-27 Sold (Public Records) — Public Records
Property tax history
+2.1%/yrLatest (2025): $702 · +2.5% YoY. Source: county tax records.
Cash-flow waterfall
monthlySold comps — $/sqft
last 12 mo · ≤1 miLoading sold comps…