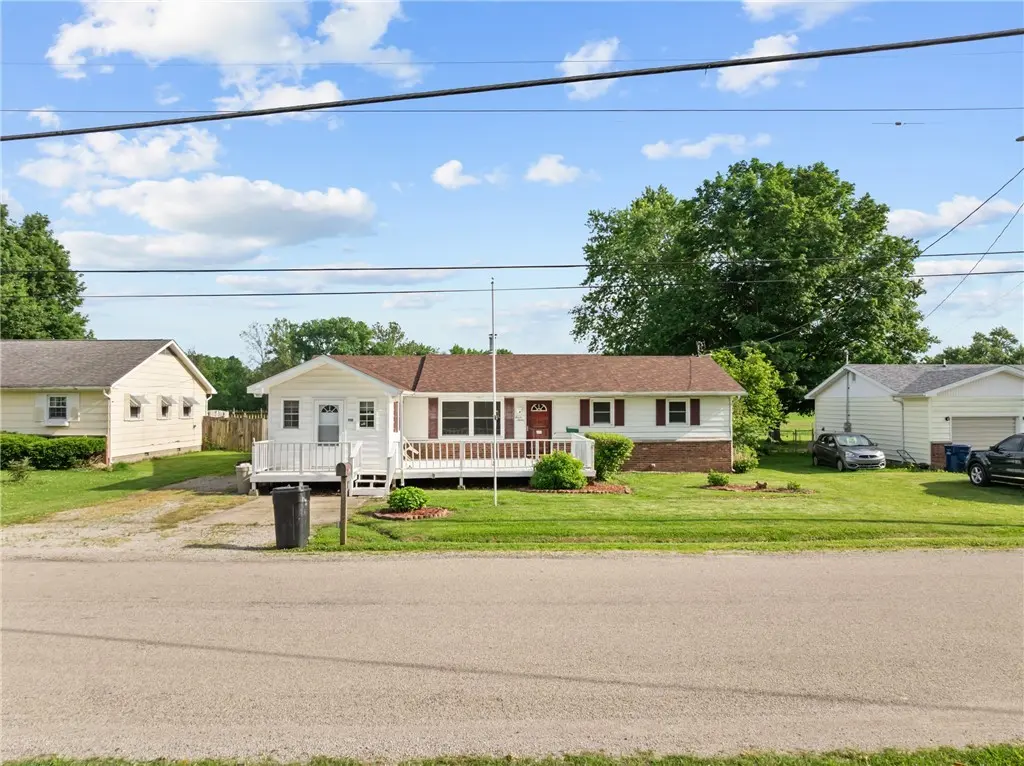
712 E Blackburn St · Paris, IL
Flood risk 1/10 · Minimal
- FEMA flood zone
- X (unshaded)
- Chance of flooding over 30 yrs
- 0.0%
- Est. flood insurance / yr
- $473 – $860
Fire risk 1/10 · Minimal
- Est. fire insurance / yr
- $804 – $1,492
Heat risk 4/10 · Minor
- Hot days now (above 105°F)
- 7 days/yr
- Hot days in 30 yrs
- 19 days/yr
Wind risk 2/10 · Minimal
- Chance of severe wind over 30 yrs
- 1.0%
Air-quality risk 4/10 · Minor
- Unhealthy air days now
- 3 days/yr
- Unhealthy air days in 30 yrs
- 5 days/yr
Risk factors via First Street. Map © Google.
Why this score? — see what drove the C- grade
The composite is a weighted blend of 9 inputs, each scored 0–100. Each bar is that input's sub-score; the figure is the points it added to the 100-point composite (weight × sub-score).
- Cash flow +15.9/30.0
- ARV discount +14.6/15.0
- DSCR +4.9/10.0
- Livability +3.6/5.0
- 1% rule +3.3/10.0
- Schools +3.1/10.0
- Rent growth +2.5/5.0
- Condition / age +2.5/5.0
- Appreciation +0.0/10.0
$159,900
🖨 Deal sheet (PDF) 📄 Offer letter ✓ Due diligence
Listing remarks
Located on a quiet dead-end street, this well-maintained 3-bedroom, 1 full bath, 1 half bath home offers a unique attached apartment/in-law suite with an additional bedroom and half bath, bringing the property total to 4 bedrooms, 1 full bath, and 2 half baths. Recent updates include a new roof (2023), new central air (2023), replacement windows throughout, and a brand-new privacy fence with a large gate entrance. Enjoy two spacious living areas, one featuring a gas fireplace and the other a wood-burning stove, both providing additional heat sources. A whole-house fan helps keep the home comfortable during warmer months. Outside you'll find a large front deck, fenced backyard, large storage
Key facts
- Whole house fan
- Gas fireplace
- Privacy fence
Tags
Property features AI
Finance
- Other: Gravel road access; Zoned residential
Exterior
- Security: Closed-circuit cameras
- Utilities: Public water; Public sewer
- Home design: Single-family residence; One story
- Construction: Vinyl siding; Rubber and shingle roof
- Exterior features: Deck; Enclosed porch; Patio; Fenced yard; Shed(s) and outbuilding
Interior
- Kitchen: Range; Microwave; Dishwasher; Refrigerator; Gas water heater
- Bathrooms: 1 full bathroom; 2 half bathrooms
- Heating & cooling: Forced air heating (natural gas and electric); Central air; Attic fan; Whole house fan
- Interior features: Kitchen island; Two fireplaces (gas and wood burning)
- Laundry & utility: Washer; Dryer; Laundry on main level; Crawl space basement
Neighborhood map
What this means for you Summary
Snapshot
- This is a 4-bed/2.0-bath single-family listed at $160k.
Deal economics
- At list price, monthly cash flow is $76 ($917/yr) — positive.
- The deal already cash-flows at list — no discount required.
- To meet the 1% rule (rent ≥ 1% of price), the offer needs to be $132k (17.4% below list).
- Recommended offer: $132k (17.4% below list) — sets the bar for 1% rule.
Location & tenants
- Location reads 71/100 on livability (#342 in IL) — a middle-class / working-renter tenant base. Strengths: cost of living A+, housing A+, health & safety A+; Watch: employment D, crime F, amenities F.
- Paris CUSD 4 (town): math 32% / reading 38% proficiency, ranked #180 of 620 in IL (top 29%) — families likely to look elsewhere, expect single-tenant / working-renter base with shorter leases.
- Zoned schools: Crestwood Elem School (math 27% / reading 32%, grade F, #658 of 2,056 statewide, top 35%, 309 students, 0% FRL); Crestwood Jr High School (math 37% / reading 47%, grade D-, #116 of 665 statewide, top 19%, 128 students, 0% FRL); Paris Cooperative High School 4 (math 24% / reading 24%, grade F, #256 of 693 statewide, top 44%, 190 students, 0% FRL) — zoned schools average 0% FRL vs 25% district-wide (25 pts lower); this property's tenant base skews higher-income than the district average.
- Market conditions: 83 active listings in the ZIP; 6 units permitted in Edgar County in 2024 (0 in 5+ unit buildings).
Forward outlook
- Local home prices are declining (-3.0%/yr); year-one equity from $1k of loan paydown is wiped out by about $5k of value loss. Plan a longer hold.
- Edgar County population projected at -30% by 2050 — secular population decline; favor cash flow + early exit over multi-decade hold.
Negotiation context
- It's been on market 20 days — a 2% lower offer ($158k) is reasonable based on typical stale-listing flexibility.
- Current owner paid $38k; list at $160k implies a 326% gain — meaningful room to come down on a strong offer.
Questions for the listing agent
- Built in 1971 — when were the roof, HVAC, electrical panel, plumbing, and water heater last replaced?
- Is there a deadline driving the sale (1031 exchange, divorce, estate, relocation)? That informs how much negotiation room exists.
- Crime grade is F in this area — have there been break-ins, vandalism, or insurance claims at this property in the last 3 years? What carrier currently insures it and at what premium?
- What's the average days-on-market for RENTAL listings here right now (not sales)? A rising rental-DOM trend means longer vacancies and softer asking-rent achievability than the comps imply.
- What's the recent tenant-quality profile in this submarket — average credit score on applications, eviction rate, late-payment / NSF rate, and stable-employment percentage? A property-management company in the area should have these aggregated.
- How much new for-sale + rental construction is in the pipeline within 1–3 miles? Heavy new supply typically softens prices + rents 12–24 months out; constrained supply supports both.
Investment metrics
- 1% rule
- 0.83% ✗
- Cap rate
- 6.87%
- Cash-on-cash
- 2.05%
- DSCR
- 1.09
- GRM
- 10.1
CMA / ARV
- ARV (on-the-fly)
- $189,880
- Comps found
- 6
Show comp detail 6 sales within ~0.75 mi
| Address | Dist | Beds/Ba | Sqft | Sold | Price | $/sf | Match |
|---|---|---|---|---|---|---|---|
| 803 E Blackburn St | 0.13mi | 4/2.0 | 1,942 (+3%) | 16mo | $197,000 | $101 | 75 |
| 722 E Blackburn St | 0.08mi | 3/1.5 (-1) | 1,764 (-6%) | 7mo | $145,000 | $82 | 74 |
| 628 E Wood St | 0.70mi | 3/1.5 (-1) | 1,824 (-3%) | 8mo | $190,000 | $104 | 49 |
| 112 S Eads Ave | 0.71mi | 3/2.0 (-1) | 1,648 (-12%) | 1mo | $212,000 | $129 | 41 |
| 629 E Union St | 0.51mi | 3/1.5 (-1) | 1,680 (-11%) | 20mo | $167,000 | $99 | 35 |
| 115 Allenwood Dr | 0.68mi | 3/2.5 (-1) | 2,156 (+15%) | 6mo | $202,000 | $94 | 32 |
Match score weights: distance 35% · size 25% · config 20% · recency 20%. Top-matched comps best support the ARV.
Projected returns pro-forma
-3.0% appreciation · 3.0% rent growth · sell at horizon
- IRR
- -13.1%
- Equity multiple
- 0.53×
- Total profit
- $-21,109
- Equity at exit
- $23,842
- IRR
- -4.2%
- Equity multiple
- 0.72×
- Total profit
- $-12,380
- Equity at exit
- $13,825
Cash invested: $44,772 (down + closing). Projections, not guarantees.
Landlord ↔ Tenant lean methodology
- Overall (STATE)
- 43 Moderately Tenant-Leaning
- State Illinois
- 43 Moderately Tenant-Leaning · D+7
- County
- — inherits STATE
- City
- — inherits STATE
ZIP-level market 61944
- Active inventory
- 83
- Price-to-rent
- 10.1×
Monthly cashflow live
- Estimated rent
- $1,320 medium interval (Pro) →
- Mortgage (P&I)
- −$839
- Tax from tax record
- −$61 /mo · $735/yr
- Insurance
- −$67
- HOA
- −$0
- Vacancy / Maint / Mgmt
- −$277
- Net cashflow
- $76
Break-even live
Sensitivity live
| Price | -10% $167 | -5% $122 | +0% $76 | +5% $31 | +10% $-14 |
|---|---|---|---|---|---|
| Rent | -10% $-28 | -5% $24 | +0% $76 | +5% $129 | +10% $181 |
| Rate | -1.0pp $157 | -0.5pp $117 | base $76 | +0.5pp $35 | +1.0pp $-7 |
UW: 25.0% down · 7.5% · 30yr · 1.5% tax · 5.0% vac · 8.0% maint · 8.0% mgmt
Financing live
Cash to close
- Down payment
- $39,975
- Closing costs
- $4,797
- Reserves months
- —
- Total cash needed
- —
Loan-product check · same deal, 3 products live
Conventional
25% down · 7.5% · 30yr
- Down + closing
- —
- Monthly P&I
- —
- Monthly cashflow
- —
- DSCR
- —
- Eligible?
- —
Personal DTI + credit; lowest rate.
DSCR
20% down · 8.5% · 30yr
- Down + closing
- —
- Monthly P&I
- —
- Monthly cashflow
- —
- DSCR
- —
- Eligible?
- —
No personal income docs; deal must DSCR.
Hard money
10% down · 12.0% · 12mo
- Down + closing
- —
- Monthly P&I
- —
- Monthly cashflow
- —
- DSCR
- —
- Eligible?
- —
Short-term bridge; refi at stabilization.
Listing history 14 events
-
2026-06-21days on market $159,900 Active 20 DOM
-
2026-06-21days on market $159,900 Active 19 DOM
-
2026-06-18days on market $159,900 Active 17 DOM
-
2026-06-17days on market $159,900 Active 16 DOM
-
2026-06-16days on market $159,900 Active 15 DOM
-
2026-06-15days on market $159,900 Active 14 DOM
-
2026-06-13days on market $159,900 Active 12 DOM
-
2026-06-12days on market $159,900 Active 11 DOM
-
2026-06-09days on market $159,900 Active 8 DOM
-
2026-06-08days on market $159,900 Active 7 DOM
-
2026-06-07days on market $159,900 Active 6 DOM
-
2026-06-04days on market $159,900 Active 2 DOM
-
2026-06-02remarks 699-char remark
-
2026-06-02$159,900 Active 1 DOM
ⓘ Source: listings_history table (triggers on properties + properties_extension) + one-shot
backfill from property_details.listing_events for pre-trigger history.
Tax reassessment forecast IL · Partial reset (capped growth)
- Current annual tax
- $735 · $61/mo
- Projected year-2 tax
- $2,182 · $182/mo
- Expected delta
- +$1,447/yr (+$121/mo · 196.9%)
ⓘ Screening estimate from a state-policy table — verify with the county assessor before closing.
Climate risk First Street
- Flood 1/10 Low FEMA zone X (unshaded) · 0% chance over 30 yrs
- Wildfire 1/10 Low
- Heat 4/10 Moderate 7 d/yr ≥105°F today · 19 d/yr by 30 yrs out
- Wind 2/10 Low 100% chance of damaging wind over 30 yrs
- Air quality 4/10 Moderate 3 unhealthy d/yr today · 5 by 30 yrs out
Nearby sold comps map
Loading sold comps map…
Walkable amenities ~0.75 mi
Loading nearby amenities…
Taxation est. · year 1
- Rental income
- $15,840
- − Mortgage interest
- −$8,957
- − Property taxes
- −$735
- − Insurance
- −$800
- − Repairs & maintenance
- −$1,267
- − Management
- −$1,267
- − Depreciation
- −$4,652
- Taxable loss
- −$1,837
- Est. tax savings @ 24.0%
- +$441
- After-tax cash flow
- $1,358/yr
For passive investors: Depreciation is non-cash, so a rental often shows a tax loss while cash-flowing — sheltering income. Rental losses are passive: they offset passive income freely, and up to $25,000/yr can offset ordinary (W-2) income if you actively participate and your MAGI is under $100k (phasing out to $0 by $150k); unused losses carry forward. On sale, claimed depreciation is recaptured at up to 25%, and gains may owe capital-gains tax (a 1031 exchange can defer both). Figures are a year-1 estimate at your 24.0% rate — not tax advice; consult a CPA.
Schools (NCES district)
- District
- Paris CUSD 4
- NCES district ID
- 1730780
- Math proficiency
- 32% ▬ 0.00%
- Reading proficiency
- 38% ▼ -12.00%
- Median HH income
- $58,813
- Composite
- 31.17/100
- National rank
- #6051
- State rank
- #180 of 620 in IL
Livability — Paris
- Score
- 71/100
- State rank
- #342
- US rank
- #6933
Category grades
Schools grade is shown separately in the Schools card above.
Census & demographics
- Census place
- Paris, IL
- City population
- 11,426
- Population (ZIP)
- 11,426
Population outlook (Edgar County) Hauer SSP2
- Today (2025)
- 15,960 people
- By 2030
- 14,978 · -6.2%
- By 2040
- 12,990 · -18.6%
- By 2050
- 11,087 · -30.5%
- By 2075
- 7,338 · -54.0%
- By 2100
- 4,526 · -71.6%
Race, ethnicity, and origin ACS 2023
- Neighborhood character
- Predominantly White (96%)
- Race & ethnicity
- White 96% Two or more races 3% Hispanic / Latino 1%
- Common ancestry
- Slovak 2% Serbian 2% Italian 1%
- Foreign-born
- 1%
- Languages at home
- 98% English-only · Spanish 1% Other Indo-European 1%
Political lean MEDSL · Edgar
- 2024 margin
- Solid R (+52.4) · D 23.0% · R 75.3% · Other 1.7%
- 2008→2024 swing
- -44.4pp toward R · 2008: -7.9pp · 2024: -52.4pp
- All cycles
- 2024: R+52.4 2020: R+52.5 2016: R+49.5 2012: R+32.8 2008: R+7.9
Not yet ingested
- Civics
- —
Market trends
- HPI YoY
- ▼ -66.48%
- Current HPI
- 108.1718
- Rent YoY
- —
- Metro
- —
- State GDP YoY
- ▲ 1.59%
- F500 in state
- 60
Industry mix (Fortune 500 HQ in IL)
| Industry | F500 HQs | Revenue |
|---|---|---|
| Insurance | 4 | $201B |
|
||
| Consumer Goods | 4 | $87B |
|
||
| Industrial Machinery | 3 | $64B |
|
||
| Healthcare | 2 | $55B |
|
||
| Retail / Pharmacy | 1 | $148B |
|
||
| Agriculture / Food | 1 | $86B |
|
||
Price history
+326.4% since first listed2 events — show timeline
- 2026-06-01 Listed $159,900 CIBR
- 2001-08-04 Sold (Public Records) $37,500 Public Records
Property tax history
-5.5%/yrLatest (2024): $735 · -0.3% YoY. Source: county tax records.
Cash-flow waterfall
monthlySold comps — $/sqft
last 12 mo · ≤1 miLoading sold comps…