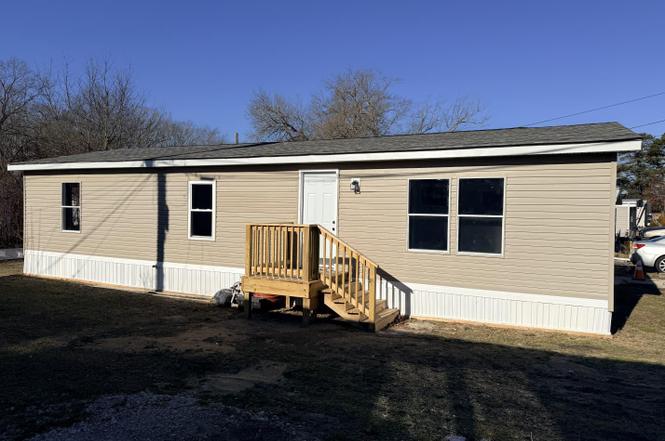
260 Marshal Mill Rd #117 · Malaga, NJ
Flood risk No data
- FEMA flood zone
- —
- Chance of flooding over 30 yrs
- —
- Est. flood insurance / yr
- —
Fire risk No data
- Est. fire insurance / yr
- —
Heat risk No data
- Hot days now (above threshold)
- —
- Hot days in 30 yrs
- —
Wind risk No data
- Chance of severe wind over 30 yrs
- —
Air-quality risk No data
- Unhealthy air days now
- —
- Unhealthy air days in 30 yrs
- —
Risk factors via First Street. Map © Google.
Why this score? — see what drove the D+ grade
The composite is a weighted blend of 9 inputs, each scored 0–100. Each bar is that input's sub-score; the figure is the points it added to the 100-point composite (weight × sub-score).
- Cash flow +18.3/30.0
- Appreciation +6.7/10.0
- DSCR +5.7/10.0
- 1% rule +4.9/10.0
- Schools +2.7/10.0
- Rent growth +2.5/5.0
- Livability +2.5/5.0
- Condition / age +2.5/5.0
- ARV discount +0.0/15.0
$128,000
🖨 Deal sheet (PDF) 📄 Offer letter ✓ Due diligence
Listing remarks
Beautifully Renovated 2 Bed, 2 Bath Double-Wide Mobile Home Conveniently located near major roadways, shopping, and restaurants, this fully renovated double‑wide offers comfort, style, and easy living. Fresh paint throughout, new vinyl plank flooring in the main living areas, and cozy carpeted bedrooms create a warm, modern feel. Enjoy a spacious open‑concept layout with a bright living area, generously sized bedrooms, and updated bathrooms. The kitchen has been refreshed as well, offering a clean and functional space for everyday cooking. Move‑in ready and perfectly situated for convenience, this home is a fantastic opportunity. seller offering 1st month lot rent covered.
Key facts
- Functional kitchen
- Bright living area
- Updated bathrooms
Tags
Property features AI
Finance
- HOA & community: Land lease of $895 per month; Land lease has 99 years remaining
Exterior
- Parking: Driveway parking
- Utilities: Public water; Public sewer
- Home design: Manufactured property; Double wide mobile home; Above-grade additional structure
- Construction: Modular/Manufactured construction; Year built (estimated)
- Exterior features: Driveway
Interior
- Bedrooms: 2 bedrooms on the main level
- Bathrooms: 2 full bathrooms (2 full on main level)
- Heating & cooling: 90% forced air heating; Propane (owned) fuel; Electric hot water
- Interior features: Estimated living area; Two or more access exits
Neighborhood map
What this means for you Summary
Snapshot
- This is a 2-bed/2.0-bath single-family listed at $128k.
Deal economics
- At list price, monthly cash flow is $117 ($1k/yr) — positive.
- The deal already cash-flows at list — no discount required.
- To meet the 1% rule (rent ≥ 1% of price), the offer needs to be $127k (0.9% below list).
- Recommended offer: $113k (12.0% below list) — sets the bar for market timing.
Location & tenants
- Location reads: area grade D — affects rentability + tenant quality, not the cash-flow math above.
- Township Of Franklin School District (rural): math 16% / reading 41% proficiency, ranked #336 of 472 in NJ (top 71%) — low school quality limits family demand, transient renter base, plan for 1-2y turnover.
- Zoned schools: Mary F. Janvier School (555 students, 20% FRL); Delsea Regional Middle School (math 19% / reading 51%, grade F, #246 of 431 statewide, top 59%, 518 students, 19% FRL); Delsea Regional High School (math 32% / reading 53%, grade F, #166 of 399 statewide, top 42%, 1,074 students, 20% FRL).
- Market conditions: 15 active listings in the ZIP; 1,047 units permitted in Gloucester County in 2024 (183 in 5+ unit buildings).
Forward outlook
- In year one you build about $5k of equity ($885 loan paydown + $4k appreciation (3.4% local appreciation)).
- Gloucester County population projected to shrink 5% by 2050 — rents likely to lag national; underwrite the cash flow, not the appreciation.
- At projected returns (3.4% appreciation + 3.0% rent growth), your $36k cash investment doubles in ~5 years — after that, you're playing with house money.
- By year 7, paydown + projected appreciation supports a ~$33k cash-out refi (75% LTV) — recoverable capital for the next deal without selling this one.
Negotiation context
- It's been on market 154 days — a 12% lower offer ($113k) is reasonable based on typical stale-listing flexibility.
Questions for the listing agent
- It's been on market 154 days. Have you received any prior offers? Is the seller open to a 12% concession, seller financing, or rate buy-down credit?
- Why hasn't it sold? Are there any deal-killer items the seller is aware of (foundation, flood, title, zoning, code violations)?
- Is there a deadline driving the sale (1031 exchange, divorce, estate, relocation)? That informs how much negotiation room exists.
- The area grade is low — what's the realistic commute time and amenity access for the typical tenant pool here? Any planned neighborhood developments (good or bad) we should know about?
- What's the average days-on-market for RENTAL listings here right now (not sales)? A rising rental-DOM trend means longer vacancies and softer asking-rent achievability than the comps imply.
- What's the recent tenant-quality profile in this submarket — average credit score on applications, eviction rate, late-payment / NSF rate, and stable-employment percentage? A property-management company in the area should have these aggregated.
- How much new for-sale + rental construction is in the pipeline within 1–3 miles? Heavy new supply typically softens prices + rents 12–24 months out; constrained supply supports both.
Investment metrics
- 1% rule
- 0.99% ✗
- Cap rate
- 7.39%
- Cash-on-cash
- 3.92%
- DSCR
- 1.17
- GRM
- 8.4
CMA / ARV
- ARV (on-the-fly)
- $108,900
- Comps found
- 5
Show comp detail 5 sales within ~0.75 mi
| Address | Dist | Beds/Ba | Sqft | Sold | Price | $/sf | Match |
|---|---|---|---|---|---|---|---|
| 260 Marshall Mill Rd #142 | 0.00mi | 2/2.0 | 1,000 (-9%) | 2mo | $69,000 | $69 | 84 |
| 260 Marshall Mill Rd Unit 160 | 0.08mi | 3/2.0 (+1) | 1,056 (-4%) | 15mo | $79,900 | $76 | 72 |
| 430 Dutch Mill Rd | 0.34mi | 2/1.0 | 1,140 (+4%) | 22mo | $112,500 | $99 | 56 |
| 1985 West Blvd | 0.44mi | 3/2.0 (+1) | 1,168 (+6%) | 10mo | $330,000 | $283 | 56 |
| 84 Roosevelt Ave | 0.74mi | 3/2.0 (+1) | 1,144 (+4%) | 20mo | $309,575 | $271 | 37 |
Match score weights: distance 35% · size 25% · config 20% · recency 20%. Top-matched comps best support the ARV.
Projected returns pro-forma
3.43% appreciation · 3.0% rent growth · sell at horizon
- IRR
- 12.3%
- Equity multiple
- 1.72×
- Total profit
- $25,827
- Equity at exit
- $60,665
- IRR
- 14.1%
- Equity multiple
- 3.18×
- Total profit
- $77,967
- Equity at exit
- $95,987
Cash invested: $35,840 (down + closing). Projections, not guarantees.
Landlord ↔ Tenant lean methodology
- Overall (STATE)
- 21 Tenant-Leaning
- State New Jersey
- 21 Tenant-Leaning · D+6
- County
- — inherits STATE
- City
- — inherits STATE
ZIP-level market 08328
- Home prices YoY
- 1.1%
- Active inventory
- 15
- Price-to-rent
- 8.4×
Monthly cashflow live
- Estimated rent
- $1,268 medium interval (Pro) →
- Mortgage (P&I)
- −$671
- Tax est. 1.5%
- −$160 /mo · $1,920/yr
- Insurance
- −$53
- HOA
- −$0
- Vacancy / Maint / Mgmt
- −$266
- Net cashflow
- $117
Break-even live
Sensitivity live
| Price | -10% $206 | -5% $161 | +0% $117 | +5% $73 | +10% $29 |
|---|---|---|---|---|---|
| Rent | -10% $17 | -5% $67 | +0% $117 | +5% $167 | +10% $217 |
| Rate | -1.0pp $182 | -0.5pp $150 | base $117 | +0.5pp $84 | +1.0pp $50 |
UW: 25.0% down · 7.5% · 30yr · 1.5% tax · 5.0% vac · 8.0% maint · 8.0% mgmt
Financing live
Cash to close
- Down payment
- $32,000
- Closing costs
- $3,840
- Reserves months
- —
- Total cash needed
- —
Loan-product check · same deal, 3 products live
Conventional
25% down · 7.5% · 30yr
- Down + closing
- —
- Monthly P&I
- —
- Monthly cashflow
- —
- DSCR
- —
- Eligible?
- —
Personal DTI + credit; lowest rate.
DSCR
20% down · 8.5% · 30yr
- Down + closing
- —
- Monthly P&I
- —
- Monthly cashflow
- —
- DSCR
- —
- Eligible?
- —
No personal income docs; deal must DSCR.
Hard money
10% down · 12.0% · 12mo
- Down + closing
- —
- Monthly P&I
- —
- Monthly cashflow
- —
- DSCR
- —
- Eligible?
- —
Short-term bridge; refi at stabilization.
Listing history 19 events
-
2026-06-21days on market $128,000 Active 154 DOM
-
2026-06-19days on market $128,000 Active 152 DOM
-
2026-06-18days on market $128,000 Active 151 DOM
-
2026-06-17days on market $128,000 Active 150 DOM
-
2026-06-16days on market $128,000 Active 149 DOM
-
2026-06-15days on market $128,000 Active 148 DOM
-
2026-06-13days on market $128,000 Active 146 DOM
-
2026-06-13days on market $128,000 Active 145 DOM
-
2026-06-10days on market $128,000 Active 143 DOM
-
2026-06-09days on market $128,000 Active 142 DOM
-
2026-06-08days on market $128,000 Active 141 DOM
-
2026-06-07days on market $128,000 Active 140 DOM
-
2026-06-04days on market $128,000 Active 137 DOM
-
2026-06-03days on market $128,000 Active 136 DOM
-
2026-06-02days on market $128,000 Active 135 DOM
-
2026-06-01days on market $128,000 Active 134 DOM
-
2026-05-31days on market $128,000 Active 133 DOM
-
2026-03-08price $128,000
-
2026-01-18$129,000 Active
ⓘ Source: listings_history table (triggers on properties + properties_extension) + one-shot
backfill from property_details.listing_events for pre-trigger history.
Nearby sold comps map
Loading sold comps map…
Walkable amenities ~0.75 mi
Loading nearby amenities…
Taxation est. · year 1
- Rental income
- $15,217
- − Mortgage interest
- −$7,170
- − Property taxes
- −$1,920
- − Insurance
- −$640
- − Repairs & maintenance
- −$1,217
- − Management
- −$1,217
- − Depreciation
- −$3,724
- Taxable loss
- −$672
- Est. tax savings @ 24.0%
- +$161
- After-tax cash flow
- $1,567/yr
For passive investors: Depreciation is non-cash, so a rental often shows a tax loss while cash-flowing — sheltering income. Rental losses are passive: they offset passive income freely, and up to $25,000/yr can offset ordinary (W-2) income if you actively participate and your MAGI is under $100k (phasing out to $0 by $150k); unused losses carry forward. On sale, claimed depreciation is recaptured at up to 25%, and gains may owe capital-gains tax (a 1031 exchange can defer both). Figures are a year-1 estimate at your 24.0% rate — not tax advice; consult a CPA.
Schools (NCES district)
- District
- Township Of Franklin School District
- NCES district ID
- 3405430
- Math proficiency
- 16% ▼ -25.00%
- Reading proficiency
- 41% ▼ -3.00%
- Median HH income
- $76,759
- Composite
- 27.42/100
- National rank
- #6968
- State rank
- #336 of 472 in NJ
Livability — Malaga
No livability data for this city. (Only ~50 U.S. cities are tracked.)
Census & demographics
- Census place
- Malaga, NJ
- City population
- 1,554
- Population (ZIP)
- 1,554
Population outlook (Gloucester County) Hauer SSP2
- Today (2025)
- 298,895 people
- By 2030
- 299,031 · +0.0%
- By 2040
- 294,020 · -1.6%
- By 2050
- 284,188 · -4.9%
- By 2075
- 260,720 · -12.8%
- By 2100
- 229,565 · -23.2%
Race, ethnicity, and origin ACS 2023
- Neighborhood character
- Predominantly White (94%)
- Race & ethnicity
- White 94% Black 6%
- Common ancestry
- Romanian 3% Iranian 2% German 2%
Political lean MEDSL · Gloucester
- 2024 margin
- Toss-up / Even · D 47.8% · R 50.6% · Other 1.6%
- 2008→2024 swing
- -15.0pp toward R · 2008: 12.2pp · 2024: -2.8pp
- All cycles
- 2024: R+2.8 2020: D+1.9 2016: R+0.4 2012: D+10.5 2008: D+12.2
Not yet ingested
- Civics
- —
Market trends
- HPI YoY
- ▲ 3.43%
- Current HPI
- 304.8964
- Rent YoY
- —
- Metro
- —
- State GDP YoY
- ▲ 2.05%
- F500 in state
- 34
Industry mix (Fortune 500 HQ in NJ)
| Industry | F500 HQs | Revenue |
|---|---|---|
| Consumer Goods | 3 | $31B |
|
||
| Pharmaceuticals | 2 | $153B |
|
||
| Technology | 2 | $21B |
|
||
| Insurance | 2 | $20B |
|
||
| Healthcare | 2 | $19B |
|
||
| Financial Services | 1 | $70B |
|
||
Price history
-0.8% since first listed2 events — show timeline
- 2026-03-08 Price Changed $128,000 BRIGHT MLS
- 2026-01-18 Listed $129,000 BRIGHT MLS
Cash-flow waterfall
monthlySold comps — $/sqft
last 12 mo · ≤1 miLoading sold comps…