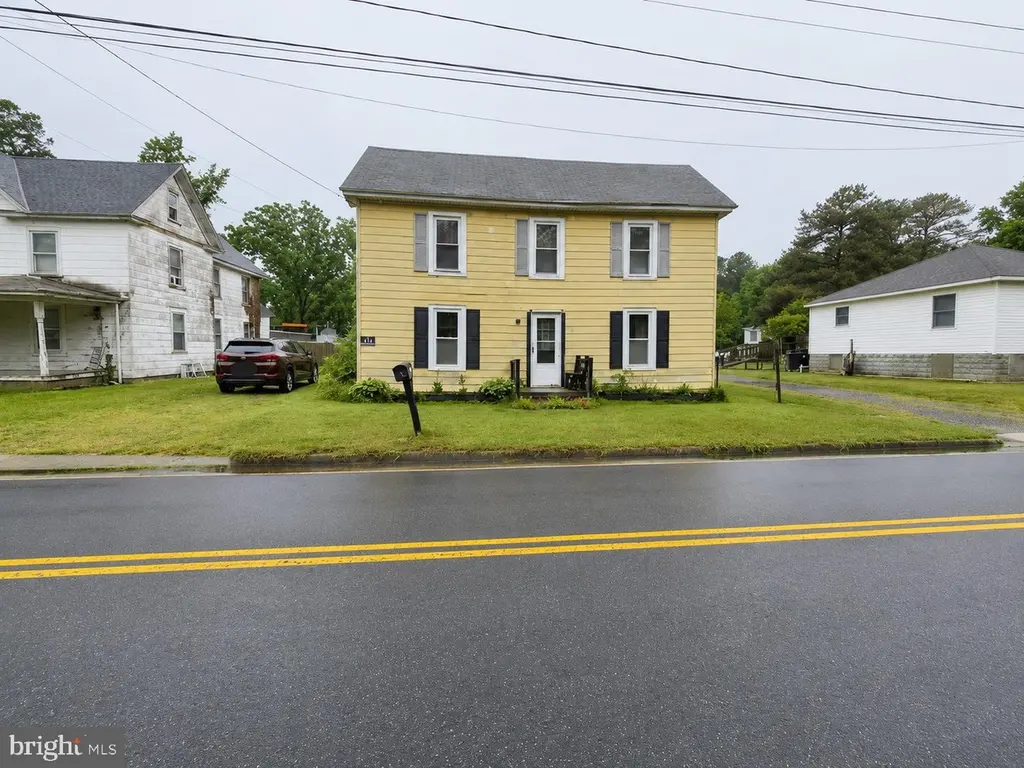
15260 Bayside Dr · Bloxom, VA
Flood risk 1/10 · Minimal
- FEMA flood zone
- X (unshaded)
- Chance of flooding over 30 yrs
- 0.0%
- Est. flood insurance / yr
- $507 – $1,088
Fire risk 3/10 · Minor
- Est. fire insurance / yr
- $666 – $1,236
Heat risk 9/10 · Severe
- Hot days now (above 102°F)
- 7 days/yr
- Hot days in 30 yrs
- 18 days/yr
Wind risk 8/10 · Major
- Chance of severe wind over 30 yrs
- 80.0%
Air-quality risk 2/10 · Minimal
- Unhealthy air days now
- 0 days/yr
- Unhealthy air days in 30 yrs
- 1 days/yr
Risk factors via First Street. Map © Google.
Why this score? — see what drove the B+ grade
The composite is a weighted blend of 9 inputs, each scored 0–100. Each bar is that input's sub-score; the figure is the points it added to the 100-point composite (weight × sub-score).
- Cash flow +30.0/30.0
- 1% rule +10.0/10.0
- DSCR +10.0/10.0
- Appreciation +8.4/10.0
- ARV discount +7.5/15.0
- Schools +4.3/10.0
- Livability +3.0/5.0
- Rent growth +2.5/5.0
- Condition / age +2.5/5.0
$63,000
🖨 Deal sheet 📄 Offer letter ✓ Due diligence
Key facts
- 8,787 sq ft lot
- Built 1900
- Listed 10 days
Property features AI
Finance
- Other: Fee simple ownership; Pets allowed with no restrictions; Assessed above-grade finished area: 1,332 (per assessor)
Exterior
- Utilities: Public water; Public sewer
- Home design: Detached structure
- Construction: Frame construction; Crawl space foundation; Shingle roof
- Exterior features: Not in a federal flood zone; Tidal water not present; Above-grade and below-grade structures noted
Interior
- Bedrooms: 3 bedrooms on the main level
- Bathrooms: 1 full bathroom on the main level
- Heating & cooling: Window air conditioning units; Electric cooling
- Interior features: No basement; Living area per assessor
Neighborhood map
What this means for you Summary
Snapshot
- This is a 2-bed/1.0-bath single-family listed at $63k.
Deal economics
- At list price, monthly cash flow is $513 ($6k/yr) — positive.
- The deal already cash-flows at list — no discount required.
- Meets the 1% rule at list price ($1k rent vs $63k).
Location & tenants
- Location reads 59/100 on livability (#473 in VA) — a working-class tenant base; expect higher turnover. Strengths: cost of living A+, housing A+; Watch: employment C-, crime D+, schools F.
- Accomack County Public School District (rural): math 44% / reading 59% proficiency, ranked #99 of 131 in VA (top 76%) — acceptable for families but not a draw, mixed tenant base, ~2y average lease; 63% free/reduced lunch — lower-income household profile, screen leases tightly.
- Market conditions: 27 active listings in the ZIP; 181 units permitted in Accomack County in 2024 (0 in 5+ unit buildings).
Forward outlook
- In year one you build about $5k of equity ($436 loan paydown + $4k appreciation (6.8% local appreciation)).
- Accomack County population projected at -14% by 2050 — secular population decline; favor cash flow + early exit over multi-decade hold.
- At projected returns (6.8% appreciation + 3.0% rent growth), your $18k cash investment doubles in ~2 years — after that, you're playing with house money.
- By year 7, paydown + projected appreciation supports a ~$31k cash-out refi (75% LTV) — recoverable capital for the next deal without selling this one.
Negotiation context
- Only 10 days on market — expect competitive offers; lowballing is unlikely to land.
Risks & watch-outs
- Watch-outs: built in 1900 — expect roof / HVAC / electrical / plumbing capex.
- Climate carrying-cost: severe wind risk, 80% chance of damaging wind over 30y; extreme-heat days projected 7→18/yr by 2055 (HVAC capex compounding) — expect insurance premiums to compound above CPI over the hold.
Questions for the listing agent
- Built in 1900 — when were the roof, HVAC, electrical panel, plumbing, and water heater last replaced?
- Is there a deadline driving the sale (1031 exchange, divorce, estate, relocation)? That informs how much negotiation room exists.
- Schools are F-rated, which usually means shorter tenancies and higher turnover. Who's the typical renter profile here, and what's been the actual vacancy rate?
- Crime grade is D in this area — have there been break-ins, vandalism, or insurance claims at this property in the last 3 years? What carrier currently insures it and at what premium?
- What's the average days-on-market for RENTAL listings here right now (not sales)? A rising rental-DOM trend means longer vacancies and softer asking-rent achievability than the comps imply.
- What's the recent tenant-quality profile in this submarket — average credit score on applications, eviction rate, late-payment / NSF rate, and stable-employment percentage? A property-management company in the area should have these aggregated.
- How much new for-sale + rental construction is in the pipeline within 1–3 miles? Heavy new supply typically softens prices + rents 12–24 months out; constrained supply supports both.
Investment metrics
- 1% rule
- 1.79% ✓
- Cap rate
- 16.06%
- Cash-on-cash
- 34.87%
- DSCR
- 2.55
- GRM
- 4.6
CMA / ARV
- ARV (on-the-fly)
- $215,784
- Comps found
- 1
Show comp detail 1 sale within ~0.75 mi
| Address | Dist | Beds/Ba | Sqft | Sold | Price | $/sf | Match |
|---|---|---|---|---|---|---|---|
| 25539 Shoremain Dr | 0.21mi | 2/1.0 | 1,232 (-8%) | 11mo | $200,000 | $162 | 69 |
Match score weights: distance 35% · size 25% · config 20% · recency 20%. Top-matched comps best support the ARV.
Projected returns pro-forma
6.8% appreciation · 3.0% rent growth · sell at horizon
- IRR
- 46.3%
- Equity multiple
- 4.05×
- Total profit
- $53,839
- Equity at exit
- $42,820
- IRR
- 42.6%
- Equity multiple
- 8.49×
- Total profit
- $132,124
- Equity at exit
- $80,592
Cash invested: $17,640 (down + closing). Projections, not guarantees.
Landlord ↔ Tenant lean methodology
- Overall (STATE)
- 55 Moderately Landlord-Leaning
- State Virginia
- 55 Moderately Landlord-Leaning · D+2
- County
- — inherits STATE
- City
- — inherits STATE
ZIP-level market 23308
- Home prices YoY
- 4.8%
- Active inventory
- 27
- Price-to-rent
- 4.6×
Monthly cashflow live
- Estimated rent
- $1,131 medium interval (Pro) →
- Mortgage (P&I)
- −$330
- Tax from tax record
- −$24 /mo · $287/yr
- Insurance
- −$26
- HOA
- −$0
- Vacancy / Maint / Mgmt
- −$237
- Net cashflow
- $513
Break-even live
UW: 25.0% down · 7.5% · 30yr · 1.5% tax · 5.0% vac · 8.0% maint · 8.0% mgmt
Financing live
Cash to close
- Down payment
- $15,750
- Closing costs
- $1,890
- Reserves months
- —
- Total cash needed
- —
Loan-product check · same deal, 3 products live
Conventional
25% down · 7.5% · 30yr
- Down + closing
- —
- Monthly P&I
- —
- Monthly cashflow
- —
- DSCR
- —
- Eligible?
- —
Personal DTI + credit; lowest rate.
DSCR
20% down · 8.5% · 30yr
- Down + closing
- —
- Monthly P&I
- —
- Monthly cashflow
- —
- DSCR
- —
- Eligible?
- —
No personal income docs; deal must DSCR.
Hard money
10% down · 12.0% · 12mo
- Down + closing
- —
- Monthly P&I
- —
- Monthly cashflow
- —
- DSCR
- —
- Eligible?
- —
Short-term bridge; refi at stabilization.
Listing history 9 events
-
2026-06-09days on market $63,000 Active 10 DOM
-
2026-06-08days on market $63,000 Active 9 DOM
-
2026-06-08days on market $63,000 Active 8 DOM
-
2026-06-07days on market $63,000 Active 7 DOM
-
2026-06-03days on market $63,000 Active 4 DOM
-
2026-06-02days on market $63,000 Active 3 DOM
-
2026-06-02price $63,000 Active 2 DOM
-
2026-06-01days on market $70,000 Active 2 DOM
-
2026-05-31$70,000 Active 1 DOM
ⓘ Source: listings_history table (triggers on properties + properties_extension) + one-shot
backfill from property_details.listing_events for pre-trigger history.
Tax reassessment forecast VA · Resets to sale price
- Current annual tax
- $287 · $24/mo
- Projected year-2 tax
- $517 · $43/mo
- Expected delta
- +$229/yr (+$19/mo · 79.8%)
ⓘ Screening estimate from a state-policy table — verify with the county assessor before closing.
Climate risk First Street
- Flood 1/10 Low FEMA zone X (unshaded) · 0% chance over 30 yrs
- Wildfire 3/10 Moderate
- Heat 9/10 Extreme 7 d/yr ≥102°F today · 18 d/yr by 30 yrs out
- Wind 8/10 Severe 80% chance of damaging wind over 30 yrs
- Air quality 2/10 Low 0 unhealthy d/yr today · 1 by 30 yrs out
Nearby sold comps map
Loading sold comps map…
Walkable amenities ~0.75 mi
Loading nearby amenities…
Taxation est. · year 1
- Rental income
- $13,566
- − Mortgage interest
- −$3,529
- − Property taxes
- −$287
- − Insurance
- −$315
- − Repairs & maintenance
- −$1,085
- − Management
- −$1,085
- − Depreciation
- −$1,833
- Taxable income
- $5,432
- Est. tax owed @ 24.0%
- −$1,304
- After-tax cash flow
- $4,847/yr
For passive investors: Depreciation is non-cash, so a rental often shows a tax loss while cash-flowing — sheltering income. Rental losses are passive: they offset passive income freely, and up to $25,000/yr can offset ordinary (W-2) income if you actively participate and your MAGI is under $100k (phasing out to $0 by $150k); unused losses carry forward. On sale, claimed depreciation is recaptured at up to 25%, and gains may owe capital-gains tax (a 1031 exchange can defer both). Figures are a year-1 estimate at your 24.0% rate — not tax advice; consult a CPA.
Schools (NCES district)
- District
- Accomack County Public School District
- NCES district ID
- 5100060
- Math proficiency
- 44% ▼ -36.00%
- Reading proficiency
- 59% ▼ -10.00%
- Median HH income
- $40,348
- Composite
- 43.05/100
- National rank
- #3096
- State rank
- #99 of 131 in VA
Livability — Bloxom
- Score
- 59/100
- State rank
- #473
- US rank
- #20443
Category grades
Schools grade is shown separately in the Schools card above.
Census & demographics
- Census place
- Bloxom, VA
- Population (ZIP)
- 2,118
Population outlook (Accomack County) Hauer SSP2
- Today (2025)
- 32,072 people
- By 2030
- 31,425 · -2.0%
- By 2040
- 29,685 · -7.4%
- By 2050
- 27,748 · -13.5%
- By 2075
- 23,396 · -27.1%
- By 2100
- 18,774 · -41.5%
Race, ethnicity, and origin ACS 2023
- Neighborhood character
- Diverse neighborhood (Simpson 0.61)
- Race & ethnicity
- White 55% Black 29% Two or more races 14% Hispanic / Latino 8%
- Hispanic origin (detail)
- Mexican 7%
- Common ancestry
- Hispanic 13% Italian 2% Slovak 1%
- Foreign-born
- 18% · Canada, China
- Languages at home
- 76% English-only · French/Haitian/Cajun 14% Spanish 9%
Political lean MEDSL · Accomack
- 2024 margin
- R (+13.3) · D 43.0% · R 56.3%
- 2008→2024 swing
- -11.9pp toward R · 2008: -1.4pp · 2024: -13.3pp
- All cycles
- 2024: R+13.3 2020: R+9.4 2016: R+11.7 2012: R+3.5 2008: R+1.4
Not yet ingested
- Civics
- —
Market trends
- HPI YoY
- ▲ 6.80%
- Current HPI
- 149.3044
- Rent YoY
- —
- Metro
- —
- State GDP YoY
- ▲ 2.40%
- F500 in state
- 50
Industry mix (Fortune 500 HQ in VA)
| Industry | F500 HQs | Revenue |
|---|---|---|
| Aerospace / Defense | 4 | $236B |
|
||
| Technology / Defense | 3 | $32B |
|
||
| Financial Services | 2 | $176B |
|
||
| Utilities | 2 | $27B |
|
||
| Insurance | 2 | $25B |
|
||
| Technology | 2 | $15B |
|
||
Price history
1 event — show timeline
- 2026-05-30 Listed $70,000 BRIGHT MLS
Property tax history
-3.1%/yrLatest (2025): $287 · +10.3% YoY. Source: county tax records.
Cash-flow waterfall
monthlySold comps — $/sqft
last 12 mo · ≤1 miLoading sold comps…