3301 38th St SW · Lehigh Acres, FL
Flood risk 3/10 · Minor
- FEMA flood zone
- X (unshaded)
- Chance of flooding over 30 yrs
- 0.2%
- Est. flood insurance / yr
- $507 – $1,088
Fire risk 5/10 · Moderate
- Est. fire insurance / yr
- $947 – $1,759
Heat risk 10/10 · Severe
- Hot days now (above 107°F)
- 7 days/yr
- Hot days in 30 yrs
- 29 days/yr
Wind risk 10/10 · Severe
- Chance of severe wind over 30 yrs
- 99.0%
Air-quality risk 2/10 · Minimal
- Unhealthy air days now
- 1 days/yr
- Unhealthy air days in 30 yrs
- 1 days/yr
Risk factors via First Street. Map © Google.
Why this score? — see what drove the B- grade
The composite is a weighted blend of 9 inputs, each scored 0–100. Each bar is that input's sub-score; the figure is the points it added to the 100-point composite (weight × sub-score).
- Cash flow +19.6/30.0
- ARV discount +15.0/15.0
- Appreciation +10.0/10.0
- DSCR +6.2/10.0
- 1% rule +4.8/10.0
- Schools +4.1/10.0
- Livability +3.0/5.0
- Condition / age +2.5/5.0
- Rent growth +2.1/5.0
$210,000
🖨 Deal sheet 📄 Offer letter ✓ Due diligence
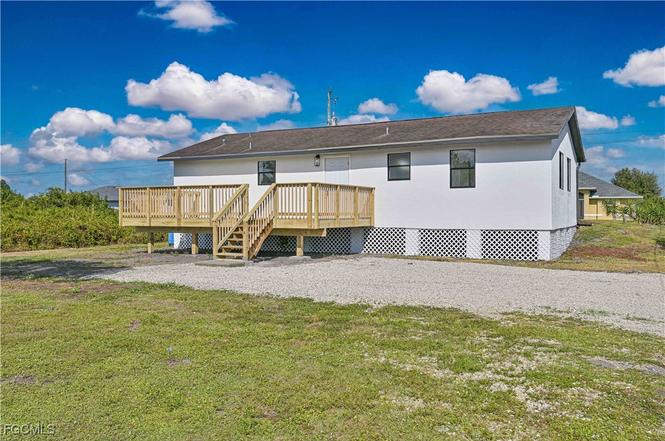
Listing remarks
Buyer has some personal issue. Welcome to this Stunning renovated home In Lehigh Acres. The property has been totally renovated from top to bottom like a new home. Step inside, you'll be greeted by stunning porcelain tile that graces the entire house with 5 inches base board gives it the modern feel. The Living room, open concept with kitchen and dining room offers great practical space for family and friends gathering and partying. This luxury kitchen carries brand new hardwood cabinets with soft closing features, beautiful quartz countertops, peninsula with waterfall and stainless-steel appliances, Home has brand-new LED lighting throughout the entire house. Property has new AC, Repipe, n
Key facts
- 0.25 acre lot
- 2 parking spots
- Built 1991
Neighborhood map
What this means for you Summary
Snapshot
- This is a 3-bed/2.0-bath single-family listed at $210k.
Deal economics
- At list price, monthly cash flow is $243 ($3k/yr) — positive.
- The deal already cash-flows at list — no discount required.
- To meet the 1% rule (rent ≥ 1% of price), the offer needs to be $206k (1.9% below list).
- Recommended offer: $191k (9.0% below list) — sets the bar for market timing.
- Cap rate 7.7% vs local median 4.7% in Lehigh Acres — top-decile yield for the area; either an underpriced asset or a hidden risk that comps aren't pricing in. Stress-test before assuming the spread holds.
Location & tenants
- Location reads 59/100 on livability (#826 in FL) — a working-class tenant base; expect higher turnover. Strengths: cost of living A+, housing A+; Watch: crime C-, employment D+, schools D-.
- Lee (suburban): math 47% / reading 50% proficiency, ranked #42 of 73 in FL (top 58%) — families likely to look elsewhere, expect single-tenant / working-renter base with shorter leases.
- Market conditions: Rents soft (-1.5%/yr); 786 active listings in the ZIP; 25 comparable units currently listed for rent nearby; rentals at typical pace (median 15d on market — plan ~3-4 weeks tenant-placement turnaround); 15,411 units permitted in Lee County in 2024 (4,686 in 5+ unit buildings).
- This rent runs 34% of the median local income ($73k/yr) — at the standard rent-burdened threshold; future hikes will face affordability resistance.
Forward outlook
- In year one you build about $22k of equity ($1k loan paydown + $21k appreciation (10.0% local appreciation)).
- Lee County population projected at +44% by 2050 — long-run rental-demand tailwind backs the buy-and-hold thesis.
- At projected returns (10.0% appreciation + 0.0% rent growth), your $59k cash investment doubles in ~3 years — after that, you're playing with house money.
- By year 2, paydown + projected appreciation supports a ~$36k cash-out refi (75% LTV) — recoverable capital for the next deal without selling this one.
Negotiation context
- It's been on market 101 days — a 9% lower offer ($191k) is reasonable based on typical stale-listing flexibility.
- 5 sale attempts since 9y ago; this cycle's ask has dropped $15k (7%) from the opening price — seller is motivated, your offer sets the floor, not the list.
- Current owner paid $105k; list at $210k implies a 100% gain — meaningful room to come down on a strong offer.
Risks & watch-outs
- Climate carrying-cost: severe wind risk, 99% chance of damaging wind over 30y; moderate wildfire risk; extreme-heat days projected 7→29/yr by 2055 (HVAC capex compounding) — expect insurance premiums to compound above CPI over the hold.
Questions for the listing agent
- It's been on market 101 days. Have you received any prior offers? Is the seller open to a 9% concession, seller financing, or rate buy-down credit?
- Why hasn't it sold? Are there any deal-killer items the seller is aware of (foundation, flood, title, zoning, code violations)?
- Is there a deadline driving the sale (1031 exchange, divorce, estate, relocation)? That informs how much negotiation room exists.
- Schools are D-rated, which usually means shorter tenancies and higher turnover. Who's the typical renter profile here, and what's been the actual vacancy rate?
- What's the average days-on-market for RENTAL listings here right now (not sales)? A rising rental-DOM trend means longer vacancies and softer asking-rent achievability than the comps imply.
- What's the recent tenant-quality profile in this submarket — average credit score on applications, eviction rate, late-payment / NSF rate, and stable-employment percentage? A property-management company in the area should have these aggregated.
- How much new for-sale + rental construction is in the pipeline within 1–3 miles? Heavy new supply typically softens prices + rents 12–24 months out; constrained supply supports both.
Investment metrics
- 1% rule
- 0.98% ✗
- Cap rate
- 7.68%
- Cash-on-cash
- 4.96%
- DSCR
- 1.22
- GRM
- 8.5
CMA / ARV
- ARV (on-the-fly)
- $294,912
- Comps found
- 2
Show comp detail 2 sales within ~0.75 mi
| Address | Dist | Beds/Ba | Sqft | Sold | Price | $/sf | Match |
|---|---|---|---|---|---|---|---|
| 3210 38th St SW | 0.09mi | 3/2.0 | 1,285 (+12%) | 14mo | $284,990 | $222 | 65 |
| 3010 35th St SW | 0.64mi | 3/2.0 | 1,170 (+2%) | 3mo | $300,000 | $256 | 65 |
Match score weights: distance 35% · size 25% · config 20% · recency 20%. Top-matched comps best support the ARV.
Projected returns pro-forma
10.0% appreciation · 0.0% rent growth · sell at horizon
- IRR
- 26.8%
- Equity multiple
- 3.11×
- Total profit
- $123,808
- Equity at exit
- $189,185
- IRR
- 22.7%
- Equity multiple
- 6.81×
- Total profit
- $341,586
- Equity at exit
- $407,984
Cash invested: $58,800 (down + closing). Projections, not guarantees.
Landlord ↔ Tenant lean methodology
- Overall (STATE)
- 87 Strongly Landlord-Friendly
- State Florida
- 87 Strongly Landlord-Friendly · R+3
- County
- — inherits STATE
- City
- — inherits STATE
ZIP-level market 33976
- Home prices YoY
- 6.8%
- Rents YoY
- -1.5%
- Active inventory
- 786
- Price-to-rent
- 8.5×
Monthly cashflow live
- Estimated rent
- $2,060 high interval (Pro) →
- Mortgage (P&I)
- −$1,101
- Tax from tax record
- −$196 /mo · $2,350/yr
- Insurance
- −$88
- HOA
- −$0
- Vacancy / Maint / Mgmt
- −$433
- Net cashflow
- $243
Break-even live
UW: 25.0% down · 7.5% · 30yr · 1.5% tax · 5.0% vac · 8.0% maint · 8.0% mgmt
Financing live
Cash to close
- Down payment
- $52,500
- Closing costs
- $6,300
- Reserves months
- —
- Total cash needed
- —
Loan-product check · same deal, 3 products live
Conventional
25% down · 7.5% · 30yr
- Down + closing
- —
- Monthly P&I
- —
- Monthly cashflow
- —
- DSCR
- —
- Eligible?
- —
Personal DTI + credit; lowest rate.
DSCR
20% down · 8.5% · 30yr
- Down + closing
- —
- Monthly P&I
- —
- Monthly cashflow
- —
- DSCR
- —
- Eligible?
- —
No personal income docs; deal must DSCR.
Hard money
10% down · 12.0% · 12mo
- Down + closing
- —
- Monthly P&I
- —
- Monthly cashflow
- —
- DSCR
- —
- Eligible?
- —
Short-term bridge; refi at stabilization.
Rent comps 25 comps
| Address | Beds | Baths | Sqft | Rent | $/sqft | DOM | Units | Dist |
|---|---|---|---|---|---|---|---|---|
| 3114 39th St SW Lehigh Acres, FL | 3.0 | 2.0 | 1493 | $2,100 | $1.41 | 3d | 1 | 0.29mi |
| 3114 39th St SW Lehigh Acres, FL | 3.0 | 2.0 | 1493 | $2,100 | $1.41 | 16d | 1 | 0.29mi |
| 3102 39th St SW Lehigh Acres, FL | 3.0 | 2.0 | 1097 | $1,630 | $1.49 | 21d | 1 | 0.38mi |
| 3012 40th St SW Lehigh Acres, FL | 3.0 | 2.0 | 1427 | $1,950 | $1.37 | 23d | 1 | 0.52mi |
| 3201 28th St Lehigh Acres, FL | 4.0 | 2.0 | 1389 | $2,000 | $1.44 | 3d | 1 | 0.65mi |
| 2916 42nd St SW Lehigh Acres, FL | 3.0 | 2.0 | 1399 | $1,930 | $1.38 | 2d | 1 | 0.67mi |
| 2916 42nd St SW Lehigh Acres, FL | 3.0 | 2.0 | 1399 | $1,960 | $1.40 | 3d | 1 | 0.67mi |
| 3001 37th St SW Lehigh Acres, FL | 3.0 | 2.5 | 1235 | $1,705 | $1.38 | 23d | 1 | 0.71mi |
| 4702 Loraine Ave S Lehigh Acres, FL | 3.0 | 2.0 | 1354 | $2,000 | $1.48 | 14d | 1 | 0.76mi |
| 3802 35th St SW Lehigh Acres, FL | 3.0 | 2.0 | 1269 | $1,640 | $1.29 | 23d | 1 | 0.78mi |
| 3203 24th St SW Lehigh Acres, FL | 3.0 | 2.0 | 1498 | $2,300 | $1.54 | 21d | 1 | 0.89mi |
| 3201 23rd St SW Lehigh Acres, FL | 3.0 | 2.0 | 1324 | $1,845 | $1.39 | 21d | 1 | 0.95mi |
| 2908 51st St SW Lehigh Acres, FL | 3.0 | 2.0 | 1401 | $1,796 | $1.28 | 3d | 1 | 1.06mi |
| 3209 21st St SW Lehigh Acres, FL | 3.0 | 2.0 | 1418 | $1,699 | $1.20 | 2d | 1 | 1.08mi |
| 3202 21st St SW Lehigh Acres, FL | 3.0 | 2.0 | 1100 | $1,920 | $1.75 | 2d | 1 | 1.12mi |
| 2819 51st St SW Lehigh Acres, FL | 4.0 | 2.0 | 1472 | $2,250 | $1.53 | 23d | 1 | 1.14mi |
| 2811 25th St SW Unit NA Lehigh Acres, FL | 3.0 | 2.0 | 1430 | $1,990 | $1.39 | 23d | 1 | 1.19mi |
| 4020 36th St SW Lehigh Acres, FL | 3.0 | 2.0 | 1354 | $2,050 | $1.51 | 23d | 1 | 1.23mi |
| 3600 19th St SW Lehigh Acres, FL | 3.0 | 2.0 | 1114 | $1,746 | $1.57 | 3d | 1 | 1.27mi |
| 2612 31st St Lehigh Acres, FL | 4.0 | 2.0 | 1389 | $1,799 | $1.30 | 16d | 1 | 1.27mi |
| 2612 31st St Lehigh Acres, FL | 4.0 | 2.0 | 1365 | $1,799 | $1.32 | 13d | 1 | 1.27mi |
| 4701 Connie Ave S Lehigh Acres, FL | 3.0 | 2.0 | 1314 | $1,900 | $1.45 | 14d | 1 | 1.43mi |
| 4001 22nd St SW Lehigh Acres, FL | 3.0 | 2.0 | 1055 | $1,950 | $1.85 | 2d | 1 | 1.44mi |
| 2513 48th St SW Lehigh Acres, FL | 3.0 | 2.0 | 1423 | $1,750 | $1.23 | 16d | 1 | 1.46mi |
| 2805 20th St SW Lehigh Acres, FL | 3.0 | 2.0 | 1151 | $1,699 | $1.48 | 2d | 1 | 1.49mi |
Listing history 17 events
-
2026-03-14status Pending
-
2026-02-07price $210,000
-
2026-01-18price $215,000
-
2026-01-10status Active
-
2026-01-05status Pending
-
2025-12-27price $220,000
-
2025-12-11status Active
-
2025-12-04status Pending
-
2025-11-21$225,000 Active
-
2017-09-25historical
-
2017-09-07price $70,000
-
2017-08-18price $78,000
-
2017-06-09status Active
-
2017-05-25status Pending With Contingencies
-
2017-03-10price $79,000
-
2017-02-01$82,500 Active
-
2004-10-18soldstatus $105,000
ⓘ Source: listings_history table (triggers on properties + properties_extension) + one-shot
backfill from property_details.listing_events for pre-trigger history.
Tax reassessment forecast FL · Resets to sale price
- Current annual tax
- $2,350 · $196/mo
- Projected year-2 tax
- $2,350 · $196/mo
- Expected delta
- $0/yr ($0/mo · 0.0%)
ⓘ Screening estimate from a state-policy table — verify with the county assessor before closing.
Climate risk First Street
- Flood 3/10 Moderate FEMA zone X (unshaded) · 20% chance over 30 yrs
- Wildfire 5/10 Major
- Heat 10/10 Extreme 7 d/yr ≥107°F today · 29 d/yr by 30 yrs out
- Wind 10/10 Extreme 99% chance of damaging wind over 30 yrs
- Air quality 2/10 Low 1 unhealthy d/yr today · 1 by 30 yrs out
Nearby sold comps map
Loading sold comps map…
Walkable amenities ~0.75 mi
Loading nearby amenities…
Taxation est. · year 1
- Rental income
- $24,725
- − Mortgage interest
- −$11,763
- − Property taxes
- −$2,350
- − Insurance
- −$1,050
- − Repairs & maintenance
- −$1,978
- − Management
- −$1,978
- − Depreciation
- −$6,109
- Taxable loss
- −$504
- Est. tax savings @ 24.0%
- +$121
- After-tax cash flow
- $3,038/yr
For passive investors: Depreciation is non-cash, so a rental often shows a tax loss while cash-flowing — sheltering income. Rental losses are passive: they offset passive income freely, and up to $25,000/yr can offset ordinary (W-2) income if you actively participate and your MAGI is under $100k (phasing out to $0 by $150k); unused losses carry forward. On sale, claimed depreciation is recaptured at up to 25%, and gains may owe capital-gains tax (a 1031 exchange can defer both). Figures are a year-1 estimate at your 24.0% rate — not tax advice; consult a CPA.
Schools (NCES district)
- District
- Lee
- NCES district ID
- 1201080
- Math proficiency
- 47% ▼ -11.00%
- Reading proficiency
- 50% ▼ -4.00%
- Median HH income
- $49,518
- Composite
- 41.49/100
- National rank
- #3458
- State rank
- #42 of 73 in FL
Livability — Lehigh Acres
- Score
- 59/100
- State rank
- #826
- US rank
- #20055
Category grades
Schools grade is shown separately in the Schools card above.
Census & demographics
- Census place
- Lehigh Acres, FL
- County
- Lee County · 788,662 people
- City population
- 130,638
- Metro
- Cape Coral-Fort Myers, FL
- Population (ZIP)
- 20,277
- Household income
- $72,679
- Rent vs Own
- Severe rent burden
- 574.0
Population outlook (Lee County) Hauer SSP2
- Today (2025)
- 871,946 people
- By 2030
- 955,468 · +9.6%
- By 2040
- 1,113,587 · +27.7%
- By 2050
- 1,256,891 · +44.1%
- By 2075
- 1,560,270 · +78.9%
- By 2100
- 1,726,848 · +98.0%
Race, ethnicity, and origin ACS 2023
- Neighborhood character
- Diverse neighborhood (Simpson 0.65)
- Race & ethnicity
- Hispanic / Latino 50% Two or more races 30% White 24% Black 20% Asian 3%
- Hispanic origin (detail)
- Mexican 8% Puerto Rican 8% Cuban 18% Dominican 4%
- Common ancestry
- Hispanic 8% Slovak 1% Lithuanian 1%
- Foreign-born
- 35% · Canada, Jamaica, Vietnam
- Languages at home
- 46% English-only · Spanish 43% French/Haitian/Cajun 8% Vietnamese 1%
Political lean MEDSL · Lee
- 2024 margin
- Strong R (+28.4) · D 35.5% · R 63.9%
- 2008→2024 swing
- -18.0pp toward R · 2008: -10.4pp · 2024: -28.4pp
- All cycles
- 2024: R+28.4 2020: R+19.2 2016: R+20.4 2012: R+16.6 2008: R+10.4
Not yet ingested
- Civics
- —
Market trends
- HPI YoY
- ▲ 21.77%
- Current HPI
- 340.4255
- Rent YoY
- ▼ -1.54%
- Metro
- Cape Coral-Fort Myers, FL
- State GDP YoY
- ▲ 3.28%
- F500 in state
- 36
Industry mix (Fortune 500 HQ in FL)
| Industry | F500 HQs | Revenue |
|---|---|---|
| Industrial Technology | 2 | $29B |
|
||
| Insurance | 2 | $17B |
|
||
| Retail | 1 | $60B |
|
||
| Technology Distribution | 1 | $58B |
|
||
| Homebuilding | 1 | $35B |
|
||
| Technology Manufacturing | 1 | $35B |
|
||
Price history
+100.0% since first listed17 events — show timeline
- 2026-03-14 Pending — FORTMLS
- 2026-02-07 Price Changed $210,000 FORTMLS
- 2026-01-18 Price Changed $215,000 FORTMLS
- 2026-01-10 Relisted — FORTMLS
- 2026-01-05 Pending — FORTMLS
- 2025-12-27 Price Changed $220,000 FORTMLS
- 2025-12-11 Relisted — FORTMLS
- 2025-12-04 Pending — FORTMLS
- 2025-11-21 Listed $225,000 FORTMLS
- 2017-09-25 Listing Removed — FORTMLS
- 2017-09-07 Price Changed $70,000 FORTMLS
- 2017-08-18 Price Changed $78,000 FORTMLS
- 2017-06-09 Relisted — FORTMLS
- 2017-05-25 Pending — FORTMLS
- 2017-03-10 Price Changed $79,000 FORTMLS
- 2017-02-01 Listed $82,500 FORTMLS
- 2004-10-18 Sold (Public Records) $105,000 Public Records
Property tax history
+8.0%/yrLatest (2025): $2,350 · -7.1% YoY. Source: county tax records.
Cash-flow waterfall
monthlySold comps — $/sqft
last 12 mo · ≤1 miLoading sold comps…