 Duplex
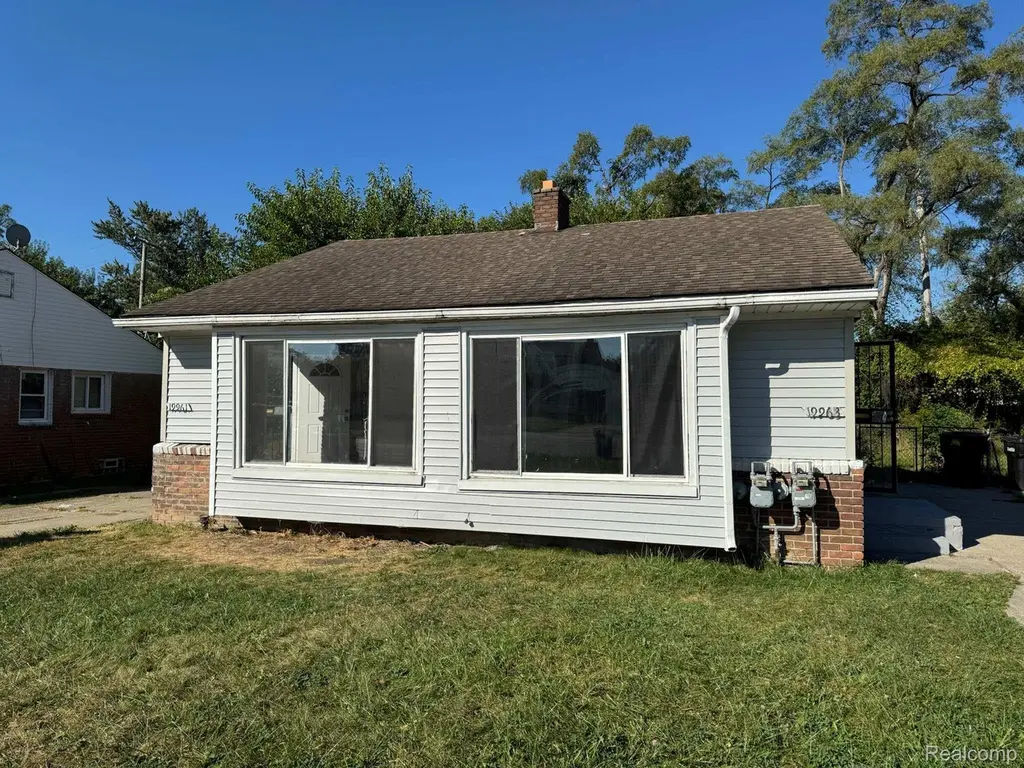
19961 Greenfield Rd · Detroit, MI
Flood risk 1/10 · Minimal
- FEMA flood zone
- X (unshaded)
- Chance of flooding over 30 yrs
- 0.0%
- Est. flood insurance / yr
- $473 – $860
Fire risk 1/10 · Minimal
- Est. fire insurance / yr
- $784 – $1,456
Heat risk 3/10 · Minor
- Hot days now (above 98°F)
- 7 days/yr
- Hot days in 30 yrs
- 15 days/yr
Wind risk 2/10 · Minimal
- Chance of severe wind over 30 yrs
- —
Air-quality risk 3/10 · Minor
- Unhealthy air days now
- 2 days/yr
- Unhealthy air days in 30 yrs
- 5 days/yr
Risk factors via First Street. Map © Google.
Why this score? — see what drove the B- grade
The composite is a weighted blend of 9 inputs, each scored 0–100. Each bar is that input's sub-score; the figure is the points it added to the 100-point composite (weight × sub-score).
- Cash flow +30.0/30.0
- 1% rule +10.0/10.0
- DSCR +10.0/10.0
- ARV discount +7.5/15.0
- Livability +3.7/5.0
- Rent growth +3.3/5.0
- Condition / age +2.5/5.0
- Schools +1.3/10.0
- Appreciation +0.0/10.0
$89,900
🖨 Deal sheet 📄 Offer letter ✓ Due diligence
Multi-family units
County records classify this as Multi-Family (2-4 Unit). Listing-text estimate: 2 units. confirmed
Listing remarks MLS
Fully renovated duplex, each side has 1 bedroom and 1 bath. The units have their own basements and separate water and electric meters. Anticipated rent per unit $900 per month. Duplex has addresses 19961 and 19963
Key facts
- Own basements
- 5,227 sq ft lot
- Built 1952
Tags
Property features AI
Finance
- Financial info: Property listed as residential income (multi-family)
Exterior
- Parking: Parking details not provided
- Utilities: Public water; Public sewer
- Home design: Multi-family residential property; Single-story (one level); Entry facing information not provided
- Construction: Aluminum siding and brick exterior; Block foundation; Built or configured to total 950 above-grade finished square feet
- Exterior features: Paved road access; Pets allowed — contact listing for details
Interior
- Kitchen: Kitchens in each unit
- Bedrooms: Two 1-bedroom units
- Bathrooms: Two full bathrooms (one in each unit)
- Heating & cooling: Forced air heating (natural gas); No cooling
- Interior features: Unfinished basement
- Laundry & utility: Has heating (forced air, natural gas)
Neighborhood map
What this means for you Summary
Snapshot
- This is a 2 × 2-bed/1.0-bath units multifamily listed at $90k.
Deal economics
- At list price, monthly cash flow is $1k ($14k/yr) — positive. Per door: $568/mo.
- The deal already cash-flows at list — no discount required.
- Meets the 1% rule at list price ($2k rent vs $90k).
- Recommended offer: $89k (1.5% below list) — sets the bar for market timing.
- Cap rate 21.5% vs local median 10.2% in Detroit — top-decile yield for the area; either an underpriced asset or a hidden risk that comps aren't pricing in. Stress-test before assuming the spread holds.
Location & tenants
- Location reads 73/100 on livability (#218 in MI) — a middle-class / working-renter tenant base. Strengths: amenities A+, commute A+, cost of living A+; Watch: schools F, crime F, employment F.
- Detroit Public Schools Community District (urban): math 10% / reading 24% proficiency, ranked #499 of 540 in MI (top 92%) — low school quality limits family demand, transient renter base, plan for 1-2y turnover; 90% free/reduced lunch — lower-income household profile, screen leases tightly.
- Market conditions: Rents rising (+3.2%/yr); 283 active listings in the ZIP; 17 comparable units currently listed for rent nearby; rentals at typical pace (median 17d on market — plan ~3-4 weeks tenant-placement turnaround); lower-income renter base — watch delinquency; 2,639 units permitted in Wayne County in 2024 (1,216 in 5+ unit buildings).
- At $2,301/mo this rent would consume 70% of the median local household income ($39k/yr) (locally 3064% of renters already pay >50% of income on rent) — very limited rent-growth headroom before tenants either downsize or default.
Forward outlook
- Local home prices are declining (-3.0%/yr); year-one equity from $622 of loan paydown is wiped out by about $3k of value loss. Plan a longer hold.
- Wayne County population projected at -17% by 2050 — secular population decline; favor cash flow + early exit over multi-decade hold.
- At projected returns (-3.0% appreciation + 3.2% rent growth), your $25k cash investment doubles in ~3 years — after that, you're playing with house money.
Negotiation context
- It's been on market 20 days — a 2% lower offer ($89k) is reasonable based on typical stale-listing flexibility.
- 13 sale attempts since 6y ago; this cycle's ask has dropped $10k (10%) from the opening price — seller is motivated, your offer sets the floor, not the list.
- Current owner paid $42k; list at $90k implies a 114% gain — meaningful room to come down on a strong offer.
Risks & watch-outs
- Watch-outs: built in 1952 — expect roof / HVAC / electrical / plumbing capex.
Questions for the listing agent
- Can we see the unit-by-unit rent roll, current vacancy, and any below-market leases? What's the average tenancy length?
- What capital expenditures (roof, boiler, parking lot, exteriors) have been made in the last 5 years, and what's planned in the next 2?
- Built in 1952 — when were the roof, HVAC, electrical panel, plumbing, and water heater last replaced?
- Is there a deadline driving the sale (1031 exchange, divorce, estate, relocation)? That informs how much negotiation room exists.
- Schools are F-rated, which usually means shorter tenancies and higher turnover. Who's the typical renter profile here, and what's been the actual vacancy rate?
- Crime grade is F in this area — have there been break-ins, vandalism, or insurance claims at this property in the last 3 years? What carrier currently insures it and at what premium?
- What's the average days-on-market for RENTAL listings here right now (not sales)? A rising rental-DOM trend means longer vacancies and softer asking-rent achievability than the comps imply.
- What's the recent tenant-quality profile in this submarket — average credit score on applications, eviction rate, late-payment / NSF rate, and stable-employment percentage? A property-management company in the area should have these aggregated.
- How much new apartment / multifamily construction is in the pipeline within 1–3 miles? Heavy new supply (>2% of stock underway) typically softens rents 12–24 months out; light construction supports rent growth.
Investment metrics
- 1% rule
- 2.56% ✓
- Cap rate
- 21.46%
- Cash-on-cash
- 54.18%
- DSCR
- 3.41
- GRM
- 3.3
CMA / ARV
No comps found within radius.
Projected returns pro-forma
-3.0% appreciation · 3.25% rent growth · sell at horizon
- IRR
- 52.7%
- Equity multiple
- 3.32×
- Total profit
- $58,470
- Equity at exit
- $13,404
- IRR
- 58.0%
- Equity multiple
- 6.83×
- Total profit
- $146,808
- Equity at exit
- $7,773
Cash invested: $25,172 (down + closing). Projections, not guarantees.
Landlord ↔ Tenant lean methodology
- Overall (STATE)
- 62 Landlord-Friendly
- State Michigan
- 62 Landlord-Friendly · EVEN
- County
- — inherits STATE
- City
- — inherits STATE
ZIP-level market 48235
- Rents YoY
- 3.2%
- Active inventory
- 283
- Price-to-rent
- 6.5×
Monthly cashflow live
- Estimated rent
- $2,301 medium interval (Pro) →
- Mortgage (P&I)
- −$471
- Tax from tax record
- −$172 /mo · $2,068/yr
- Insurance
- −$37
- HOA
- −$0
- Vacancy / Maint / Mgmt
- −$483
- Net cashflow
- $1,137
Break-even live
2-unit breakdown (identical units grouped — click to expand)
| Units | Beds | Baths | Est. rent |
|---|---|---|---|
| 2× units | 2 | 1 | $2,302 |
| #1 | 2 | 1 | $1,151 |
| #2 | 2 | 1 | $1,151 |
| Total (2 units) | $2,301 | ||
UW: 25.0% down · 7.5% · 30yr · 1.5% tax · 5.0% vac · 8.0% maint · 8.0% mgmt
Financing live
Cash to close
- Down payment
- $22,475
- Closing costs
- $2,697
- Reserves months
- —
- Total cash needed
- —
Loan-product check · same deal, 3 products live
Conventional
25% down · 7.5% · 30yr
- Down + closing
- —
- Monthly P&I
- —
- Monthly cashflow
- —
- DSCR
- —
- Eligible?
- —
Personal DTI + credit; lowest rate.
DSCR
20% down · 8.5% · 30yr
- Down + closing
- —
- Monthly P&I
- —
- Monthly cashflow
- —
- DSCR
- —
- Eligible?
- —
No personal income docs; deal must DSCR.
Hard money
10% down · 12.0% · 12mo
- Down + closing
- —
- Monthly P&I
- —
- Monthly cashflow
- —
- DSCR
- —
- Eligible?
- —
Short-term bridge; refi at stabilization.
Rent comps 17 comps
| Address | Beds | Baths | Sqft | Rent | $/sqft | DOM | Units | Dist |
|---|---|---|---|---|---|---|---|---|
| 19467 Rutherford St Detroit, MI | 3.0 | 1.0 | 1002 | $1,200 | $1.20 | 17d | 1 | 0.37mi |
| 19440 Rutherford St Detroit, MI | 3.0 | 1.0 | 1000 | $1,400 | $1.40 | 24d | 1 | 0.37mi |
| 20210 Biltmore St Detroit, MI | 3.0 | 1.0 | 1033 | $1,350 | $1.31 | 24d | 1 | 0.59mi |
| 20203 Gilchrist St Detroit, MI | 3.0 | 1.0 | 1031 | $1,250 | $1.21 | 5d | 1 | 0.68mi |
| 20314 Gilchrist St Detroit, MI | 3.0 | 1.0 | 1042 | $1,500 | $1.44 | 5d | 1 | 0.68mi |
| 20259 Oakfield St Detroit, MI | 3.0 | 1.0 | 1056 | $1,250 | $1.18 | 17d | 1 | 0.81mi |
| 18481 Prest St Detroit, MI | 3.0 | 1.5 | 1100 | $1,300 | $1.18 | 19d | 1 | 0.89mi |
| 19818 Fenmore St Detroit, MI | 3.0 | 1.0 | 902 | $1,275 | $1.41 | 44d | 1 | 0.89mi |
| 20043 Fenmore St Detroit, MI | 3.0 | 1.0 | 1030 | $1,453 | $1.41 | 44d | 1 | 0.90mi |
| 19918 Southfield Fwy Detroit, MI | 3.0 | 1.0 | 915 | $1,375 | $1.50 | 15d | 1 | 0.93mi |
| 18400 Rutherford St Detroit, MI | 3.0 | 1.0 | 1050 | $1,400 | $1.33 | 3d | 1 | 0.99mi |
| 19970 Ashton Ave Detroit, MI | 3.0 | 1.0 | 1000 | $1,000 | $1.00 | 44d | 1 | 1.01mi |
| 16500 N Park Dr Southfield, MI | 1.0–3.0 | 1.0–2.5 | 1500 | $2,289 | $1.53 | 2d | 1 | 1.24mi |
| 18494 Ashton Ave Detroit, MI | 3.0 | 1.0 | 1000 | $1,600 | $1.60 | 17d | 1 | 1.31mi |
| 20011 Avon Ave Detroit, MI | 3.0 | 1.0 | 1000 | $1,200 | $1.20 | 5d | 1 | 1.34mi |
| 19445 Avon Ave Detroit, MI | 3.0 | 1.0 | 1023 | $1,550 | $1.52 | 44d | 1 | 1.37mi |
| 19329 Stahelin Ave Unit 1 Detroit, MI | 3.0 | 1.5 | 833 | $1,250 | $1.50 | 44d | 1 | 1.46mi |
Listing history 13 events
-
2026-06-18days on market $89,900 Active 20 DOM
-
2026-06-17days on market $89,900 Active 19 DOM
-
2026-06-15days on market $89,900 Active 17 DOM
-
2026-06-13days on market $89,900 Active 15 DOM
-
2026-06-13days on market $89,900 Active 14 DOM
-
2026-06-09days on market $89,900 Active 11 DOM
-
2026-06-08days on market $89,900 Active 10 DOM
-
2026-06-07days on market $89,900 Active 9 DOM
-
2026-06-04pricedays on market $89,900 Active 6 DOM
-
2026-06-03days on market $99,900 Active 5 DOM
-
2026-06-02days on market $99,900 Active 4 DOM
-
2026-06-01days on market $99,900 Active 3 DOM
-
2026-05-31days on market $99,900 Active 2 DOM
ⓘ Source: listings_history table (triggers on properties + properties_extension) + one-shot
backfill from property_details.listing_events for pre-trigger history.
Tax reassessment forecast MI · Partial reset (capped growth)
- Current annual tax
- $2,068 · $172/mo
- Projected year-2 tax
- $2,068 · $172/mo
- Expected delta
- $0/yr ($0/mo · 0.0%)
ⓘ Screening estimate from a state-policy table — verify with the county assessor before closing.
Climate risk First Street
- Flood 1/10 Low FEMA zone X (unshaded) · 0% chance over 30 yrs
- Wildfire 1/10 Low
- Heat 3/10 Moderate 7 d/yr ≥98°F today · 15 d/yr by 30 yrs out
- Wind 2/10 Low
- Air quality 3/10 Moderate 2 unhealthy d/yr today · 5 by 30 yrs out
Nearby sold comps map
Loading sold comps map…
Walkable amenities ~0.75 mi
Loading nearby amenities…
Taxation est. · year 1
- Rental income
- $27,612
- − Mortgage interest
- −$5,036
- − Property taxes
- −$2,068
- − Insurance
- −$450
- − Repairs & maintenance
- −$2,209
- − Management
- −$2,209
- − Depreciation
- −$2,615
- Taxable income
- $13,025
- Est. tax owed @ 24.0%
- −$3,126
- After-tax cash flow
- $10,512/yr
For passive investors: Depreciation is non-cash, so a rental often shows a tax loss while cash-flowing — sheltering income. Rental losses are passive: they offset passive income freely, and up to $25,000/yr can offset ordinary (W-2) income if you actively participate and your MAGI is under $100k (phasing out to $0 by $150k); unused losses carry forward. On sale, claimed depreciation is recaptured at up to 25%, and gains may owe capital-gains tax (a 1031 exchange can defer both). Figures are a year-1 estimate at your 24.0% rate — not tax advice; consult a CPA.
Schools (NCES district)
- District
- Detroit Public Schools Community District
- NCES district ID
- 2601103
- Math proficiency
- 10% ▼ -2.00%
- Reading proficiency
- 24% ▲ 6.00%
- Median HH income
- $25,815
- Composite
- 13.06/100
- National rank
- #9564
- State rank
- #499 of 540 in MI
Livability — Detroit
- Score
- 73/100
- State rank
- #218
- US rank
- #5427
Category grades
Schools grade is shown separately in the Schools card above.
Census & demographics
- Census place
- Detroit, MI
- County
- Wayne County · 1,562,939 people
- City population
- 572,865
- Metro
- Detroit-Warren-Dearborn, MI
- Population (ZIP)
- 45,600
- Household income
- $39,265
- Rent vs Own
- Severe rent burden
- 3064.0
Population outlook (Wayne County) Hauer SSP2
- Today (2025)
- 1,675,273 people
- By 2030
- 1,620,300 · -3.3%
- By 2040
- 1,502,341 · -10.3%
- By 2050
- 1,384,039 · -17.4%
- By 2075
- 1,124,592 · -32.9%
- By 2100
- 881,193 · -47.4%
Race, ethnicity, and origin ACS 2023
- Neighborhood character
- Predominantly Black (94%)
- Race & ethnicity
- Black 94% White 3% Two or more races 2% Hispanic / Latino 1%
- Foreign-born
- 1% · Canada
- Languages at home
- 98% English-only · Spanish 1%
Political lean MEDSL · Wayne
- 2024 margin
- Strong D (+29.0) · D 62.7% · R 33.7% · Other 3.6%
- 2008→2024 swing
- -20.5pp toward R · 2008: 49.5pp · 2024: 29.0pp
- All cycles
- 2024: D+29.0 2020: D+38.1 2016: D+37.3 2012: D+46.9 2008: D+49.5
Not yet ingested
- Civics
- —
Market trends
- HPI YoY
- ▼ -153.02%
- Current HPI
- 263.6326
- Rent YoY
- ▲ 3.25%
- Metro
- Detroit-Warren-Dearborn, MI
- State GDP YoY
- ▲ 1.37%
- F500 in state
- 28
Industry mix (Fortune 500 HQ in MI)
| Industry | F500 HQs | Revenue |
|---|---|---|
| Automotive Parts | 3 | $48B |
|
||
| Automotive | 2 | $372B |
|
||
| Chemicals | 1 | $45B |
|
||
| Automotive Retail | 1 | $29B |
|
||
| Healthcare / Medical Devices | 1 | $23B |
|
||
| Automotive Technology | 1 | $20B |
|
||
Price history
+181.4% since first listed38 events — show timeline
- 2026-05-29 Listed $99,900 REALCOMP
- 2026-05-29 Listed $99,900 MiRealSource-MiMLS
- 2026-05-29 Listed $99,900 REALCOMP
- 2026-05-01 Listing Removed — MiRealSource-MiMLS
- 2026-03-17 Relisted — REALCOMP
- 2026-03-17 Relisted — REALCOMP
- 2026-03-17 Relisted — MiRealSource-MiMLS
- 2026-02-20 Pending — REALCOMP
- 2026-02-20 Pending — REALCOMP
- 2026-02-20 Pending — MiRealSource-MiMLS
- 2026-02-20 Listing Removed — REALCOMP
- 2026-02-20 Listing Removed — REALCOMP
- 2026-01-23 Price Changed $99,900 MiRealSource-MiMLS
- 2026-01-23 Price Changed $99,900 MiRealSource-MiMLS
- 2026-01-22 Price Changed $99,900 REALCOMP
- 2026-01-22 Price Changed $99,900 REALCOMP
- 2026-01-19 Listed $109,900 REALCOMP
- 2026-01-19 Listed $109,900 MiRealSource-MiMLS
- 2025-10-28 Price Changed $109,900 MiRealSource-MiMLS
- 2025-10-28 Price Changed $109,900 REALCOMP
- 2025-08-06 Price Changed $112,900 MiRealSource-MiMLS
- 2025-08-06 Price Changed $112,900 REALCOMP
- 2025-05-27 Listed $128,900 REALCOMP
- 2021-05-26 Sold (Public Records) $42,000 Public Records
- 2021-03-09 Listing Removed — REALCOMP
- 2021-03-09 Listing Removed — MiRealSource-MiMLS
- 2021-03-05 Price Changed $43,500 MiRealSource-MiMLS
- 2021-03-04 Price Changed $43,500 REALCOMP
- 2021-03-04 Relisted — MiRealSource-MiMLS
- 2021-03-04 Relisted — REALCOMP
- 2021-01-28 Pending — MiRealSource-MiMLS
- 2021-01-28 Pending — REALCOMP
- 2021-01-10 Price Changed $45,500 MiRealSource-MiMLS
- 2021-01-09 Price Changed $45,500 REALCOMP
- 2021-01-02 Price Changed $38,500 MiRealSource-MiMLS
- 2021-01-02 Price Changed $38,500 REALCOMP
- 2020-12-30 Listed $35,500 MiRealSource-MiMLS
- 2020-12-30 Listed $35,500 REALCOMP
Property tax history
+3.9%/yrLatest (2025): $2,068 · -9.6% YoY. Source: county tax records.
Cash-flow waterfall
monthlySold comps — $/sqft
last 12 mo · ≤1 miLoading sold comps…