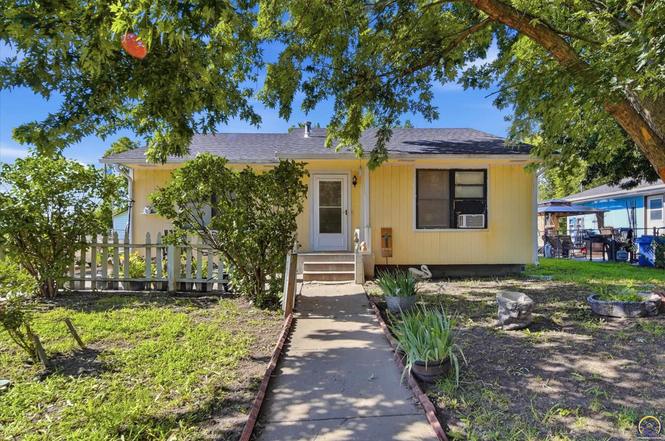
923 SE Wood St · Topeka, KS
Flood risk 4/10 · Minor
- FEMA flood zone
- AE
- Chance of flooding over 30 yrs
- 0.22%
- Est. flood insurance / yr
- $2,026 – $9,024
Fire risk 1/10 · Minimal
- Est. fire insurance / yr
- $1,154 – $2,142
Heat risk 5/10 · Moderate
- Hot days now (above 107°F)
- 7 days/yr
- Hot days in 30 yrs
- 17 days/yr
Wind risk 2/10 · Minimal
- Chance of severe wind over 30 yrs
- —
Air-quality risk 3/10 · Minor
- Unhealthy air days now
- 3 days/yr
- Unhealthy air days in 30 yrs
- 4 days/yr
Risk factors via First Street. Map © Google.
Why this score? — see what drove the C+ grade
The composite is a weighted blend of 9 inputs, each scored 0–100. Each bar is that input's sub-score; the figure is the points it added to the 100-point composite (weight × sub-score).
- Cash flow +24.1/30.0
- DSCR +7.8/10.0
- ARV discount +7.5/15.0
- 1% rule +6.1/10.0
- Appreciation +4.9/10.0
- Livability +3.5/5.0
- Rent growth +2.5/5.0
- Condition / age +2.5/5.0
- Schools +1.7/10.0
$91,500
🖨 Deal sheet 📄 Offer letter ✓ Due diligence
Listing remarks
This well-maintained 3-bedroom, 1-bath home offers a full unfinished basement with excellent storage and future potential. The front porch provides the perfect place to relax, while the fenced yard offers endless possibilities for gardening, pets, outdoor activities, and entertaining. With space both inside and out, this home is ready for its next owner. Property is being sold in its present As-Is condition.
Key facts
- Fenced yard
- Front porch
- 7,405 sq ft lot
Tags
Property features AI
Exterior
- Utilities: Public water; Public sewer
- Home design: Single-family residence; Residential property
- Construction: Frame construction
- Exterior features: Patio; Fenced yard
Interior
- Bathrooms: 1 full bathroom
- Heating & cooling: Window unit cooling
- Interior features: Gas water heater; Full, unfinished concrete basement
- Laundry & utility: Laundry areas on the main level and in the basement
Neighborhood map
What this means for you Summary
Snapshot
- This is a 3-bed/1.0-bath single-family listed at $92k.
Deal economics
- At list price, monthly cash flow is $-280 ($-3k/yr) — negative.
- To cash-flow at today's rent, offer at most $42k (54.1% below list).
- Meets the 1% rule at list price ($1k rent vs $92k).
- Recommended offer: $42k (54.1% below list) — sets the bar for cash-flow.
- Cap rate 8.7% vs local median 4.3% in Topeka — top-decile yield for the area; either an underpriced asset or a hidden risk that comps aren't pricing in. Stress-test before assuming the spread holds.
Location & tenants
- Location reads 69/100 on livability (#195 in KS) — a middle-class / working-renter tenant base. Strengths: cost of living A+, housing A+, health & safety A+; Watch: employment C-, crime F, commute F.
- Topeka Public Schools (urban): math 17% / reading 23% proficiency, ranked #158 of 169 in KS (top 94%) — low school quality limits family demand, transient renter base, plan for 1-2y turnover; 69% free/reduced lunch — lower-income household profile, screen leases tightly.
- Zoned schools: Scott Dual Language Magnet (math 22% / reading 17%, grade F, #593 of 684 statewide, top 89%, 391 students, 87% FRL); Eisenhower Middle School (math 10% / reading 8%, grade F, #204 of 219 statewide, top 94%, 486 students, 90% FRL); Topeka High (math 11% / reading 20%, grade F, #248 of 327 statewide, top 76%, 1,514 students, 72% FRL).
- Market conditions: 22 active listings in the ZIP; 14 comparable units currently listed for rent nearby; rentals at typical pace (median 21d on market — plan ~3-4 weeks tenant-placement turnaround); 219 units permitted in Shawnee County in 2024 (25 in 5+ unit buildings).
Forward outlook
- In year one you build about $404 of equity ($633 loan paydown + $-229 appreciation (-0.2% local appreciation)).
- Shawnee County population projected to shrink 7% by 2050 — rents likely to lag national; underwrite the cash flow, not the appreciation.
Negotiation context
- Only 4 days on market — expect competitive offers; lowballing is unlikely to land.
Risks & watch-outs
- Watch-outs: flood insurance adds $460/mo.
- Climate carrying-cost: in FEMA flood zone AE (mandatory federal flood insurance); extreme-heat days projected 7→17/yr by 2055 (HVAC capex compounding) — expect insurance premiums to compound above CPI over the hold.
Questions for the listing agent
- What do current leases actually rent for vs. the listed asking? Can we see a recent rent roll and the last 12 months of T-12 income?
- What's the actual annual flood-insurance premium (NFIP or private), and is the property in a SFHA with mandatory coverage?
- Is there a deadline driving the sale (1031 exchange, divorce, estate, relocation)? That informs how much negotiation room exists.
- Schools are D-rated, which usually means shorter tenancies and higher turnover. Who's the typical renter profile here, and what's been the actual vacancy rate?
- Crime grade is F in this area — have there been break-ins, vandalism, or insurance claims at this property in the last 3 years? What carrier currently insures it and at what premium?
- What's the average days-on-market for RENTAL listings here right now (not sales)? A rising rental-DOM trend means longer vacancies and softer asking-rent achievability than the comps imply.
- What's the recent tenant-quality profile in this submarket — average credit score on applications, eviction rate, late-payment / NSF rate, and stable-employment percentage? A property-management company in the area should have these aggregated.
- How much new for-sale + rental construction is in the pipeline within 1–3 miles? Heavy new supply typically softens prices + rents 12–24 months out; constrained supply supports both.
Investment metrics
- 1% rule
- 1.11% ✓
- Cap rate
- 8.66%
- Cash-on-cash
- 8.45%
- DSCR
- 1.38
- GRM
- 7.5
CMA / ARV
- ARV (on-the-fly)
- $33,536
- Comps found
- 1
Show comp detail 1 sale within ~0.75 mi
| Address | Dist | Beds/Ba | Sqft | Sold | Price | $/sf | Match |
|---|---|---|---|---|---|---|---|
| 1734 SE Adams St | 0.70mi | 2/1.0 (-1) | 1,088 (+4%) | 24mo | $34,900 | $32 | 36 |
Match score weights: distance 35% · size 25% · config 20% · recency 20%. Top-matched comps best support the ARV.
Projected returns pro-forma
-0.25% appreciation · 3.0% rent growth · sell at horizon
- IRR
- -18.4%
- Equity multiple
- 0.17×
- Total profit
- $-21,290
- Equity at exit
- $25,431
- IRR
- -11.4%
- Equity multiple
- -0.15×
- Total profit
- $-29,516
- Equity at exit
- $29,676
Cash invested: $25,620 (down + closing). Projections, not guarantees.
Landlord ↔ Tenant lean methodology
- Overall (STATE)
- 83 Strongly Landlord-Friendly
- State Kansas
- 83 Strongly Landlord-Friendly · R+10
- County
- — inherits STATE
- City
- — inherits STATE
ZIP-level market 66607
- Home prices YoY
- -0.1%
- Active inventory
- 22
- Price-to-rent
- 7.5×
Monthly cashflow live
- Estimated rent
- $1,012 high interval (Pro) →
- Mortgage (P&I)
- −$480
- Tax from tax record
- −$101 /mo · $1,211/yr
- Insurance
- −$38
- Flood insurance flood zone
- −$460 /mo · $5,525/yr
- HOA
- −$0
- Vacancy / Maint / Mgmt
- −$212
- Net cashflow
- $-280
Break-even live
UW: 25.0% down · 7.5% · 30yr · 1.5% tax · 5.0% vac · 8.0% maint · 8.0% mgmt
Financing live
Cash to close
- Down payment
- $22,875
- Closing costs
- $2,745
- Reserves months
- —
- Total cash needed
- —
Loan-product check · same deal, 3 products live
Conventional
25% down · 7.5% · 30yr
- Down + closing
- —
- Monthly P&I
- —
- Monthly cashflow
- —
- DSCR
- —
- Eligible?
- —
Personal DTI + credit; lowest rate.
DSCR
20% down · 8.5% · 30yr
- Down + closing
- —
- Monthly P&I
- —
- Monthly cashflow
- —
- DSCR
- —
- Eligible?
- —
No personal income docs; deal must DSCR.
Hard money
10% down · 12.0% · 12mo
- Down + closing
- —
- Monthly P&I
- —
- Monthly cashflow
- —
- DSCR
- —
- Eligible?
- —
Short-term bridge; refi at stabilization.
Rent comps 14 comps
| Address | Beds | Baths | Sqft | Rent | $/sqft | DOM | Units | Dist |
|---|---|---|---|---|---|---|---|---|
| 1724 SE Pennsylvania Ave Unit B Topeka, KS | 2.0 | 1.0 | 960 | $850 | $0.89 | 21d | 1 | 0.66mi |
| 1110 SE Powell St Topeka, KS | 2.0 | 1.5 | 765 | $695 | $0.91 | 21d | 1 | 0.89mi |
| 1110 SE Powell St Unit 12-2169 Topeka, KS | 3.0 | 1.5 | 909 | $980 | $1.08 | 21d | 1 | 0.93mi |
| 1001 NE Atchison Ave Topeka, KS | 2.0 | 1.0 | 689 | $809 | $1.17 | 21d | 19 | 0.96mi |
| 1438 SW Van Buren St Apt 4 Topeka, KS | 2.0 | 1.0 | 700 | $825 | $1.18 | 21d | 1 | 0.97mi |
| 512 SW 14th St Topeka, KS | 2.0 | 1.0 | 815 | $895 | $1.10 | 21d | 1 | 1.16mi |
| 101 N Kansas Ave Topeka, KS | 2.0 | 1.0 | 1009 | $1,325 | $1.31 | 21d | 3 | 1.21mi |
| 520 SW 5th St Topeka, KS | 4.0 | 1.0 | 1224 | $1,250 | $1.02 | 21d | 1 | 1.25mi |
| 1624 SW Polk St Topeka, KS | 3.0 | 2.0 | 1288 | $1,350 | $1.05 | 21d | 1 | 1.33mi |
| 1268 SW Western Ave Unit 1A Topeka, KS | 2.0 | 1.0 | 1404 | $1,000 | $0.71 | 21d | 1 | 1.36mi |
| 1415 SW Western Ave Topeka, KS | 4.0 | 1.0 | 1190 | $1,400 | $1.18 | 21d | 1 | 1.41mi |
| 423 SE Winfield Ave Unit 421-23 Arter-423 Arter Topeka, KS | 3.0 | 1.0 | 775 | $910 | $1.17 | 21d | 1 | 1.43mi |
| 502 NE Freeman Ave Topeka, KS | 2.0 | 1.0 | 750 | $875 | $1.17 | 21d | 1 | 1.47mi |
| 2435 SE Colorado Ave Topeka, KS | 3.0 | 1.0 | 1100 | $1,200 | $1.09 | 21d | 1 | 1.48mi |
Listing history 5 events
-
2026-06-19days on market $91,500 Active 4 DOM
-
2026-06-18days on market $91,500 Active 3 DOM
-
2026-06-17days on market $91,500 Active 2 DOM
-
2026-06-16remarks 411-char remark
-
2026-06-16$91,500 Active 1 DOM
ⓘ Source: listings_history table (triggers on properties + properties_extension) + one-shot
backfill from property_details.listing_events for pre-trigger history.
Tax reassessment forecast KS · Resets to sale price
- Current annual tax
- $1,211 · $101/mo
- Projected year-2 tax
- $1,290 · $108/mo
- Expected delta
- +$79/yr (+$7/mo · 6.5%)
ⓘ Screening estimate from a state-policy table — verify with the county assessor before closing.
Climate risk First Street
- Flood 4/10 Moderate FEMA zone AE · 22% chance over 30 yrs
- Wildfire 1/10 Low
- Heat 5/10 Major 7 d/yr ≥107°F today · 17 d/yr by 30 yrs out
- Wind 2/10 Low
- Air quality 3/10 Moderate 3 unhealthy d/yr today · 4 by 30 yrs out
Nearby sold comps map
Loading sold comps map…
Walkable amenities ~0.75 mi
Loading nearby amenities…
Taxation est. · year 1
- Rental income
- $12,141
- − Mortgage interest
- −$5,125
- − Property taxes
- −$1,211
- − Insurance
- −$5,982
- − Repairs & maintenance
- −$971
- − Management
- −$971
- − Depreciation
- −$2,662
- Taxable loss
- −$4,782
- Est. tax savings @ 24.0%
- +$1,148
- After-tax cash flow
- $-2,212/yr
For passive investors: Depreciation is non-cash, so a rental often shows a tax loss while cash-flowing — sheltering income. Rental losses are passive: they offset passive income freely, and up to $25,000/yr can offset ordinary (W-2) income if you actively participate and your MAGI is under $100k (phasing out to $0 by $150k); unused losses carry forward. On sale, claimed depreciation is recaptured at up to 25%, and gains may owe capital-gains tax (a 1031 exchange can defer both). Figures are a year-1 estimate at your 24.0% rate — not tax advice; consult a CPA.
Schools (NCES district)
- District
- Topeka Public Schools
- NCES district ID
- 2012260
- Math proficiency
- 17% ▼ -8.00%
- Reading proficiency
- 23% ▼ -2.00%
- Median HH income
- $37,405
- Composite
- 16.69/100
- National rank
- #9167
- State rank
- #158 of 169 in KS
Livability — Topeka
- Score
- 69/100
- State rank
- #195
- US rank
- #8848
Category grades
Schools grade is shown separately in the Schools card above.
Census & demographics
- Census place
- Topeka, KS
- City population
- 118,130
- Population (ZIP)
- 9,873
Population outlook (Shawnee County) Hauer SSP2
- Today (2025)
- 179,277 people
- By 2030
- 177,762 · -0.8%
- By 2040
- 172,341 · -3.9%
- By 2050
- 166,330 · -7.2%
- By 2075
- 152,417 · -15.0%
- By 2100
- 134,782 · -24.8%
Race, ethnicity, and origin ACS 2023
- Neighborhood character
- Diverse neighborhood (Simpson 0.67)
- Race & ethnicity
- Hispanic / Latino 43% White 32% Black 20% Two or more races 16% Native American 1%
- Hispanic origin (detail)
- Mexican 38% Puerto Rican 2% Cuban 1%
- Common ancestry
- Lithuanian 2% Iranian 1%
- Foreign-born
- 12% · Canada, Dominican Republic
- Languages at home
- 76% English-only · Spanish 23%
Political lean MEDSL · Shawnee
- 2024 margin
- Toss-up / Even · D 49.3% · R 48.8% · Other 2.0%
- 2008→2024 swing
- +0.8pp no change · 2008: -0.3pp · 2024: 0.5pp
- All cycles
- 2024: D+0.5 2020: D+3.0 2016: R+2.8 2012: R+1.7 2008: R+0.3
Not yet ingested
- Civics
- —
Market trends
- HPI YoY
- ▼ -0.25%
- Current HPI
- 171.7381
- Rent YoY
- —
- Metro
- —
- State GDP YoY
- —
- F500 in state
- 0
Price history
2 events — show timeline
- 2026-06-16 Listed $91,500 Sunflower MLS as distributed by MLS GRID
- 2015-10-26 Sold (Public Records) — Public Records
Property tax history
+1.9%/yrLatest (2025): $1,211 · +9.8% YoY. Source: county tax records.
Cash-flow waterfall
monthlySold comps — $/sqft
last 12 mo · ≤1 miLoading sold comps…