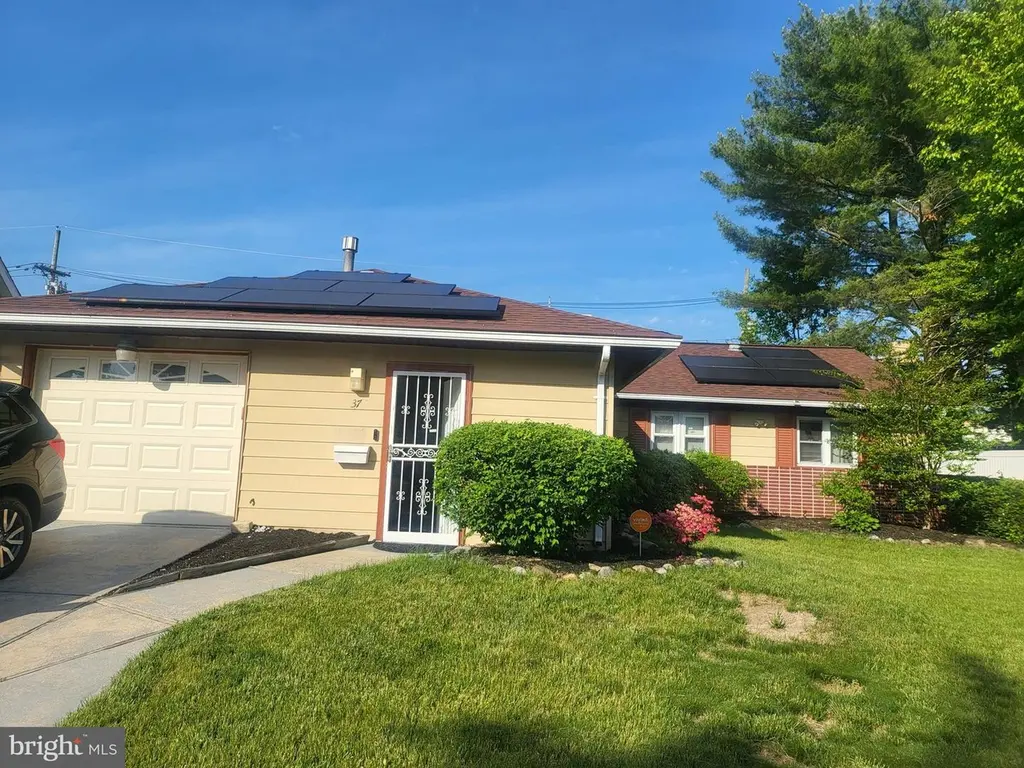
37 Balfour Ln · Burlington, NJ
Flood risk 1/10 · Minimal
- FEMA flood zone
- X (unshaded)
- Chance of flooding over 30 yrs
- 0.0%
- Est. flood insurance / yr
- $507 – $1,088
Fire risk 1/10 · Minimal
- Est. fire insurance / yr
- $526 – $976
Heat risk 7/10 · Major
- Hot days now (above 103°F)
- 7 days/yr
- Hot days in 30 yrs
- 15 days/yr
Wind risk 6/10 · Moderate
- Chance of severe wind over 30 yrs
- 27.0%
Air-quality risk 4/10 · Minor
- Unhealthy air days now
- 5 days/yr
- Unhealthy air days in 30 yrs
- 7 days/yr
Risk factors via First Street. Map © Google.
Why this score? — see what drove the C grade
The composite is a weighted blend of 9 inputs, each scored 0–100. Each bar is that input's sub-score; the figure is the points it added to the 100-point composite (weight × sub-score).
- Cash flow +21.5/30.0
- ARV discount +15.0/15.0
- DSCR +6.9/10.0
- 1% rule +5.8/10.0
- Livability +3.9/5.0
- Rent growth +2.5/5.0
- Condition / age +2.5/5.0
- Schools +1.7/10.0
- Appreciation +0.0/10.0
$275,000
🖨 Deal sheet (PDF) 📄 Offer letter ✓ Due diligence
Listing remarks
This rancher simply needs a little updating to restore it to it's Glory Days!!!This home features a enclosed porch and a Sun room. Loads of space in this three bed room ranch. Complete with a eat in kitchen and a fenced yard.
Key facts
- Fenced yard
- Sun room
- Enclosed porch
Tags
Property features AI
Finance
- Other: Pet-friendly with breed restrictions
- Financial info: Lease not considered
Exterior
- Parking: Attached front-entry garage with garage door opener; Driveway parking; One total garage/parking space
- Utilities: Public water; Public sewer; Natural gas hot water and heating
- Home design: Detached single-family home; Fee simple ownership; Average condition
- Construction: Frame construction; Slab foundation; Year-built source: assessor
- Exterior features: Lot dimensions approximately 65 x 100; Tidal water not present; Other structures: above grade and below grade (no finished basement)
Interior
- Kitchen: Dishwasher
- Bedrooms: Three main-level bedrooms
- Flooring: Laminate plank flooring; Luxury vinyl plank flooring
- Bathrooms: Two full bathrooms (both on the main level)
- Heating & cooling: Baseboard hot water heating; Wall unit cooling (electric)
- Interior features: 36"+ wide hallways; Grab bars installed; No basement; Family room; Den; Sun/Florida room
- Laundry & utility: No basement (utility/laundry location not specified)
Neighborhood map
What this means for you Summary
Snapshot
- This is a 3-bed/2.0-bath single-family listed at $275k.
Deal economics
- At list price, monthly cash flow is $414 ($5k/yr) — positive.
- The deal already cash-flows at list — no discount required.
- Meets the 1% rule at list price ($3k rent vs $275k).
- Recommended offer: $271k (1.5% below list) — sets the bar for market timing.
- Cap rate 8.1% vs local median 4.9% in Burlington — top-decile yield for the area; either an underpriced asset or a hidden risk that comps aren't pricing in. Stress-test before assuming the spread holds.
Location & tenants
- Location reads 78/100 on livability (#89 in NJ, #2,359 nationally) — a middle-class / working-renter tenant base. Strengths: housing A+, health & safety A+, cost of living A-; Watch: amenities F.
- Willingboro Public School District (suburban): math 5% / reading 30% proficiency, ranked #433 of 472 in NJ (top 92%) — low school quality limits family demand, transient renter base, plan for 1-2y turnover.
- Zoned schools: Willingboro Memorial Middle School (math 5% / reading 34%, grade F, #398 of 431 statewide, top 93%, 600 students, 8% FRL); Willingboro High School (math 2% / reading 37%, grade F, #354 of 399 statewide, top 89%, 842 students, 0% FRL) — zoned schools average 4% FRL vs 48% district-wide (44 pts lower); this property's tenant base skews higher-income than the district average.
- Market conditions: 155 active listings in the ZIP; 18 comparable units currently listed for rent nearby; rentals leasing fast (median 0d on market — plan ~1-2 weeks tenant-placement turnaround); solid renter incomes; 2,161 units permitted in Burlington County in 2024 (988 in 5+ unit buildings).
- This rent runs 36% of the median local income ($98k/yr) — at the standard rent-burdened threshold; future hikes will face affordability resistance.
Forward outlook
- Local home prices are declining (-3.0%/yr); year-one equity from $2k of loan paydown is wiped out by about $8k of value loss. Plan a longer hold.
- Burlington County population projected to shrink 5% by 2050 — rents likely to lag national; underwrite the cash flow, not the appreciation.
Negotiation context
- It's been on market 20 days — a 2% lower offer ($271k) is reasonable based on typical stale-listing flexibility.
Risks & watch-outs
- Watch-outs: built in 1959 — expect roof / HVAC / electrical / plumbing capex.
- Climate carrying-cost: major wind risk, 27% chance of damaging wind over 30y; extreme-heat days projected 7→15/yr by 2055 (HVAC capex compounding) — expect insurance premiums to compound above CPI over the hold.
Questions for the listing agent
- Built in 1959 — when were the roof, HVAC, electrical panel, plumbing, and water heater last replaced?
- Is there a deadline driving the sale (1031 exchange, divorce, estate, relocation)? That informs how much negotiation room exists.
- What's the average days-on-market for RENTAL listings here right now (not sales)? A rising rental-DOM trend means longer vacancies and softer asking-rent achievability than the comps imply.
- What's the recent tenant-quality profile in this submarket — average credit score on applications, eviction rate, late-payment / NSF rate, and stable-employment percentage? A property-management company in the area should have these aggregated.
- How much new for-sale + rental construction is in the pipeline within 1–3 miles? Heavy new supply typically softens prices + rents 12–24 months out; constrained supply supports both.
Investment metrics
- 1% rule
- 1.08% ✓
- Cap rate
- 8.10%
- Cash-on-cash
- 6.45%
- DSCR
- 1.29
- GRM
- 7.7
CMA / ARV
- ARV (on-the-fly)
- $375,615
- Comps found
- 12
Show comp detail 12 sales within ~0.75 mi
| Address | Dist | Beds/Ba | Sqft | Sold | Price | $/sf | Match |
|---|---|---|---|---|---|---|---|
| 25 Blackwell Ln | 0.24mi | 4/2.0 (+1) | 1,372 (-7%) | 1mo | $340,000 | $248 | 71 |
| 11 Birdseye Ln | 0.27mi | 4/2.0 (+1) | 1,372 (-7%) | 1mo | $400,000 | $292 | 70 |
| 60 Sheffield Dr | 0.30mi | 4/2.0 (+1) | 1,372 (-7%) | 2mo | $350,000 | $255 | 68 |
| 11 Buxmont Ln | 0.31mi | 4/2.0 (+1) | 1,372 (-7%) | 3mo | $340,000 | $248 | 67 |
| 42 Bucknell Ln | 0.54mi | 3/2.0 | 1,384 (-6%) | 2mo | $365,000 | $264 | 63 |
| 30 Beechfern Ln | 0.46mi | 4/2.0 (+1) | 1,372 (-7%) | 1mo | $360,000 | $262 | 61 |
| 21 Berkshire Ln | 0.54mi | 3/2.0 | 1,372 (-7%) | 3mo | $388,000 | $283 | 61 |
| 71 Shawmont Ln | 0.44mi | 4/1.0 (+1) | 1,624 (+10%) | 3mo | $260,000 | $160 | 51 |
| 21 Stafford Ln | 0.69mi | 4/2.0 (+1) | 1,572 (+7%) | 2mo | $369,000 | $235 | 50 |
| 139 Hillcrest Ln | 0.73mi | 4/2.0 (+1) | 1,562 (+6%) | 4mo | $325,000 | $208 | 47 |
| 14 Anthony Dr | 0.72mi | 3/2.5 | 1,608 (+9%) | 4mo | $460,000 | $286 | 45 |
| 8 Ballad Ln | 0.64mi | 3/2.0 | 1,684 (+14%) | 5mo | $385,000 | $229 | 43 |
Match score weights: distance 35% · size 25% · config 20% · recency 20%. Top-matched comps best support the ARV.
Projected returns pro-forma
-3.0% appreciation · 3.0% rent growth · sell at horizon
- IRR
- -6.4%
- Equity multiple
- 0.76×
- Total profit
- $-18,150
- Equity at exit
- $41,003
- IRR
- 3.3%
- Equity multiple
- 1.24×
- Total profit
- $18,380
- Equity at exit
- $23,777
Cash invested: $77,000 (down + closing). Projections, not guarantees.
Landlord ↔ Tenant lean methodology
- Overall (STATE)
- 21 Tenant-Leaning
- State New Jersey
- 21 Tenant-Leaning · D+6
- County
- — inherits STATE
- City
- — inherits STATE
ZIP-level market 08046
- Active inventory
- 155
- Price-to-rent
- 7.7×
Monthly cashflow live
- Estimated rent
- $2,967 high interval (Pro) →
- Mortgage (P&I)
- −$1,442
- Tax from tax record
- −$373 /mo · $4,479/yr
- Insurance
- −$115
- HOA
- −$0
- Vacancy / Maint / Mgmt
- −$623
- Net cashflow
- $414
Break-even live
Sensitivity live
| Price | -10% $569 | -5% $492 | +0% $414 | +5% $336 | +10% $258 |
|---|---|---|---|---|---|
| Rent | -10% $179 | -5% $297 | +0% $414 | +5% $531 | +10% $648 |
| Rate | -1.0pp $552 | -0.5pp $484 | base $414 | +0.5pp $342 | +1.0pp $270 |
UW: 25.0% down · 7.5% · 30yr · 1.5% tax · 5.0% vac · 8.0% maint · 8.0% mgmt
Financing live
Cash to close
- Down payment
- $68,750
- Closing costs
- $8,250
- Reserves months
- —
- Total cash needed
- —
Loan-product check · same deal, 3 products live
Conventional
25% down · 7.5% · 30yr
- Down + closing
- —
- Monthly P&I
- —
- Monthly cashflow
- —
- DSCR
- —
- Eligible?
- —
Personal DTI + credit; lowest rate.
DSCR
20% down · 8.5% · 30yr
- Down + closing
- —
- Monthly P&I
- —
- Monthly cashflow
- —
- DSCR
- —
- Eligible?
- —
No personal income docs; deal must DSCR.
Hard money
10% down · 12.0% · 12mo
- Down + closing
- —
- Monthly P&I
- —
- Monthly cashflow
- —
- DSCR
- —
- Eligible?
- —
Short-term bridge; refi at stabilization.
Rent comps 18 comps
| Address | Beds | Baths | Sqft | Rent | $/sqft | DOM | Units | Dist |
|---|---|---|---|---|---|---|---|---|
| 17 Snowdon Ln Willingboro, NJ | 3.0 | 2.0 | 1200 | $2,700 | $2.25 | 0d | 1 | 0.26mi |
| 1000 Ivorie Ct Burlington, NJ | 1.0–2.0 | 1.0 | 1025 | $2,075 | $2.02 | 25d | 1 | 0.42mi |
| 1020 Jardin Ct Burlington, NJ | 2.0 | 1.0 | 1024 | $1,800 | $1.76 | 6d | 1 | 0.43mi |
| 6 Sherwood Ln Willingboro, NJ | 4.0 | 2.0 | 1372 | $3,200 | $2.33 | 0d | 1 | 0.47mi |
| 29 Hinsdale Ln Willingboro, NJ | 4.0 | 2.0 | 1570 | $3,750 | $2.39 | 0d | 1 | 0.49mi |
| 34 Hopkins Ln Willingboro, NJ | 3.0 | 2.0 | 1696 | $3,200 | $1.89 | 0d | 1 | 0.58mi |
| 20 Sussex Dr Unit Sfh Willingboro, NJ | 4.0 | 2.0 | 1000 | $2,850 | $2.85 | 0d | 1 | 0.62mi |
| 48 Sandstone Ln Willingboro, NJ | 4.0 | 2.0 | 1372 | $2,700 | $1.97 | 0d | 1 | 0.76mi |
| 89 Hampshire Ln Willingboro, NJ | 4.0 | 2.0 | 1562 | $3,400 | $2.18 | 11d | 1 | 0.86mi |
| 17 Bonnie Ln Willingboro, NJ | 4.0 | 2.5 | 1797 | $2,890 | $1.61 | 25d | 1 | 0.86mi |
| 1020 Woodlane Rd Beverly, NJ | 2.0 | 1.0–1.5 | 1515 | $2,054 | $1.36 | 0d | 14 | 0.93mi |
| 28 Palmer Sq Beverly, NJ | 2.0 | 1.5 | 1096 | $2,450 | $2.24 | 0d | 1 | 0.95mi |
| 10 Melville Ln Willingboro, NJ | 4.0 | 2.5 | 1797 | $3,000 | $1.67 | 16d | 1 | 1.22mi |
| 52 Creekside Way Burlington, NJ | 3.0 | 3.5 | 1764 | $3,100 | $1.76 | 0d | 1 | 1.24mi |
| 20 Mosshill Ln Unit 4BR Willingboro, NJ | 4.0 | 1.5 | 1000 | $2,900 | $2.90 | 25d | 1 | 1.25mi |
| 74 Plumtree Ln Willingboro, NJ | 4.0 | 2.0 | 1624 | $3,000 | $1.85 | 0d | 1 | 1.38mi |
| 4236 Route 130 Willingboro, NJ | 1.0–3.0 | 1.0–2.5 | 1278 | $2,710 | $2.12 | 0d | 1 | 1.40mi |
| 61 Pennant Ln Willingboro, NJ | 3.0 | 2.0 | 1384 | $2,800 | $2.02 | 2d | 1 | 1.49mi |
Listing history 2 events
-
2026-06-13status $275,000 Pending 20 DOM
-
2026-05-07$275,000 Active
ⓘ Source: listings_history table (triggers on properties + properties_extension) + one-shot
backfill from property_details.listing_events for pre-trigger history.
Tax reassessment forecast NJ · Partial reset (capped growth)
- Current annual tax
- $4,479 · $373/mo
- Projected year-2 tax
- $5,663 · $472/mo
- Expected delta
- +$1,184/yr (+$99/mo · 26.4%)
ⓘ Screening estimate from a state-policy table — verify with the county assessor before closing.
Climate risk First Street
- Flood 1/10 Low FEMA zone X (unshaded) · 0% chance over 30 yrs
- Wildfire 1/10 Low
- Heat 7/10 Severe 7 d/yr ≥103°F today · 15 d/yr by 30 yrs out
- Wind 6/10 Major 27% chance of damaging wind over 30 yrs
- Air quality 4/10 Moderate 5 unhealthy d/yr today · 7 by 30 yrs out
Nearby sold comps map
Loading sold comps map…
Walkable amenities ~0.75 mi
Loading nearby amenities…
Taxation est. · year 1
- Rental income
- $35,600
- − Mortgage interest
- −$15,404
- − Property taxes
- −$4,479
- − Insurance
- −$1,375
- − Repairs & maintenance
- −$2,848
- − Management
- −$2,848
- − Depreciation
- −$8,000
- Taxable income
- $646
- Est. tax owed @ 24.0%
- −$155
- After-tax cash flow
- $4,809/yr
For passive investors: Depreciation is non-cash, so a rental often shows a tax loss while cash-flowing — sheltering income. Rental losses are passive: they offset passive income freely, and up to $25,000/yr can offset ordinary (W-2) income if you actively participate and your MAGI is under $100k (phasing out to $0 by $150k); unused losses carry forward. On sale, claimed depreciation is recaptured at up to 25%, and gains may owe capital-gains tax (a 1031 exchange can defer both). Figures are a year-1 estimate at your 24.0% rate — not tax advice; consult a CPA.
Schools (NCES district)
- District
- Willingboro Public School District
- NCES district ID
- 3418000
- Math proficiency
- 5% ▼ -11.00%
- Reading proficiency
- 30% ▼ -1.00%
- Median HH income
- $67,064
- Composite
- 17.37/100
- National rank
- #9074
- State rank
- #433 of 472 in NJ
Livability — Burlington
- Score
- 78/100
- State rank
- #89
- US rank
- #2359
Category grades
Schools grade is shown separately in the Schools card above.
Census & demographics
- County
- Burlington County · 323,710 people
- Metro
- Philadelphia-Camden-Wilmington, PA-NJ-DE-MD
- Population (ZIP)
- 31,981
- Household income
- $98,178
- Rent vs Own
- Severe rent burden
- 342.0
Population outlook (Burlington County) Hauer SSP2
- Today (2025)
- 453,425 people
- By 2030
- 452,359 · -0.2%
- By 2040
- 445,033 · -1.9%
- By 2050
- 431,760 · -4.8%
- By 2075
- 406,277 · -10.4%
- By 2100
- 364,732 · -19.6%
Race, ethnicity, and origin ACS 2023
- Neighborhood character
- Predominantly Black (66%)
- Race & ethnicity
- Black 66% Hispanic / Latino 15% Two or more races 14% White 10%
- Hispanic origin (detail)
- Puerto Rican 9% Dominican 2%
- Common ancestry
- Swiss 4% Romanian 2% Hispanic 1%
- Foreign-born
- 15% · Canada, Jamaica
- Languages at home
- 82% English-only · Spanish 10% French/Haitian/Cajun 2% Other Indo-European 1%
Political lean MEDSL · Burlington
- 2024 margin
- D (+16.6) · D 57.6% · R 41.0% · Other 1.3%
- 2008→2024 swing
- -2.0pp toward R · 2008: 18.6pp · 2024: 16.6pp
- All cycles
- 2024: D+16.6 2020: D+19.5 2016: D+14.8 2012: D+18.7 2008: D+18.6
Not yet ingested
- Civics
- —
Market trends
- HPI YoY
- ▼ -273.52%
- Current HPI
- 348.3441
- Rent YoY
- —
- Metro
- Philadelphia-Camden-Wilmington, PA-NJ-DE-MD
- State GDP YoY
- ▲ 2.05%
- F500 in state
- 34
Industry mix (Fortune 500 HQ in NJ)
| Industry | F500 HQs | Revenue |
|---|---|---|
| Consumer Goods | 3 | $31B |
|
||
| Pharmaceuticals | 2 | $153B |
|
||
| Technology | 2 | $21B |
|
||
| Insurance | 2 | $20B |
|
||
| Healthcare | 2 | $19B |
|
||
| Financial Services | 1 | $70B |
|
||
Price history
1 event — show timeline
- 2026-05-07 Listed $275,000 BRIGHT MLS
Property tax history
+1.4%/yrLatest (2014): $4,479 · +3.4% YoY. Source: county tax records.
Cash-flow waterfall
monthlySold comps — $/sqft
last 12 mo · ≤1 miLoading sold comps…