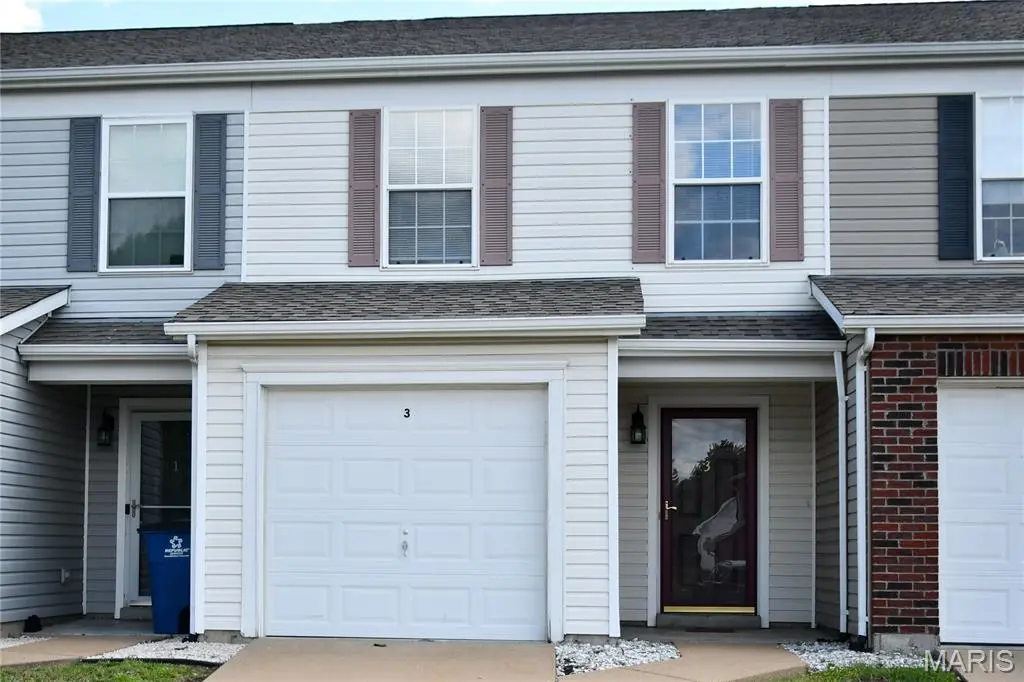
3 Hensley Ter · Jennings, MO
Flood risk 1/10 · Minimal
- FEMA flood zone
- X (unshaded)
- Chance of flooding over 30 yrs
- 0.0%
- Est. flood insurance / yr
- $507 – $1,088
Fire risk 1/10 · Minimal
- Est. fire insurance / yr
- $1,054 – $1,958
Heat risk 5/10 · Moderate
- Hot days now (above 107°F)
- 7 days/yr
- Hot days in 30 yrs
- 21 days/yr
Wind risk 2/10 · Minimal
- Chance of severe wind over 30 yrs
- 1.0%
Air-quality risk 4/10 · Minor
- Unhealthy air days now
- 5 days/yr
- Unhealthy air days in 30 yrs
- 6 days/yr
Risk factors via First Street. Map © Google.
Why this score? — see what drove the D grade
The composite is a weighted blend of 9 inputs, each scored 0–100. Each bar is that input's sub-score; the figure is the points it added to the 100-point composite (weight × sub-score).
- Cash flow +8.7/30.0
- ARV discount +7.5/15.0
- Appreciation +6.9/10.0
- 1% rule +4.5/10.0
- Rent growth +3.7/5.0
- Livability +3.4/5.0
- Condition / age +2.5/5.0
- DSCR +2.4/10.0
- Schools +1.1/10.0
$130,000
🖨 Deal sheet (PDF) 📄 Offer letter ✓ Due diligence
Listing remarks
Freshly painted and move-in ready! This spacious 3-bedroom, 2.5-bath home offers comfortable living with a functional layout and no basement maintenance to worry about. The owner’s suite features a private full bath, while two of the three bedrooms include walk-in closets for excellent storage. Convenient second-floor laundry makes everyday living easy. Enjoy the attached 1-car garage and the added value of all appliances staying with the home. Located close to public transportation, shopping, and everyday amenities, this home combines convenience and comfort in one great package! Seller prefers to sell the property as-is.
Key facts
- Move-in ready
- Second-floor laundry
- Attached garage
Tags
Property features AI
Finance
- HOA & community: HOA: The Crossing at Alexandria Place; Monthly association fee of $150; HOA covers grounds maintenance, common area maintenance, management, and snow removal; Association provides outside management and parking
Exterior
- Parking: Attached garage (1 car)
- Utilities: Public water; Public sewer; Electric service by Ameren; Cable available; Electricity connected; Natural gas connected; Sewer connected; Underground utilities; Water connected
- Home design: Attached condominium; Two levels
- Construction: Vinyl siding
- Exterior features: Covered patio; Patio; Porch; Screened porch; Entry steps/stairs; Exterior lighting; Rain gutters; Adjoins common ground; Near public transit
Interior
- Kitchen: Stainless steel appliances; Dishwasher; Disposal; Exhaust fan; Microwave; Electric oven; Range hood; Refrigerator; Water heater
- Bedrooms: 3 bedrooms on the upper level
- Flooring: Carpet
- Bathrooms: 2 full bathrooms; 1 half bathroom
- Heating & cooling: Natural gas heating; Central air conditioning; Ceiling fans for cooling
- Interior features: Ceiling fans; Open floor plan; Pantry; Walk-in closets
- Laundry & utility: Laundry on the 2nd floor
Neighborhood map
What this means for you Summary
Snapshot
- This is a 2-bed/2.0-bath single-family listed at $130k.
Deal economics
- At list price, monthly cash flow is $-109 ($-1k/yr) — negative.
- To cash-flow at today's rent, offer at most $111k (14.8% below list).
- To meet the 1% rule (rent ≥ 1% of price), the offer needs to be $123k (5.4% below list).
- Recommended offer: $111k (14.8% below list) — sets the bar for cash-flow.
- Cap rate 5.3% vs local median 12.0% in Jennings — below-typical yield; the buyer is paying a premium for something (appreciation thesis, condition, location) that the cap rate doesn't capture.
Location & tenants
- Location reads 67/100 on livability (#208 in MO) — a middle-class / working-renter tenant base. Strengths: cost of living A+, commute A-, housing A-; Watch: crime F, amenities F, employment F.
- Jennings (suburban): math 8% / reading 20% proficiency, ranked #315 of 324 in MO (top 97%) — low school quality limits family demand, transient renter base, plan for 1-2y turnover; 86% free/reduced lunch — lower-income household profile, screen leases tightly.
- Zoned schools: Northview Elem. (math 3% / reading 20%, grade F, #1,022 of 1,115 statewide, top 92%, 524 students, 100% FRL); Rose Johnson Jennings Jr. High (math 10% / reading 23%, grade F, #357 of 391 statewide, top 91%, 361 students, 100% FRL); Jennings High (math 8% / reading 17%, grade F, #497 of 521 statewide, top 96%, 691 students, 100% FRL).
- Market conditions: Rents rising fast (+5.0%/yr); 376 active listings in the ZIP; 40 comparable units currently listed for rent nearby; rentals at typical pace (median 26d on market — plan ~3-4 weeks tenant-placement turnaround); lower-income renter base — watch delinquency; 920 units permitted in St. Louis County in 2024 (250 in 5+ unit buildings).
- This rent runs 36% of the median local income ($41k/yr) — at the standard rent-burdened threshold; future hikes will face affordability resistance.
Forward outlook
- In year one you build about $6k of equity ($899 loan paydown + $5k appreciation (3.8% local appreciation)).
- By year 6, paydown + projected appreciation supports a ~$31k cash-out refi (75% LTV) — recoverable capital for the next deal without selling this one.
Negotiation context
- It's been on market 24 days — a 2% lower offer ($128k) is reasonable based on typical stale-listing flexibility.
Risks & watch-outs
- Climate carrying-cost: extreme-heat days projected 7→21/yr by 2055 (HVAC capex compounding) — expect insurance premiums to compound above CPI over the hold.
Questions for the listing agent
- What do current leases actually rent for vs. the listed asking? Can we see a recent rent roll and the last 12 months of T-12 income?
- What does the HOA fee cover, when was the last increase, and are there any pending special assessments or reserve-fund shortfalls?
- Is there a deadline driving the sale (1031 exchange, divorce, estate, relocation)? That informs how much negotiation room exists.
- Schools are D-rated, which usually means shorter tenancies and higher turnover. Who's the typical renter profile here, and what's been the actual vacancy rate?
- Crime grade is F in this area — have there been break-ins, vandalism, or insurance claims at this property in the last 3 years? What carrier currently insures it and at what premium?
- The area grade is low — what's the realistic commute time and amenity access for the typical tenant pool here? Any planned neighborhood developments (good or bad) we should know about?
- What's the average days-on-market for RENTAL listings here right now (not sales)? A rising rental-DOM trend means longer vacancies and softer asking-rent achievability than the comps imply.
- What's the recent tenant-quality profile in this submarket — average credit score on applications, eviction rate, late-payment / NSF rate, and stable-employment percentage? A property-management company in the area should have these aggregated.
- How much new for-sale + rental construction is in the pipeline within 1–3 miles? Heavy new supply typically softens prices + rents 12–24 months out; constrained supply supports both.
Investment metrics
- 1% rule
- 0.95% ✗
- Cap rate
- 5.29%
- Cash-on-cash
- -3.59%
- DSCR
- 0.84
- GRM
- 8.8
CMA / ARV
- ARV (on-the-fly)
- $77,210
- Comps found
- 12
Show comp detail 12 sales within ~0.75 mi
| Address | Dist | Beds/Ba | Sqft | Sold | Price | $/sf | Match |
|---|---|---|---|---|---|---|---|
| 9435 Eastchester Dr | 0.32mi | 3/1.0 (+1) | 1,195 (+8%) | 2mo | $55,500 | $46 | 61 |
| 9418 Pattonwood Dr | 0.33mi | 3/2.0 (+1) | 982 (-11%) | 3mo | $134,450 | $137 | 59 |
| 8870 Saint Cyr Dr | 0.58mi | 3/1.0 (+1) | 1,131 (+2%) | 2mo | $39,900 | $35 | 58 |
| 9468 Halls Ferry Rd | 0.20mi | 3/0.5 (+1) | 975 (-12%) | 2mo | $67,500 | $69 | 58 |
| 9426 Westchester Dr | 0.41mi | 2/1.0 | 982 (-11%) | 1mo | $68,900 | $70 | 58 |
| 1147 Jolene Dr | 0.61mi | 3/2.0 (+1) | 1,046 (-5%) | 1mo | $149,000 | $142 | 57 |
| 2225 Kerwin Dr | 0.73mi | 3/1.0 (+1) | 1,135 (+3%) | 2mo | $135,900 | $120 | 51 |
| 9456 Bagley Dr | 0.65mi | 2/2.0 | 982 (-11%) | 2mo | $55,000 | $56 | 50 |
| 9481 Adler Ave | 0.65mi | 3/1.0 (+1) | 1,046 (-5%) | 3mo | $89,900 | $86 | 50 |
| 9240 Hathaway Dr | 0.59mi | 2/1.0 | 982 (-11%) | 2mo | $130,000 | $132 | 49 |
| 8930 Sides Ct | 0.71mi | 3/1.5 (+1) | 1,008 (-9%) | 1mo | $65,000 | $64 | 44 |
| 9742 Wendell Dr | 0.74mi | 3/1.0 (+1) | 1,014 (-8%) | 2mo | $69,900 | $69 | 41 |
Match score weights: distance 35% · size 25% · config 20% · recency 20%. Top-matched comps best support the ARV.
Projected returns pro-forma
3.79% appreciation · 4.97% rent growth · sell at horizon
- IRR
- 7.6%
- Equity multiple
- 1.46×
- Total profit
- $16,858
- Equity at exit
- $64,322
- IRR
- 11.0%
- Equity multiple
- 2.85×
- Total profit
- $67,268
- Equity at exit
- $103,956
Cash invested: $36,400 (down + closing). Projections, not guarantees.
Landlord ↔ Tenant lean methodology
- Overall (STATE)
- 81 Strongly Landlord-Friendly
- State Missouri
- 81 Strongly Landlord-Friendly · R+10
- County
- — inherits STATE
- City
- — inherits STATE
ZIP-level market 63136
- Home prices YoY
- 0.9%
- Rents YoY
- 5.0%
- Active inventory
- 376
- Price-to-rent
- 8.8×
Monthly cashflow live
- Estimated rent
- $1,230 high interval (Pro) →
- Mortgage (P&I)
- −$682
- Tax from tax record
- −$195 /mo · $2,335/yr
- Insurance
- −$54
- HOA
- −$150
- Vacancy / Maint / Mgmt
- −$258
- Net cashflow
- $-109
Break-even live
Sensitivity live
| Price | -10% $-35 | -5% $-72 | +0% $-109 | +5% $-146 | +10% $-182 |
|---|---|---|---|---|---|
| Rent | -10% $-206 | -5% $-157 | +0% $-109 | +5% $-60 | +10% $-12 |
| Rate | -1.0pp $-43 | -0.5pp $-76 | base $-109 | +0.5pp $-143 | +1.0pp $-177 |
UW: 25.0% down · 7.5% · 30yr · 1.5% tax · 5.0% vac · 8.0% maint · 8.0% mgmt
Financing live
Cash to close
- Down payment
- $32,500
- Closing costs
- $3,900
- Reserves months
- —
- Total cash needed
- —
Loan-product check · same deal, 3 products live
Conventional
25% down · 7.5% · 30yr
- Down + closing
- —
- Monthly P&I
- —
- Monthly cashflow
- —
- DSCR
- —
- Eligible?
- —
Personal DTI + credit; lowest rate.
DSCR
20% down · 8.5% · 30yr
- Down + closing
- —
- Monthly P&I
- —
- Monthly cashflow
- —
- DSCR
- —
- Eligible?
- —
No personal income docs; deal must DSCR.
Hard money
10% down · 12.0% · 12mo
- Down + closing
- —
- Monthly P&I
- —
- Monthly cashflow
- —
- DSCR
- —
- Eligible?
- —
Short-term bridge; refi at stabilization.
Rent comps 40 comps
| Address | Beds | Baths | Sqft | Rent | $/sqft | DOM | Units | Dist |
|---|---|---|---|---|---|---|---|---|
| 9418 Pattonwood Dr Saint Louis, MO | 2.0 | 2.0 | 982 | $1,500 | $1.53 | 25d | 1 | 0.30mi |
| 1225 Newark Dr Saint Louis, MO | 3.0 | 2.0 | 944 | $1,400 | $1.48 | 5d | 1 | 0.38mi |
| 2056 Coleridge Dr Saint Louis, MO | 3.0 | 1.0 | 949 | $1,195 | $1.26 | 25d | 1 | 0.65mi |
| 2056 Coleridge Dr Saint Louis, MO | 3.0 | 1.0 | 949 | $1,195 | $1.26 | 0d | 1 | 0.65mi |
| 2152 Nemnich Rd Saint Louis, MO | 2.0 | 1.5 | 1030 | $1,100 | $1.07 | 45d | 1 | 0.69mi |
| 9723 Portage Dr Saint Louis, MO | 3.0 | 1.0 | 1014 | $1,450 | $1.43 | 9d | 1 | 0.72mi |
| 7 Lamar Dr Saint Louis, MO | 3.0 | 1.0 | 894 | $1,200 | $1.34 | 19d | 1 | 0.78mi |
| 9744 Lanier Dr Saint Louis, MO | 3.0 | 1.0 | 1014 | $1,345 | $1.33 | 45d | 1 | 0.79mi |
| 8817 Shady Grove Ave Saint Louis, MO | 2.0 | 1.0 | 1085 | $1,075 | $0.99 | 25d | 1 | 0.83mi |
| 3 Pohlman Ln Saint Louis, MO | 2.0 | 1.0 | 704 | $1,000 | $1.42 | 18d | 1 | 0.91mi |
| 956 Fontaine Pl Saint Louis, MO | 2.0 | 2.0 | 1192 | $1,400 | $1.17 | 25d | 1 | 1.02mi |
| 9908 Norbridge Ln Saint Louis, MO | 2.0 | 2.0 | 1240 | $1,650 | $1.33 | 21d | 1 | 1.04mi |
| 2321 Noll Dr Saint Louis, MO | 3.0 | 1.0 | 975 | $1,320 | $1.35 | 25d | 1 | 1.05mi |
| 2155 Hecht Ave St. Louis, MO | 1.0–2.0 | 1.0 | 673 | $1,157 | $1.72 | 0d | 23 | 1.05mi |
| 960 Raford Ct St. Louis, MO | 2.0 | 1.0 | 750 | $950 | $1.27 | 25d | 1 | 1.05mi |
| 2022 McLaran Ave Saint Louis, MO | 3.0 | 2.0 | 1181 | $1,543 | $1.31 | 0d | 1 | 1.08mi |
| 2008 Kappel Dr Saint Louis, MO | 3.0 | 1.0 | 858 | $1,175 | $1.37 | 25d | 1 | 1.09mi |
| 8828 Riverview Blvd Apt 2S St. Louis, MO | 1.0 | 1.0 | 816 | $850 | $1.04 | 45d | 1 | 1.09mi |
| 2415 Shirley Ave Saint Louis, MO | 3.0 | 1.0 | 990 | $1,450 | $1.46 | 25d | 1 | 1.10mi |
| 1942 Damato Ct Saint Louis, MO | 2.0 | 1.0 | 905 | $1,100 | $1.22 | 45d | 1 | 1.13mi |
| 1942 Damato Ct Saint Louis, MO | 2.0 | 1.0 | 905 | $1,100 | $1.22 | 0d | 1 | 1.13mi |
| 1130 Forest Home Dr Saint Louis, MO | 3.0 | 1.0 | 1025 | $1,275 | $1.24 | 45d | 1 | 1.14mi |
| 2326 Chambers Rd Saint Louis, MO | 2.0 | 1.0 | 1056 | $1,050 | $0.99 | 25d | 1 | 1.17mi |
| 2427 Switzer Ave Saint Louis, MO | 3.0 | 1.0 | 1008 | $1,300 | $1.29 | 45d | 1 | 1.17mi |
| 2257 Chambers Rd Saint Louis, MO | 3.0 | 1.0 | 1200 | $1,400 | $1.17 | 25d | 1 | 1.17mi |
| 2617 Hord Ave Saint Louis, MO | 2.0 | 1.0 | 800 | $775 | $0.97 | 6d | 1 | 1.17mi |
| 8527 Dianthus Ln Saint Louis, MO | 3.0 | 1.0 | 976 | $1,295 | $1.33 | 45d | 1 | 1.20mi |
| 8908 Scottdale Ave Jennings, MO | 2.0 | 1.0 | 790 | $1,000 | $1.27 | 45d | 1 | 1.23mi |
| 2527 Switzer Ave Saint Louis, MO | 3.0 | 1.0 | 888 | $1,135 | $1.28 | 18d | 1 | 1.23mi |
| 849 River Trail Ct #102 St. Louis, MO | 1.0 | 1.0 | 700 | $825 | $1.18 | 25d | 1 | 1.23mi |
| 849 River Trail Ct Apt 201 St. Louis, MO | 1.0 | 1.0 | 700 | $825 | $1.18 | 45d | 1 | 1.23mi |
| 9709 Balboa Dr Saint Louis, MO | 3.0 | 1.0 | 1000 | $1,600 | $1.60 | 45d | 1 | 1.25mi |
| 8502 Dianthus Ln Saint Louis, MO | 2.0 | 1.0 | 1072 | $1,175 | $1.10 | 25d | 1 | 1.26mi |
| 605 Fremont Ave Saint Louis, MO | 2.0 | 1.0 | 750 | $995 | $1.33 | 45d | 1 | 1.28mi |
| 9547 Glen Owen Dr Saint Louis, MO | 2.0 | 1.0 | 923 | $985 | $1.07 | 25d | 1 | 1.30mi |
| 9823 Winkler Dr Saint Louis, MO | 2.0 | 1.0 | 788 | $900 | $1.14 | 0d | 1 | 1.31mi |
| 9823 Winkler Dr Saint Louis, MO | 2.0 | 1.0 | 788 | $900 | $1.14 | 45d | 1 | 1.31mi |
| 9827 Winkler Dr Saint Louis, MO | 3.0 | 1.0 | 864 | $1,450 | $1.68 | 9d | 1 | 1.32mi |
| 8344 Eton Pl Saint Louis, MO | 2.0 | 1.0 | 750 | $895 | $1.19 | 6d | 1 | 1.33mi |
| 8347 Eton Pl Saint Louis, MO | 2.0 | 1.0 | 750 | $1,075 | $1.43 | 0d | 1 | 1.33mi |
HOA detail
- Monthly dues
- $150 · $1,800/yr
Listing history 14 events
-
2026-06-21days on market $130,000 Active 24 DOM
-
2026-06-18days on market $130,000 Active 21 DOM
-
2026-06-17days on market $130,000 Active 20 DOM
-
2026-06-16days on market $130,000 Active 19 DOM
-
2026-06-15days on market $130,000 Active 18 DOM
-
2026-06-13days on market $130,000 Active 16 DOM
-
2026-06-09days on market $130,000 Active 12 DOM
-
2026-06-08days on market $130,000 Active 11 DOM
-
2026-06-07days on market $130,000 Active 10 DOM
-
2026-06-03days on market $130,000 Active 6 DOM
-
2026-06-02days on market $130,000 Active 5 DOM
-
2026-06-01days on market $130,000 Active 4 DOM
-
2026-05-31days on market $130,000 Active 3 DOM
-
2026-05-28$130,000 Active
ⓘ Source: listings_history table (triggers on properties + properties_extension) + one-shot
backfill from property_details.listing_events for pre-trigger history.
Tax reassessment forecast MO · Resets to sale price
- Current annual tax
- $2,335 · $195/mo
- Projected year-2 tax
- $2,335 · $195/mo
- Expected delta
- $0/yr ($0/mo · 0.0%)
ⓘ Screening estimate from a state-policy table — verify with the county assessor before closing.
Climate risk First Street
- Flood 1/10 Low FEMA zone X (unshaded) · 0% chance over 30 yrs
- Wildfire 1/10 Low
- Heat 5/10 Major 7 d/yr ≥107°F today · 21 d/yr by 30 yrs out
- Wind 2/10 Low 100% chance of damaging wind over 30 yrs
- Air quality 4/10 Moderate 5 unhealthy d/yr today · 6 by 30 yrs out
Nearby sold comps map
Loading sold comps map…
Walkable amenities ~0.75 mi
Loading nearby amenities…
Taxation est. · year 1
- Rental income
- $14,758
- − Mortgage interest
- −$7,282
- − Property taxes
- −$2,335
- − Insurance
- −$650
- − Repairs & maintenance
- −$1,181
- − Management
- −$1,181
- − HOA
- −$1,800
- − Depreciation
- −$3,782
- Taxable loss
- −$3,452
- Est. tax savings @ 24.0%
- +$828
- After-tax cash flow
- $-478/yr
For passive investors: Depreciation is non-cash, so a rental often shows a tax loss while cash-flowing — sheltering income. Rental losses are passive: they offset passive income freely, and up to $25,000/yr can offset ordinary (W-2) income if you actively participate and your MAGI is under $100k (phasing out to $0 by $150k); unused losses carry forward. On sale, claimed depreciation is recaptured at up to 25%, and gains may owe capital-gains tax (a 1031 exchange can defer both). Figures are a year-1 estimate at your 24.0% rate — not tax advice; consult a CPA.
Schools (NCES district)
- District
- Jennings
- NCES district ID
- 2916290
- Math proficiency
- 8% ▼ -16.00%
- Reading proficiency
- 20% ▼ -4.00%
- Median HH income
- $30,595
- Composite
- 11.04/100
- National rank
- #9739
- State rank
- #315 of 324 in MO
Livability — Jennings
- Score
- 67/100
- State rank
- #208
- US rank
- #10499
Category grades
Schools grade is shown separately in the Schools card above.
Census & demographics
- Census place
- Jennings, MO
- County
- Saint Louis County · 888,823 people
- Metro
- St. Louis, MO-IL
- Population (ZIP)
- 40,929
- Household income
- $41,154
- Rent vs Own
- Severe rent burden
- 3085.0
Population outlook (St. Louis County) Hauer SSP2
- Today (2025)
- 1,025,227 people
- By 2030
- 1,028,023 · +0.3%
- By 2040
- 1,020,940 · -0.4%
- By 2050
- 1,007,280 · -1.8%
- By 2075
- 987,277 · -3.7%
- By 2100
- 921,984 · -10.1%
Race, ethnicity, and origin ACS 2023
- Neighborhood character
- Predominantly Black (90%)
- Race & ethnicity
- Black 90% White 5% Two or more races 3%
- Foreign-born
- 1% · Canada
Political lean MEDSL · St. Louis
- 2024 margin
- Strong D (+23.4) · D 60.8% · R 37.4% · Other 1.7%
- 2008→2024 swing
- +3.5pp toward D · 2008: 19.9pp · 2024: 23.4pp
- All cycles
- 2024: D+23.4 2020: D+24.0 2016: D+16.2 2012: D+13.7 2008: D+19.9
Not yet ingested
- Civics
- —
Market trends
- HPI YoY
- ▲ 3.79%
- Current HPI
- 420.28
- Rent YoY
- ▲ 4.97%
- Metro
- St. Louis, MO-IL
- State GDP YoY
- ▲ 1.84%
- F500 in state
- 20
Industry mix (Fortune 500 HQ in MO)
| Industry | F500 HQs | Revenue |
|---|---|---|
| Healthcare | 1 | $163B |
|
||
| Insurance | 1 | $21B |
|
||
| Industrial Technology | 1 | $17B |
|
||
| Retail | 1 | $16B |
|
||
| Industrial Distribution | 1 | $10B |
|
||
| Utilities | 1 | $9B |
|
||
Price history
1 event — show timeline
- 2026-05-28 Listed $130,000 MARIS as Distributed by MLS Grid
Property tax history
+1.3%/yrLatest (2022): $2,335 · +1.5% YoY. Source: county tax records.
Cash-flow waterfall
monthlySold comps — $/sqft
last 12 mo · ≤1 miLoading sold comps…