 Duplex
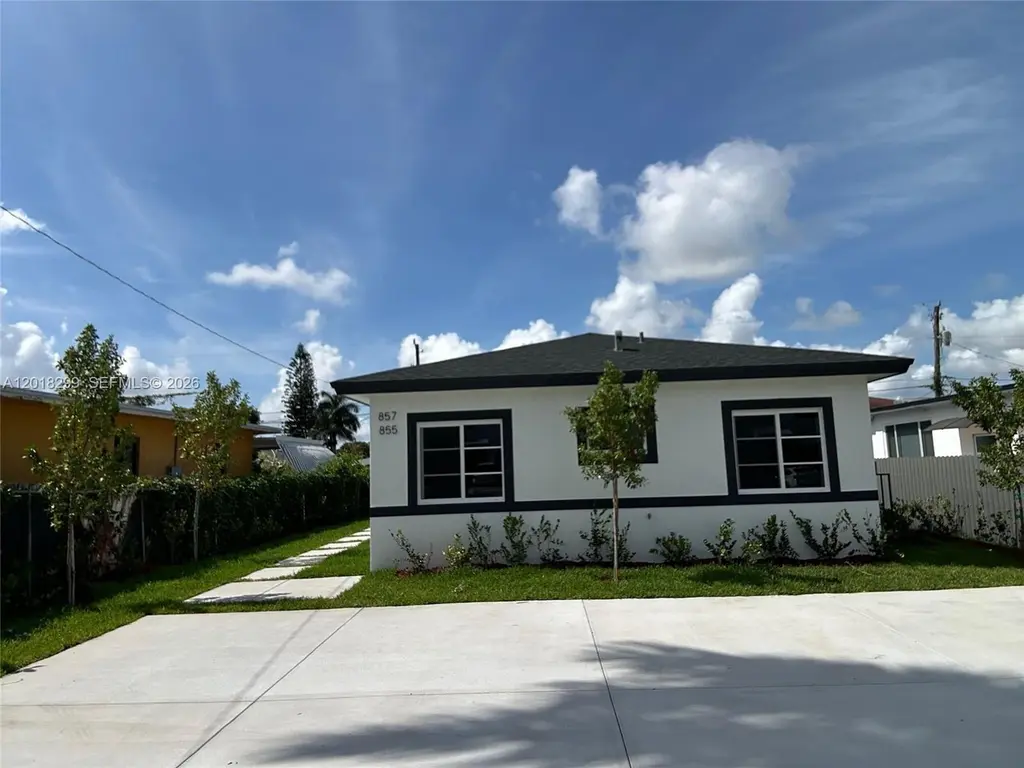
855-857 SW 1 St · Miami, FL
Flood risk 1/10 · Minimal
- FEMA flood zone
- X (unshaded)
- Chance of flooding over 30 yrs
- 0.0%
- Est. flood insurance / yr
- $507 – $1,088
Fire risk 1/10 · Minimal
- Est. fire insurance / yr
- $947 – $1,759
Heat risk 10/10 · Severe
- Hot days now (above 103°F)
- 7 days/yr
- Hot days in 30 yrs
- 31 days/yr
Wind risk 10/10 · Severe
- Chance of severe wind over 30 yrs
- 99.0%
Air-quality risk 2/10 · Minimal
- Unhealthy air days now
- 1 days/yr
- Unhealthy air days in 30 yrs
- 1 days/yr
Risk factors via First Street. Map © Google.
Why this score? — see what drove the C- grade
The composite is a weighted blend of 9 inputs, each scored 0–100. Each bar is that input's sub-score; the figure is the points it added to the 100-point composite (weight × sub-score).
- Cash flow +15.0/30.0
- ARV discount +7.5/15.0
- 1% rule +5.0/10.0
- DSCR +5.0/10.0
- Schools +4.2/10.0
- Appreciation +4.1/10.0
- Condition / age +4.0/5.0
- Livability +3.9/5.0
- Rent growth +2.4/5.0
$694,900
🖨 Deal sheet 📄 Offer letter ✓ Due diligence
Multi-family units
County records classify this as Multi-Family (2-4 Unit). Listing-text estimate: 2 units. confirmed
Listing remarks
New Construction Duplex in the growing area of Florida City and Redlands! This modern CBS-built property features impact-resistant windows, concrete driveway with 2-car parking, upscale finishes, and a comfortable living space. Each unit offers contemporary finishes and functional layouts ideal for homeowners or investors seeking strong rental potential. With no flood insurance currently required and conveniently situated near major highways, shopping, dining, schools, and the Florida Keys corridor. Excellent opportunity for multi-generational living, and income-producing investment.
Key facts
- Upscale finishes
- Functional layouts
- Concrete driveway
Tags
Property features AI
Finance
- Other: Annual tax amount listed
- Financial info: Rent includes trash collection
Exterior
- Parking: 4 parking spaces
- Utilities: Cable available; Public sewer
- Home design: Single-story; New construction
- Construction: Block construction; Shingle roof; Built as new construction
- Exterior features: Lot smaller than a quarter acre; Zoning: 5700
Interior
- Flooring: Tile
- Heating & cooling: Central heating; Central air conditioning
- Interior features: Tile flooring
Neighborhood map
What this means for you Summary
Snapshot
- This is a 2 × 2-bed/2-bath units multifamily listed at $695k. Condition is rated good.
Deal economics
- At list price, monthly cash flow is $25k ($300k/yr) — positive. Per door: $12k/mo.
- The deal already cash-flows at list — no discount required.
- Meets the 1% rule at list price ($38k rent vs $695k).
- Recommended offer: $684k (1.5% below list) — sets the bar for market timing.
- Cap rate 49.4% vs local median 1.9% in Miami — top-decile yield for the area; either an underpriced asset or a hidden risk that comps aren't pricing in. Stress-test before assuming the spread holds.
Location & tenants
- Location reads 78/100 on livability (#177 in FL, #2,724 nationally) — a middle-class / working-renter tenant base. Strengths: amenities A+, commute A+, health & safety A+; Watch: employment C-, crime F, cost of living F.
- Miami-Dade (suburban): math 45% / reading 54% proficiency, ranked #40 of 73 in FL (top 55%) — families likely to look elsewhere, expect single-tenant / working-renter base with shorter leases; 64% free/reduced lunch — lower-income household profile, screen leases tightly.
- Market conditions: Rents soft (-0.5%/yr); 639 active listings in the ZIP; 23 comparable units currently listed for rent nearby; rentals at typical pace (median 21d on market — plan ~3-4 weeks tenant-placement turnaround); 10,051 units permitted in Miami-Dade County in 2024 (7,758 in 5+ unit buildings).
- At $37,700/mo this rent would consume 742% of the median local household income ($61k/yr) (locally 5231% of renters already pay >50% of income on rent) — very limited rent-growth headroom before tenants either downsize or default.
Forward outlook
- Local home prices are declining (-1.8%/yr); year-one equity from $5k of loan paydown is wiped out by about $12k of value loss. Plan a longer hold.
- Miami-Dade County population projected at +28% by 2050 — long-run rental-demand tailwind backs the buy-and-hold thesis.
- At projected returns (-1.8% appreciation + 0.0% rent growth), your $195k cash investment doubles in ~1 year — after that, you're playing with house money.
Negotiation context
- It's been on market 27 days — a 2% lower offer ($684k) is reasonable based on typical stale-listing flexibility.
Risks & watch-outs
- Climate carrying-cost: severe wind risk, 99% chance of damaging wind over 30y; extreme-heat days projected 7→31/yr by 2055 (HVAC capex compounding) — expect insurance premiums to compound above CPI over the hold.
Questions for the listing agent
- Can we see the unit-by-unit rent roll, current vacancy, and any below-market leases? What's the average tenancy length?
- What capital expenditures (roof, boiler, parking lot, exteriors) have been made in the last 5 years, and what's planned in the next 2?
- Is there a deadline driving the sale (1031 exchange, divorce, estate, relocation)? That informs how much negotiation room exists.
- Schools are B-rated — typically a magnet for longer-tenancy family renters. What's the average tenant stay here, and is there a school-zone premium baked into asking?
- Crime grade is F in this area — have there been break-ins, vandalism, or insurance claims at this property in the last 3 years? What carrier currently insures it and at what premium?
- What's the average days-on-market for RENTAL listings here right now (not sales)? A rising rental-DOM trend means longer vacancies and softer asking-rent achievability than the comps imply.
- What's the recent tenant-quality profile in this submarket — average credit score on applications, eviction rate, late-payment / NSF rate, and stable-employment percentage? A property-management company in the area should have these aggregated.
- How much new apartment / multifamily construction is in the pipeline within 1–3 miles? Heavy new supply (>2% of stock underway) typically softens rents 12–24 months out; light construction supports rent growth.
Investment metrics
- 1% rule
- 5.43% ✓
- Cap rate
- 49.43%
- Cash-on-cash
- 154.07%
- DSCR
- 7.86
- GRM
- 1.5
CMA / ARV
No comps found within radius.
Show comp detail 3 sales within ~0.75 mi
| Address | Dist | Beds/Ba | Sqft | Sold | Price | $/sf | Match |
|---|---|---|---|---|---|---|---|
| 219 NW 10th Ave | 0.69mi | —/— | 3,240 | 3mo | $1,100,000 | $340 | 53 |
| 444 SW 26th Rd | 0.69mi | 4/3.0 | 1,812 | 11mo | $1,230,000 | $679 | 46 |
| 1362 SW 2nd St | 0.72mi | 26/21.0 | 8,019 | 10mo | $3,700,000 | $461 | 46 |
Match score weights: distance 35% · size 25% · config 20% · recency 20%. Top-matched comps best support the ARV.
Projected returns pro-forma
-1.79% appreciation · 0.0% rent growth · sell at horizon
- IRR
- —
- Equity multiple
- 8.22×
- Total profit
- $1,404,394
- Equity at exit
- $141,781
- IRR
- —
- Equity multiple
- 15.80×
- Total profit
- $2,879,315
- Equity at exit
- $127,733
Cash invested: $194,572 (down + closing). Projections, not guarantees.
Landlord ↔ Tenant lean methodology
- Overall (STATE)
- 87 Strongly Landlord-Friendly
- State Florida
- 87 Strongly Landlord-Friendly · R+3
- County
- — inherits STATE
- City
- — inherits STATE
ZIP-level market 33130
- Home prices YoY
- -0.5%
- Rents YoY
- -0.5%
- Active inventory
- 639
- Price-to-rent
- 3.1×
Monthly cashflow live
- Estimated rent
- $37,700 high interval (Pro) →
- Mortgage (P&I)
- −$3,644
- Tax est. 1.5%
- −$869 /mo · $10,424/yr
- Insurance
- −$290
- HOA
- −$0
- Vacancy / Maint / Mgmt
- −$7,917
- Net cashflow
- $24,981
Break-even live
2-unit breakdown (identical units grouped — click to expand)
| Units | Beds | Baths | Est. rent |
|---|---|---|---|
| 2× units | 2 | 2 | $37,700 |
| #1 | 2 | 2 | $18,850 |
| #2 | 2 | 2 | $18,850 |
| Total (2 units) | $37,700 | ||
UW: 25.0% down · 7.5% · 30yr · 1.5% tax · 5.0% vac · 8.0% maint · 8.0% mgmt
Financing live
Cash to close
- Down payment
- $173,725
- Closing costs
- $20,847
- Reserves months
- —
- Total cash needed
- —
Loan-product check · same deal, 3 products live
Conventional
25% down · 7.5% · 30yr
- Down + closing
- —
- Monthly P&I
- —
- Monthly cashflow
- —
- DSCR
- —
- Eligible?
- —
Personal DTI + credit; lowest rate.
DSCR
20% down · 8.5% · 30yr
- Down + closing
- —
- Monthly P&I
- —
- Monthly cashflow
- —
- DSCR
- —
- Eligible?
- —
No personal income docs; deal must DSCR.
Hard money
10% down · 12.0% · 12mo
- Down + closing
- —
- Monthly P&I
- —
- Monthly cashflow
- —
- DSCR
- —
- Eligible?
- —
Short-term bridge; refi at stabilization.
Rent comps 23 comps
| Address | Beds | Baths | Sqft | Rent | $/sqft | DOM | Units | Dist |
|---|---|---|---|---|---|---|---|---|
| 90 SW 3rd St #12 Miami, FL | 3.0 | 3.5 | 2418 | $18,000 | $7.44 | 4d | 1 | 0.77mi |
| 1000 Brickell Plz Miami, FL | 3.0–6.0 | 4.5–5.5 | 3795 | $18,000 | $4.74 | 3d | 2 | 0.91mi |
| 1000 Brickell Plz Miami, FL | 3.0–6.0 | 3.5–5.5 | 3486 | $22,000 | $6.31 | 24d | 2 | 0.91mi |
| 1000 Brickell Plz Miami, FL | 3.0–6.0 | 3.5–5.5 | 3692 | $19,800 | $5.36 | 10d | 2 | 0.91mi |
| 481 Brickell Ave Unit 1520375P Miami, FL | 1.0 | 1.0 | — | $19,125 | — | 24d | 1 | 1.08mi |
| 200 Biscayne Boulevard Way #5001 Miami, FL | 3.0 | 3.5 | 2457 | $20,000 | $8.14 | 24d | 1 | 1.15mi |
| 300 Biscayne Boulevard Way #3604 Miami, FL | 3.0 | 5.5 | 3536 | $37,000 | $10.46 | 22d | 1 | 1.22mi |
| 300 Biscayne Boulevard Way Unit 1902E Miami, FL | 3.0 | 3.5 | 2220 | $18,000 | $8.11 | 3d | 1 | 1.24mi |
| 300 Biscayne Boulevard Way #4404 Miami, FL | 3.0 | 5.5 | 3536 | $34,000 | $9.62 | 24d | 1 | 1.24mi |
| 300 Biscayne Boulevard Way Unit 3203 Miami, FL | 3.0 | 4.5 | 3078 | $32,000 | $10.40 | 24d | 1 | 1.24mi |
| 300 Biscayne Boulevard Way Unit 2802E Miami, FL | 3.0 | 3.5 | 2220 | $21,000 | $9.46 | 24d | 1 | 1.24mi |
| 300 Biscayne Boulevard Way Unit 4007W Miami, FL | 3.0 | 3.0 | 2126 | $19,000 | $8.94 | 24d | 1 | 1.24mi |
| 300 Biscayne Boulevard Way Unit 4502E Miami, FL | 3.0 | 3.5 | 2220 | $25,000 | $11.26 | 20d | 1 | 1.24mi |
| 300 Biscayne Boulevard Way #2306 Miami, FL | 3.0 | 3.0 | 1600 | $19,000 | $11.88 | 11d | 1 | 1.24mi |
| 175 SE 25th Rd #3403 Miami, FL | 3.0 | 3.5 | 1946 | $21,000 | $10.79 | 14d | 1 | 1.27mi |
| 175 SE 25th Rd Apt 602 Miami, FL | 3.0 | 3.5 | 2105 | $20,000 | $9.50 | 24d | 1 | 1.28mi |
| 175 SE 25th Rd #3303 Miami, FL | 3.0 | 3.5 | — | $27,500 | — | 2d | 1 | 1.28mi |
| 175 SE 25th Rd Unit 901 Miami, FL | 3.0 | 3.5 | — | $18,500 | — | 5d | 1 | 1.28mi |
| 175 SE 25th Rd Unit 1904 Miami, FL | 3.0 | 3.5 | 1946 | $18,900 | $9.71 | 16d | 1 | 1.28mi |
| 175 SE 25th Rd Unit 3104 Miami, FL | 3.0 | 3.5 | 1946 | $25,000 | $12.85 | 24d | 1 | 1.28mi |
| 175 SE 25th Rd #3303 Miami, FL | 3.0 | 3.5 | — | $27,500 | — | 24d | 1 | 1.28mi |
| 175 SE 25th Rd Unit 901 Miami, FL | 3.0 | 3.5 | — | $18,500 | — | 14d | 1 | 1.28mi |
| 175 SE 25th Rd Unit 3104 Miami, FL | 3.0 | 3.5 | 1946 | $25,000 | $12.85 | 7d | 1 | 1.28mi |
Listing history 14 events
-
2026-06-18days on market $694,900 Active 27 DOM
-
2026-06-17days on market $694,900 Active 26 DOM
-
2026-06-16days on market $694,900 Active 25 DOM
-
2026-06-15days on market $694,900 Active 24 DOM
-
2026-06-13days on market $694,900 Active 22 DOM
-
2026-06-09days on market $694,900 Active 18 DOM
-
2026-06-08days on market $694,900 Active 17 DOM
-
2026-06-07days on market $694,900 Active 16 DOM
-
2026-06-04days on market $694,900 Active 13 DOM
-
2026-06-03days on market $694,900 Active 12 DOM
-
2026-06-02days on market $694,900 Active 11 DOM
-
2026-06-01days on market $694,900 Active 10 DOM
-
2026-05-31days on market $694,900 Active 9 DOM
-
2026-05-13$699,900 Active
ⓘ Source: listings_history table (triggers on properties + properties_extension) + one-shot
backfill from property_details.listing_events for pre-trigger history.
Climate risk First Street
- Flood 1/10 Low FEMA zone X (unshaded) · 0% chance over 30 yrs
- Wildfire 1/10 Low
- Heat 10/10 Extreme 7 d/yr ≥103°F today · 31 d/yr by 30 yrs out
- Wind 10/10 Extreme 99% chance of damaging wind over 30 yrs
- Air quality 2/10 Low 1 unhealthy d/yr today · 1 by 30 yrs out
Nearby sold comps map
Loading sold comps map…
Walkable amenities ~0.75 mi
Loading nearby amenities…
Taxation est. · year 1
- Rental income
- $452,400
- − Mortgage interest
- −$38,925
- − Property taxes
- −$10,424
- − Insurance
- −$3,474
- − Repairs & maintenance
- −$36,192
- − Management
- −$36,192
- − Depreciation
- −$20,215
- Taxable income
- $306,978
- Est. tax owed @ 24.0%
- −$73,675
- After-tax cash flow
- $226,094/yr
For passive investors: Depreciation is non-cash, so a rental often shows a tax loss while cash-flowing — sheltering income. Rental losses are passive: they offset passive income freely, and up to $25,000/yr can offset ordinary (W-2) income if you actively participate and your MAGI is under $100k (phasing out to $0 by $150k); unused losses carry forward. On sale, claimed depreciation is recaptured at up to 25%, and gains may owe capital-gains tax (a 1031 exchange can defer both). Figures are a year-1 estimate at your 24.0% rate — not tax advice; consult a CPA.
Condition & rehab AI · 1 photo
This modern, newly constructed duplex is in excellent condition with no visible repairs needed. It offers a great opportunity for investors seeking strong rental potential.
Value-add opportunities
- Both Landscaping — Enhances curb appeal and adds value
- Both Interior paint — Fresh paint can make the interior look more inviting
- Both Landscaping around windows — Improves curb appeal and can increase property value
Renovation cost estimate screening
Value-add ROI direction
- Both Landscaping — Enhances curb appeal and adds value ↑
- Both Interior paint — Fresh paint can make the interior look more inviting ↑
- Both Landscaping around windows — Improves curb appeal and can increase property value ↑
ⓘ Cost ranges are severity-bucket heuristics (US national rule-of-thumb). Get contractor quotes + a written scope before underwriting a rehab budget.
Schools (NCES district)
- District
- Miami-Dade
- NCES district ID
- 1200390
- Math proficiency
- 45% ▼ -16.00%
- Reading proficiency
- 54% ▼ -5.00%
- Median HH income
- $43,928
- Composite
- 41.76/100
- National rank
- #3397
- State rank
- #40 of 73 in FL
Livability — Miami
- Score
- 78/100
- State rank
- #177
- US rank
- #2724
Category grades
Schools grade is shown separately in the Schools card above.
Census & demographics
- Census place
- Miami, FL
- County
- Miami-Dade County · 2,697,751 people
- City population
- 827,308
- Metro
- Miami-Fort Lauderdale-Pompano Beach, FL
- Population (ZIP)
- 34,964
- Household income
- $61,009
- Rent vs Own
- Severe rent burden
- 5231.0
Population outlook (Miami-Dade County) Hauer SSP2
- Today (2025)
- 3,126,439 people
- By 2030
- 3,325,765 · +6.4%
- By 2040
- 3,697,561 · +18.3%
- By 2050
- 4,012,134 · +28.3%
- By 2075
- 4,605,612 · +47.3%
- By 2100
- 4,866,598 · +55.7%
Race, ethnicity, and origin ACS 2023
- Neighborhood character
- Predominantly Hispanic (73%)
- Race & ethnicity
- Hispanic / Latino 73% Two or more races 44% White 17% Black 4% Asian 3%
- Hispanic origin (detail)
- Mexican 3% Puerto Rican 3% Cuban 24% Dominican 4%
- Common ancestry
- Romanian 2% Estonian 1% Lithuanian 1%
- Foreign-born
- 60% · Canada, Jamaica, Guatemala
- Languages at home
- 23% English-only · Spanish 70% Other Indo-European 2% Russian/Polish/Slavic 1%
Political lean MEDSL · Miami-Dade
- 2024 margin
- R (+11.4) · D 43.9% · R 55.4%
- 2008→2024 swing
- -27.6pp toward R · 2008: 16.1pp · 2024: -11.4pp
- All cycles
- 2024: R+11.4 2020: D+7.3 2016: D+29.6 2012: D+23.7 2008: D+16.1
Not yet ingested
- Civics
- —
Market trends
- HPI YoY
- ▼ -1.79%
- Current HPI
- 344.7752
- Rent YoY
- ▼ -0.53%
- Metro
- Miami-Fort Lauderdale-Pompano Beach, FL
- State GDP YoY
- ▲ 3.28%
- F500 in state
- 36
Industry mix (Fortune 500 HQ in FL)
| Industry | F500 HQs | Revenue |
|---|---|---|
| Industrial Technology | 2 | $29B |
|
||
| Insurance | 2 | $17B |
|
||
| Retail | 1 | $60B |
|
||
| Technology Distribution | 1 | $58B |
|
||
| Homebuilding | 1 | $35B |
|
||
| Technology Manufacturing | 1 | $35B |
|
||
Price history
1 event — show timeline
- 2026-05-13 Listed $699,900 MARMLS
Cash-flow waterfall
monthlySold comps — $/sqft
last 12 mo · ≤1 miLoading sold comps…