 10-Plex
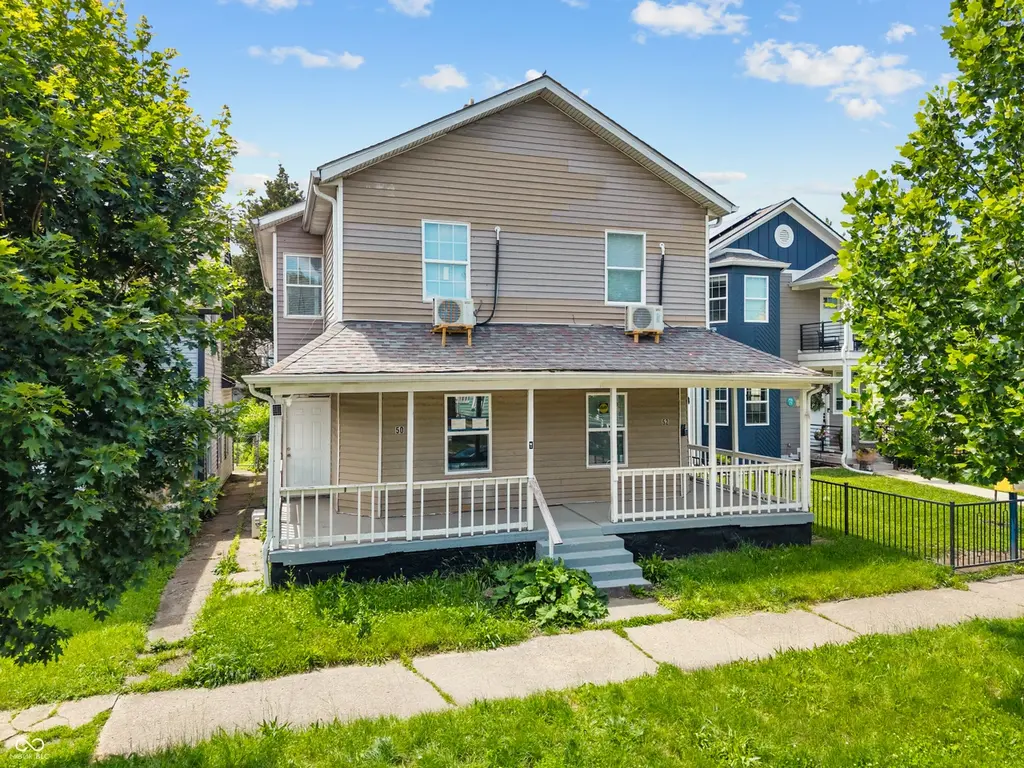
50 N Hamilton Ave · Indianapolis city (balance), IN
Flood risk 1/10 · Minimal
- FEMA flood zone
- X (unshaded)
- Chance of flooding over 30 yrs
- 0.0%
- Est. flood insurance / yr
- $473 – $860
Fire risk 1/10 · Minimal
- Est. fire insurance / yr
- $717 – $1,331
Heat risk 4/10 · Minor
- Hot days now (above 101°F)
- 7 days/yr
- Hot days in 30 yrs
- 19 days/yr
Wind risk 2/10 · Minimal
- Chance of severe wind over 30 yrs
- 0.0%
Air-quality risk 4/10 · Minor
- Unhealthy air days now
- 5 days/yr
- Unhealthy air days in 30 yrs
- 7 days/yr
Risk factors via First Street. Map © Google.
Why this score? — see what drove the C+ grade
The composite is a weighted blend of 9 inputs, each scored 0–100. Each bar is that input's sub-score; the figure is the points it added to the 100-point composite (weight × sub-score).
- Cash flow +30.0/30.0
- 1% rule +10.0/10.0
- DSCR +10.0/10.0
- Rent growth +4.3/5.0
- Livability +2.5/5.0
- Condition / age +2.5/5.0
- Schools +1.4/10.0
- ARV discount +0.0/15.0
- Appreciation +0.0/10.0
$450,000
🖨 Deal sheet 📄 Offer letter ✓ Due diligence
Multi-family units
County records classify this as Multi-Family (2-4 Unit). Listing-text estimate: 10 units. estimate disagrees with records
Listing remarks
Unique multifamily opportunity currently configured as 10 residential units, including 8 studio units and 2 one-bedroom units. All units are vacant, providing flexibility for a new owner's leasing and management plans. Recent improvements reportedly include new flooring and paint throughout, updated kitchen cabinets and countertops in select units, new interior and exterior doors, new windows, mini-split HVAC systems, water heater, plumbing fixtures, bathroom mirrors, and PEX plumbing. Property offers approximately 3,110 square feet above grade, plus basement areas. Buyer to independently verify square footage, unit count, zoning, permitted uses, room dimensions, and all information materia
Key facts
- Residential units
- New flooring
- New interior doors
Tags
Property features AI
Finance
- Other: Zoning: D5
- Financial info: Multi-unit property with 10 total units; Reported gross income: 0; Reported expenses: 0; Example unit rent shown: $890 monthly for a 1-level unit
Exterior
- Parking: Unpaved parking
- Utilities: No solid waste service indicated
- Home design: Residential income property; Duplex; Two levels; Conversion
- Construction: Lot approximately 0.12 acre
- Exterior features: Residential use; Access road
Interior
- Kitchen: Kitchen present in unit type (unit kitchens listed)
- Bedrooms: Unit types include one-level units
- Interior features: Has basement; Converted property
Neighborhood map
What this means for you Summary
Snapshot
- This is a 10 × 1-bed/1-bath units multifamily listed at $450k.
Deal economics
- At list price, monthly cash flow is $5k ($55k/yr) — positive. Per door: $459/mo.
- The deal already cash-flows at list — no discount required.
- Meets the 1% rule at list price ($10k rent vs $450k).
- Recommended offer: $443k (1.5% below list) — sets the bar for market timing.
- Cap rate 18.5% vs local median 4.4% in Indianapolis city (balance) — top-decile yield for the area; either an underpriced asset or a hidden risk that comps aren't pricing in. Stress-test before assuming the spread holds.
Location & tenants
- Location reads: area grade C — affects rentability + tenant quality, not the cash-flow math above.
- Indianapolis Public Schools (urban): math 14% / reading 20% proficiency, ranked #286 of 301 in IN (top 95%) — low school quality limits family demand, transient renter base, plan for 1-2y turnover; 77% free/reduced lunch — lower-income household profile, screen leases tightly.
- Market conditions: Rents rising fast (+7.3%/yr); 480 active listings in the ZIP; 40 comparable units currently listed for rent nearby; rentals lingering (median 44d on market — plan ~5-8 weeks vacancy on turnover, expect pricing pressure); 58% of comp listings sitting > 30 days — soft ceiling on asking rent; 1,906 units permitted in Marion County in 2024 (621 in 5+ unit buildings).
- At $9,843/mo this rent would consume 240% of the median local household income ($49k/yr) (locally 1906% of renters already pay >50% of income on rent) — very limited rent-growth headroom before tenants either downsize or default.
Forward outlook
- Local home prices are declining (-3.0%/yr); year-one equity from $3k of loan paydown is wiped out by about $14k of value loss. Plan a longer hold.
- Marion County population projected at +18% by 2050 — long-run rental-demand tailwind backs the buy-and-hold thesis.
- At projected returns (-3.0% appreciation + 7.3% rent growth), your $126k cash investment doubles in ~3 years — after that, you're playing with house money.
Negotiation context
- It's been on market 18 days — a 2% lower offer ($443k) is reasonable based on typical stale-listing flexibility.
- 9 sale attempts since 24y ago with the ask held roughly flat each time — persistent listings suggest the price (not the market) is what's stuck; bring a comps-based counter.
- Current owner paid $305k; 48% above their basis — modest negotiation headroom, anchor on the comps not their cost.
Questions for the listing agent
- Can we see the unit-by-unit rent roll, current vacancy, and any below-market leases? What's the average tenancy length?
- What capital expenditures (roof, boiler, parking lot, exteriors) have been made in the last 5 years, and what's planned in the next 2?
- Is there a deadline driving the sale (1031 exchange, divorce, estate, relocation)? That informs how much negotiation room exists.
- What's the average days-on-market for RENTAL listings here right now (not sales)? A rising rental-DOM trend means longer vacancies and softer asking-rent achievability than the comps imply.
- What's the recent tenant-quality profile in this submarket — average credit score on applications, eviction rate, late-payment / NSF rate, and stable-employment percentage? A property-management company in the area should have these aggregated.
- How much new apartment / multifamily construction is in the pipeline within 1–3 miles? Heavy new supply (>2% of stock underway) typically softens rents 12–24 months out; light construction supports rent growth.
Investment metrics
- 1% rule
- 2.19% ✓
- Cap rate
- 18.53%
- Cash-on-cash
- 43.72%
- DSCR
- 2.95
- GRM
- 3.8
CMA / ARV
- ARV (on-the-fly)
- $309,870
- Comps found
- 4
Show comp detail 4 sales within ~0.75 mi
| Address | Dist | Beds/Ba | Sqft | Sold | Price | $/sf | Match |
|---|---|---|---|---|---|---|---|
| 826 N Beville Ave | 0.67mi | 3/1.0 (+1) | 1,472 (-6%) | 1mo | $236,000 | $160 | 38 |
| 1920 E Washington St | 0.15mi | 3/2.0 (+1) | 1,350 (-14%) | 15mo | $267,500 | $198 | 37 |
| 771-773 Woodruff Place East Dr | 0.60mi | 2/2.0 | 1,556 (-1%) | 17mo | $375,000 | $241 | 37 |
| 245 S Rural St | 0.64mi | 1/2.0 (-1) | 1,400 (-10%) | 14mo | $110,000 | $79 | 22 |
Match score weights: distance 35% · size 25% · config 20% · recency 20%. Top-matched comps best support the ARV.
Projected returns pro-forma
-3.0% appreciation · 7.31% rent growth · sell at horizon
- IRR
- 45.5%
- Equity multiple
- 3.10×
- Total profit
- $264,160
- Equity at exit
- $67,096
- IRR
- 53.3%
- Equity multiple
- 7.41×
- Total profit
- $807,037
- Equity at exit
- $38,908
Cash invested: $126,000 (down + closing). Projections, not guarantees.
Landlord ↔ Tenant lean methodology
- Overall (STATE)
- 90 Strongly Landlord-Friendly
- State Indiana
- 90 Strongly Landlord-Friendly · R+11
- County
- — inherits STATE
- City
- — inherits STATE
ZIP-level market 46201
- Home prices YoY
- -33.9%
- Rents YoY
- 7.3%
- Active inventory
- 480
- Price-to-rent
- 38.1×
Monthly cashflow live
- Estimated rent
- $9,843 high interval (Pro) →
- Mortgage (P&I)
- −$2,360
- Tax from tax record
- −$638 /mo · $7,662/yr
- Insurance
- −$188
- HOA
- −$0
- Vacancy / Maint / Mgmt
- −$2,067
- Net cashflow
- $4,590
Break-even live
10-unit breakdown (identical units grouped — click to expand)
| Units | Beds | Baths | Est. rent |
|---|---|---|---|
| 10× units | 1 | 1 | $9,840 |
| #1 | 1 | 1 | $984 |
| #2 | 1 | 1 | $984 |
| #3 | 1 | 1 | $984 |
| #4 | 1 | 1 | $984 |
| #5 | 1 | 1 | $984 |
| #6 | 1 | 1 | $984 |
| #7 | 1 | 1 | $984 |
| #8 | 1 | 1 | $984 |
| #9 | 1 | 1 | $984 |
| #10 | 1 | 1 | $984 |
| Total (10 units) | $9,843 | ||
UW: 25.0% down · 7.5% · 30yr · 1.5% tax · 5.0% vac · 8.0% maint · 8.0% mgmt
Financing live
Cash to close
- Down payment
- $112,500
- Closing costs
- $13,500
- Reserves months
- —
- Total cash needed
- —
Loan-product check · same deal, 3 products live
Conventional
25% down · 7.5% · 30yr
- Down + closing
- —
- Monthly P&I
- —
- Monthly cashflow
- —
- DSCR
- —
- Eligible?
- —
Personal DTI + credit; lowest rate.
DSCR
20% down · 8.5% · 30yr
- Down + closing
- —
- Monthly P&I
- —
- Monthly cashflow
- —
- DSCR
- —
- Eligible?
- —
No personal income docs; deal must DSCR.
Hard money
10% down · 12.0% · 12mo
- Down + closing
- —
- Monthly P&I
- —
- Monthly cashflow
- —
- DSCR
- —
- Eligible?
- —
Short-term bridge; refi at stabilization.
Rent comps 40 comps
| Address | Beds | Baths | Sqft | Rent | $/sqft | DOM | Units | Dist |
|---|---|---|---|---|---|---|---|---|
| 22 Hendricks Pl Unit 22 Indianapolis, IN | 3.0 | 1.5 | 1730 | $1,600 | $0.92 | 17d | 1 | 0.07mi |
| 17 E Parkview Ave Unit 17 Indianapolis, IN | 3.0 | 1.5 | 1530 | $1,650 | $1.08 | 43d | 1 | 0.08mi |
| 17 E Parkview Ave Unit 19 Indianapolis, IN | 3.0 | 1.0 | 1530 | $1,650 | $1.08 | 43d | 1 | 0.08mi |
| 44 E Parkview Ave Unit A Indianapolis, IN | 3.0 | 2.0 | 1296 | $1,695 | $1.31 | 23d | 1 | 0.09mi |
| 44 E Parkview Ave Unit B Indianapolis, IN | 3.0 | 2.0 | 1297 | $1,695 | $1.31 | 43d | 1 | 0.09mi |
| 44 Parkview Ave Indianapolis, IN | 3.0 | 2.0 | 1250 | $1,695 | $1.36 | 20d | 1 | 0.09mi |
| 22 Parkview Ave Indianapolis, IN | 3.0 | 1.5 | 1728 | $1,450 | $0.84 | 7d | 1 | 0.10mi |
| 43 N Randolph St Indianapolis, IN | 3.0 | 2.0 | 1250 | $1,399 | $1.12 | 43d | 1 | 0.12mi |
| 17 N Randolph St Indianapolis, IN | 3.0 | 2.0 | 1822 | $2,075 | $1.14 | 4d | 1 | 0.13mi |
| 12 N Randolph St Indianapolis, IN | 3.0 | 1.0 | 1485 | $1,650 | $1.11 | 43d | 1 | 0.15mi |
| 41 Keystone Ave Indianapolis, IN | 3.0 | 2.5 | 1600 | $2,500 | $1.56 | 43d | 1 | 0.24mi |
| 43 Keystone Ave Indianapolis, IN | 3.0 | 2.5 | 1600 | $2,291 | $1.43 | 16d | 1 | 0.24mi |
| 47 Keystone Ave Indianapolis, IN | 3.0 | 2.5 | 1600 | $2,500 | $1.56 | 43d | 1 | 0.24mi |
| 303 N State Ave Indianapolis, IN | 3.0 | 1.0 | 1700 | $1,275 | $0.75 | 23d | 1 | 0.26mi |
| 416 N Hamilton Ave Unit 416-A Indianapolis, IN | 3.0 | 2.0 | 1350 | $1,500 | $1.11 | 43d | 1 | 0.29mi |
| 1541 E Ohio St Indianapolis, IN | 3.0 | 1.0 | 1400 | $1,399 | $1.00 | 43d | 1 | 0.32mi |
| 1534 E Ohio St Indianapolis, IN | 3.0 | 2.5 | 1204 | $1,650 | $1.37 | 16d | 1 | 0.33mi |
| 224 N Tacoma Ave Unit B TACOMA Indianapolis, IN | 1.0 | 1.0 | 1200 | $799 | $0.67 | 7d | 1 | 0.33mi |
| 228 N Tacoma Ave Indianapolis, IN | 3.0 | 1.0 | 1200 | $1,100 | $0.92 | 10d | 1 | 0.33mi |
| 1529 E Ohio St Indianapolis, IN | 2.0 | 1.0 | 1118 | $1,299 | $1.16 | 43d | 1 | 0.34mi |
| 39 N Tacoma Ave Indianapolis, IN | 3.0 | 1.0 | 1233 | $895 | $0.73 | 43d | 1 | 0.34mi |
| 2015 E Maryland St Indianapolis, IN | 3.0 | 2.0 | 1250 | $1,495 | $1.20 | 43d | 1 | 0.35mi |
| 151 Harlan St Unit A Indianapolis, IN | 3.0 | 2.0 | 1250 | $1,549 | $1.24 | 23d | 1 | 0.37mi |
| 117 N Arsenal Ave Indianapolis, IN | 3.0 | 2.0 | 1250 | $1,800 | $1.44 | 4d | 1 | 0.38mi |
| 115 N Arsenal Ave Indianapolis, IN | 3.0 | 2.0 | 1297 | $1,800 | $1.39 | 43d | 1 | 0.38mi |
| 119 N Arsenal Ave Indianapolis, IN | 3.0 | 2.0 | 1250 | $1,800 | $1.44 | 22d | 1 | 0.38mi |
| 119 N Arsenal Ave Unit 119 Indianapolis, IN | 3.0 | 2.0 | 1250 | $1,800 | $1.44 | 43d | 1 | 0.38mi |
| 117 N Arsenal Ave Unit 117 Indianapolis, IN | 3.0 | 2.0 | 1250 | $1,800 | $1.44 | 43d | 1 | 0.38mi |
| 101 N Arsenal Ave Indianapolis, IN | 3.0 | 2.0 | 1300 | $1,749 | $1.35 | 43d | 1 | 0.39mi |
| 1531 Sturm Ave Indianapolis, IN | 3.0 | 2.0 | 1806 | $1,515 | $0.84 | 23d | 1 | 0.43mi |
| 1529 Sturm Ave Indianapolis, IN | 3.0 | 2.0 | 1806 | $1,515 | $0.84 | 23d | 1 | 0.43mi |
| 1430 E Ohio St Indianapolis, IN | 3.0 | 1.5 | 2174 | $1,745 | $0.80 | 43d | 1 | 0.44mi |
| 2015 Southeastern Ave Unit 2015 Indianapolis, IN | 2.0 | 2.5 | 1350 | $2,200 | $1.63 | 23d | 1 | 0.44mi |
| 113 S Arsenal Ave Indianapolis, IN | 3.0 | 2.0 | 1296 | $1,800 | $1.39 | 43d | 1 | 0.45mi |
| 238 Eastern Ave Indianapolis, IN | 3.0 | 2.0 | 1850 | $1,900 | $1.03 | 23d | 1 | 0.46mi |
| 409 N Temple Ave Indianapolis, IN | 3.0 | 2.0 | 2106 | $1,650 | $0.78 | 43d | 1 | 0.49mi |
| 420 Eastern Ave Indianapolis, IN | 3.0 | 1.0 | 1900 | $1,325 | $0.70 | 43d | 1 | 0.53mi |
| 241 S Temple Ave Indianapolis, IN | 3.0 | 2.0 | 1200 | $1,350 | $1.12 | 43d | 1 | 0.54mi |
| 1404 E Vermont St Indianapolis, IN | 2.0 | 2.5 | 1353 | $1,950 | $1.44 | 43d | 1 | 0.55mi |
| 145 McKim Ave Indianapolis, IN | 3.0 | 2.5 | 1470 | $2,195 | $1.49 | 44d | 1 | 0.56mi |
Listing history 13 events
-
2026-06-18days on market $450,000 Active 18 DOM
-
2026-06-17days on market $450,000 Active 17 DOM
-
2026-06-16days on market $450,000 Active 16 DOM
-
2026-06-15days on market $450,000 Active 15 DOM
-
2026-06-13days on market $450,000 Active 13 DOM
-
2026-06-13days on market $450,000 Active 12 DOM
-
2026-06-09days on market $450,000 Active 9 DOM
-
2026-06-08days on market $450,000 Active 8 DOM
-
2026-06-07days on market $450,000 Active 7 DOM
-
2026-06-03days on market $450,000 Active 3 DOM
-
2026-06-02days on market $450,000 Active 2 DOM
-
2026-05-31remarks 699-char remark
-
2026-05-31$450,000 Active 1 DOM
ⓘ Source: listings_history table (triggers on properties + properties_extension) + one-shot
backfill from property_details.listing_events for pre-trigger history.
Tax reassessment forecast IN · Partial reset (capped growth)
- Current annual tax
- $7,662 · $638/mo
- Projected year-2 tax
- $7,662 · $638/mo
- Expected delta
- $0/yr ($0/mo · 0.0%)
ⓘ Screening estimate from a state-policy table — verify with the county assessor before closing.
Climate risk First Street
- Flood 1/10 Low FEMA zone X (unshaded) · 0% chance over 30 yrs
- Wildfire 1/10 Low
- Heat 4/10 Moderate 7 d/yr ≥101°F today · 19 d/yr by 30 yrs out
- Wind 2/10 Low 0% chance of damaging wind over 30 yrs
- Air quality 4/10 Moderate 5 unhealthy d/yr today · 7 by 30 yrs out
Nearby sold comps map
Loading sold comps map…
Walkable amenities ~0.75 mi
Loading nearby amenities…
Taxation est. · year 1
- Rental income
- $118,116
- − Mortgage interest
- −$25,207
- − Property taxes
- −$7,662
- − Insurance
- −$2,250
- − Repairs & maintenance
- −$9,449
- − Management
- −$9,449
- − Depreciation
- −$13,091
- Taxable income
- $51,008
- Est. tax owed @ 24.0%
- −$12,242
- After-tax cash flow
- $42,840/yr
For passive investors: Depreciation is non-cash, so a rental often shows a tax loss while cash-flowing — sheltering income. Rental losses are passive: they offset passive income freely, and up to $25,000/yr can offset ordinary (W-2) income if you actively participate and your MAGI is under $100k (phasing out to $0 by $150k); unused losses carry forward. On sale, claimed depreciation is recaptured at up to 25%, and gains may owe capital-gains tax (a 1031 exchange can defer both). Figures are a year-1 estimate at your 24.0% rate — not tax advice; consult a CPA.
Schools (NCES district)
- District
- Indianapolis Public Schools
- NCES district ID
- 1804770
- Math proficiency
- 14% ▼ -7.00%
- Reading proficiency
- 20% ▼ -3.00%
- Median HH income
- $32,034
- Composite
- 13.69/100
- National rank
- #9499
- State rank
- #286 of 301 in IN
Livability — Indianapolis city (balance)
No livability data for this city. (Only ~50 U.S. cities are tracked.)
Census & demographics
- Census place
- Indianapolis city (balance), IN
- County
- Marion County · 998,460 people
- City population
- 881,119
- Metro
- Indianapolis-Carmel-Anderson, IN
- Population (ZIP)
- 30,335
- Household income
- $49,195
- Rent vs Own
- Severe rent burden
- 1906.0
Population outlook (Marion County) Hauer SSP2
- Today (2025)
- 1,025,572 people
- By 2030
- 1,065,727 · +3.9%
- By 2040
- 1,141,577 · +11.3%
- By 2050
- 1,208,920 · +17.9%
- By 2075
- 1,367,288 · +33.3%
- By 2100
- 1,438,201 · +40.2%
Race, ethnicity, and origin ACS 2023
- Neighborhood character
- Diverse neighborhood (Simpson 0.63)
- Race & ethnicity
- White 53% Hispanic / Latino 23% Black 18% Two or more races 9%
- Hispanic origin (detail)
- Mexican 14% Puerto Rican 2%
- Common ancestry
- Slovak 2% Lithuanian 2% Italian 1%
- Foreign-born
- 9% · Canada
- Languages at home
- 81% English-only · Spanish 17%
Political lean MEDSL · Marion
- 2024 margin
- Strong D (+27.7) · D 63.0% · R 35.3% · Other 1.7%
- 2008→2024 swing
- -0.7pp no change · 2008: 28.4pp · 2024: 27.7pp
- All cycles
- 2024: D+27.7 2020: D+29.1 2016: D+22.8 2012: D+22.2 2008: D+28.4
Not yet ingested
- Civics
- —
Market trends
- HPI YoY
- ▼ -192.51%
- Current HPI
- 375.0969
- Rent YoY
- ▲ 7.31%
- Metro
- Indianapolis-Carmel-Anderson, IN
- State GDP YoY
- ▲ 2.90%
- F500 in state
- 18
Industry mix (Fortune 500 HQ in IN)
| Industry | F500 HQs | Revenue |
|---|---|---|
| Industrial Machinery | 2 | $37B |
|
||
| Healthcare | 1 | $177B |
|
||
| Pharmaceuticals | 1 | $45B |
|
||
| Metals / Steel | 1 | $18B |
|
||
| Agriculture | 1 | $17B |
|
||
| Packaging | 1 | $12B |
|
||
Price history
+2161.3% since first listed25 events — show timeline
- 2026-05-31 Listed $450,000 MIBOR as Distributed by MLS Grid
- 2024-08-01 Sold (Public Records) $305,000 Public Records
- 2024-04-28 Pending — MIBOR as Distributed by MLS Grid
- 2024-04-25 Listing Removed — MIBOR as Distributed by MLS Grid
- 2024-04-15 Price Changed $389,000 MIBOR as Distributed by MLS Grid
- 2024-04-01 Price Changed $399,000 MIBOR as Distributed by MLS Grid
- 2024-03-12 Relisted — MIBOR as Distributed by MLS Grid
- 2024-03-12 Price Changed $415,000 MIBOR as Distributed by MLS Grid
- 2024-02-26 Pending — MIBOR as Distributed by MLS Grid
- 2024-01-13 Relisted — MIBOR as Distributed by MLS Grid
- 2024-01-12 Listing Removed — MIBOR as Distributed by MLS Grid
- 2024-01-04 Relisted — MIBOR as Distributed by MLS Grid
- 2023-12-31 Listing Removed — MIBOR as Distributed by MLS Grid
- 2023-08-28 Price Changed $465,000 MIBOR as Distributed by MLS Grid
- 2023-07-14 Listed $480,000 MIBOR as Distributed by MLS Grid
- 2023-05-11 Pending — MIBOR as Distributed by MLS Grid
- 2023-05-09 Listing Removed — MIBOR as Distributed by MLS Grid
- 2023-04-25 Price Changed $480,000 MIBOR as Distributed by MLS Grid
- 2023-03-30 Listed $560,000 MIBOR as Distributed by MLS Grid
- 2005-07-08 Sold (MLS) $57,700 MIBOR as Distributed by MLS Grid
- 2005-04-15 Listed $62,500 MIBOR as Distributed by MLS Grid
- 2004-02-08 Listing Removed — MIBOR as Distributed by MLS Grid
- 2003-06-10 Listed $107,000 MIBOR as Distributed by MLS Grid
- 2002-08-27 Sold (MLS) $18,000 MIBOR as Distributed by MLS Grid
- 2002-03-18 Listed $19,900 MIBOR as Distributed by MLS Grid
Property tax history
+17.2%/yrLatest (2025): $7,662 · -10.8% YoY. Source: county tax records.
Cash-flow waterfall
monthlySold comps — $/sqft
last 12 mo · ≤1 miLoading sold comps…