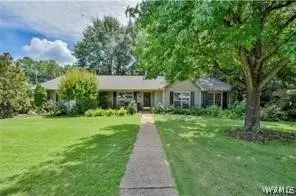
1709 21st St E · Tuscaloosa, AL
Flood risk 1/10 · Minimal
- FEMA flood zone
- X (unshaded)
- Chance of flooding over 30 yrs
- 0.0%
- Est. flood insurance / yr
- $507 – $1,088
Fire risk 1/10 · Minimal
- Est. fire insurance / yr
- $916 – $1,700
Heat risk 7/10 · Major
- Hot days now (above 107°F)
- 7 days/yr
- Hot days in 30 yrs
- 20 days/yr
Wind risk 6/10 · Moderate
- Chance of severe wind over 30 yrs
- 56.0%
Air-quality risk 3/10 · Minor
- Unhealthy air days now
- 2 days/yr
- Unhealthy air days in 30 yrs
- 3 days/yr
Risk factors via First Street. Map © Google.
Why this score? — see what drove the C grade
The composite is a weighted blend of 9 inputs, each scored 0–100. Each bar is that input's sub-score; the figure is the points it added to the 100-point composite (weight × sub-score).
- Cash flow +18.5/30.0
- ARV discount +15.0/15.0
- DSCR +5.8/10.0
- 1% rule +4.2/10.0
- Rent growth +4.2/5.0
- Livability +3.9/5.0
- Schools +2.5/10.0
- Condition / age +2.5/5.0
- Appreciation +0.0/10.0
$239,900
🖨 Deal sheet 📄 Offer letter ✓ Due diligence
Listing remarks MLS
This 4 bedroom charmer in the center of town is a must-see! The spacious family room boasts hardwood floors and a wood burning fireplace with a gas starter. The updated kitchen includes wood floors, new countertops and cabinets. Both bathrooms have been completely remodeled with tile floors, new tub, a walk-in shower, new toilets and one of them even has a beautiful shiplap wall. The fourth bedroom has a separate entrance and would be ideal as an office space. The backyard was made for entertaining with a large deck and separate patio inside a fenced in yard. The roof was replaced in 2018.
Key facts
- Hardwood flooring
- Large deck
- Updated kitchen
Tags
Property features AI
Exterior
- Parking: Concrete driveway
- Utilities: Sewer connected
- Home design: Single-family residence; One level
- Construction: Brick veneer and other exterior materials; Composition/shingle roof
- Exterior features: Paved road access; No pool
Interior
- Bathrooms: 2 full bathrooms
- Heating & cooling: Has heating; Has cooling
- Interior features: Gas log fireplace (1 fireplace); Water heater
- Laundry & utility: Dedicated laundry room
Neighborhood map
What this means for you Summary
Snapshot
- This is a 4-bed/1.0-bath single-family listed at $240k.
Deal economics
- At list price, monthly cash flow is $229 ($3k/yr) — positive.
- The deal already cash-flows at list — no discount required.
- To meet the 1% rule (rent ≥ 1% of price), the offer needs to be $220k (8.5% below list).
- Recommended offer: $220k (8.5% below list) — sets the bar for 1% rule.
- Cap rate 7.4% vs local median 3.4% in Tuscaloosa — top-decile yield for the area; either an underpriced asset or a hidden risk that comps aren't pricing in. Stress-test before assuming the spread holds.
Location & tenants
- Location reads 77/100 on livability (#9 in AL, #2,909 nationally) — a middle-class / working-renter tenant base. Strengths: amenities A+, health & safety A+, cost of living A; Watch: crime F, employment D-.
- Tuscaloosa City (urban): math 19% / reading 40% proficiency, ranked #74 of 129 in AL (top 57%) — low school quality limits family demand, transient renter base, plan for 1-2y turnover.
- Zoned schools: Arcadia Elementary School (math 8% / reading 32%, grade F, #457 of 627 statewide, top 74%, 440 students, 52% FRL); Eastwood Middle School (math 3% / reading 31%, grade F, #201 of 257 statewide, top 79%, 758 students, 78% FRL); Paul W Bryant High School (math 3% / reading 7%, grade F, #276 of 305 statewide, top 95%, 1,042 students, 48% FRL) — zoned schools at 60% FRL track the district average.
- Zoned-school proficiency averages 14% at this address vs 30% district-wide (-16 pts) — the specific schools serving this property underperform the Tuscaloosa City average; the district grade overstates school quality for this exact location.
- Market conditions: Rents rising fast (+6.8%/yr); 167 active listings in the ZIP; 20 comparable units currently listed for rent nearby; rentals at typical pace (median 21d on market — plan ~3-4 weeks tenant-placement turnaround); 45% of comp listings sitting > 30 days — soft ceiling on asking rent; 622 units permitted in Tuscaloosa County in 2024 (69 in 5+ unit buildings).
- At $2,196/mo this rent would consume 54% of the median local household income ($49k/yr) (locally 1531% of renters already pay >50% of income on rent) — very limited rent-growth headroom before tenants either downsize or default.
Forward outlook
- Local home prices are declining (-3.0%/yr); year-one equity from $2k of loan paydown is wiped out by about $7k of value loss. Plan a longer hold.
- Tuscaloosa County population projected at +26% by 2050 — long-run rental-demand tailwind backs the buy-and-hold thesis.
Negotiation context
- Only 8 days on market — expect competitive offers; lowballing is unlikely to land.
- 4 sale attempts since 7y ago with the ask held roughly flat each time — persistent listings suggest the price (not the market) is what's stuck; bring a comps-based counter.
Risks & watch-outs
- Climate carrying-cost: major wind risk, 56% chance of damaging wind over 30y; extreme-heat days projected 7→20/yr by 2055 (HVAC capex compounding) — expect insurance premiums to compound above CPI over the hold.
Questions for the listing agent
- Is there a deadline driving the sale (1031 exchange, divorce, estate, relocation)? That informs how much negotiation room exists.
- Crime grade is F in this area — have there been break-ins, vandalism, or insurance claims at this property in the last 3 years? What carrier currently insures it and at what premium?
- What's the average days-on-market for RENTAL listings here right now (not sales)? A rising rental-DOM trend means longer vacancies and softer asking-rent achievability than the comps imply.
- What's the recent tenant-quality profile in this submarket — average credit score on applications, eviction rate, late-payment / NSF rate, and stable-employment percentage? A property-management company in the area should have these aggregated.
- How much new for-sale + rental construction is in the pipeline within 1–3 miles? Heavy new supply typically softens prices + rents 12–24 months out; constrained supply supports both.
Investment metrics
- 1% rule
- 0.92% ✗
- Cap rate
- 7.44%
- Cash-on-cash
- 4.10%
- DSCR
- 1.18
- GRM
- 9.1
CMA / ARV
- ARV (on-the-fly)
- $301,496
- Comps found
- 12
Show comp detail 12 sales within ~0.75 mi
| Address | Dist | Beds/Ba | Sqft | Sold | Price | $/sf | Match |
|---|---|---|---|---|---|---|---|
| 2270 Cross Creek Dr | 0.37mi | 3/2.0 (-1) | 1,744 (-2%) | 2mo | $295,000 | $169 | 68 |
| 2305 Cross Creek Dr | 0.34mi | 3/2.0 (-1) | 1,849 (+4%) | 2mo | $255,000 | $138 | 67 |
| 2330 Cross Creek Dr | 0.36mi | 3/2.0 (-1) | 1,719 (-4%) | 6mo | $290,000 | $169 | 63 |
| 2515 Linda Dr | 0.44mi | 4/2.0 | 1,906 (+7%) | 3mo | $250,000 | $131 | 61 |
| 125 Circlewood | 0.56mi | 3/2.0 (-1) | 1,702 (-5%) | 1mo | $166,500 | $98 | 56 |
| 19 Fairway Dr | 0.70mi | 4/2.0 | 1,715 (-4%) | 1mo | $230,000 | $134 | 56 |
| 126 Brookhaven Dr | 0.67mi | 3/2.0 (-1) | 1,822 (+2%) | 6mo | $329,500 | $181 | 51 |
| 1623 23rd Ave E | 0.48mi | 3/2.0 (-1) | 1,600 (-10%) | 1mo | $195,000 | $122 | 50 |
| 26 Brookhaven Dr | 0.64mi | 3/2.0 (-1) | 1,665 (-7%) | 0mo | $293,500 | $176 | 50 |
| 2437 21st St E | 0.48mi | 3/2.0 (-1) | 1,595 (-11%) | 3mo | $323,000 | $203 | 48 |
| 2082 Idlewood Dr | 0.55mi | 3/2.0 (-1) | 1,579 (-12%) | 6mo | $275,000 | $174 | 42 |
| 68 Cedar Knl | 0.60mi | 3/3.5 (-1) | 1,591 (-11%) | 1mo | $239,900 | $151 | 38 |
Match score weights: distance 35% · size 25% · config 20% · recency 20%. Top-matched comps best support the ARV.
Projected returns pro-forma
-3.0% appreciation · 6.81% rent growth · sell at horizon
- IRR
- -6.0%
- Equity multiple
- 0.77×
- Total profit
- $-15,592
- Equity at exit
- $35,770
- IRR
- 7.4%
- Equity multiple
- 1.65×
- Total profit
- $43,770
- Equity at exit
- $20,742
Cash invested: $67,172 (down + closing). Projections, not guarantees.
Landlord ↔ Tenant lean methodology
- Overall (STATE)
- 90 Strongly Landlord-Friendly
- State Alabama
- 90 Strongly Landlord-Friendly · R+15
- County
- — inherits STATE
- City
- — inherits STATE
ZIP-level market 35404
- Rents YoY
- 6.8%
- Active inventory
- 167
- Price-to-rent
- 9.1×
Monthly cashflow live
- Estimated rent
- $2,196 high interval (Pro) →
- Mortgage (P&I)
- −$1,258
- Tax from tax record
- −$147 /mo · $1,766/yr
- Insurance
- −$100
- HOA
- −$0
- Vacancy / Maint / Mgmt
- −$461
- Net cashflow
- $229
Break-even live
UW: 25.0% down · 7.5% · 30yr · 1.5% tax · 5.0% vac · 8.0% maint · 8.0% mgmt
Financing live
Cash to close
- Down payment
- $59,975
- Closing costs
- $7,197
- Reserves months
- —
- Total cash needed
- —
Loan-product check · same deal, 3 products live
Conventional
25% down · 7.5% · 30yr
- Down + closing
- —
- Monthly P&I
- —
- Monthly cashflow
- —
- DSCR
- —
- Eligible?
- —
Personal DTI + credit; lowest rate.
DSCR
20% down · 8.5% · 30yr
- Down + closing
- —
- Monthly P&I
- —
- Monthly cashflow
- —
- DSCR
- —
- Eligible?
- —
No personal income docs; deal must DSCR.
Hard money
10% down · 12.0% · 12mo
- Down + closing
- —
- Monthly P&I
- —
- Monthly cashflow
- —
- DSCR
- —
- Eligible?
- —
Short-term bridge; refi at stabilization.
Rent comps 20 comps
| Address | Beds | Baths | Sqft | Rent | $/sqft | DOM | Units | Dist |
|---|---|---|---|---|---|---|---|---|
| 105 Eastwood Tuscaloosa, AL | 3.0 | 2.0 | 1891 | $1,525 | $0.81 | 21d | 1 | 0.65mi |
| 1305 12th St E Tuscaloosa, AL | 4.0 | 2.0 | 1377 | $1,615 | $1.17 | 21d | 1 | 0.74mi |
| 1901 5th Ave E Tuscaloosa, AL | 3.0 | 3.0 | 1336 | $2,300 | $1.72 | 21d | 1 | 0.85mi |
| 1810 5th Ave E Tuscaloosa, AL | 4.0 | 3.0 | 1748 | $2,400 | $1.37 | 43d | 1 | 0.92mi |
| 1726 10th St E Tuscaloosa, AL | 3.0 | 3.0 | 1760 | $2,250 | $1.28 | 13d | 2 | 0.92mi |
| 1010 23rd Ave E Tuscaloosa, AL | 3.0 | 2.0 | 1251 | $1,500 | $1.20 | 43d | 1 | 0.95mi |
| 927 Kicker Rd Tuscaloosa, AL | 3.0 | 3.0 | 1412 | $3,075 | $2.18 | 21d | 2 | 0.99mi |
| 1540 4th Ave E Tuscaloosa, AL | 3.0 | 3.0 | 1604 | $2,175 | $1.36 | 43d | 1 | 1.05mi |
| 242 Cedar Crst Tuscaloosa, AL | 3.0 | 3.0 | 1655 | $1,900 | $1.15 | 43d | 1 | 1.08mi |
| 1525 Forest Lake Dr Tuscaloosa, AL | 3.0 | 3.5 | 1840 | $3,000 | $1.63 | 43d | 1 | 1.11mi |
| 829 21st Ave E Tuscaloosa, AL | 3.0 | 3.5 | 1792 | $2,569 | $1.43 | 43d | 1 | 1.14mi |
| 3014 3rd Ct E Tuscaloosa, AL | 3.0 | 2.0 | 1449 | $1,675 | $1.16 | 13d | 1 | 1.19mi |
| 20 16th St Tuscaloosa, AL | 1.0–3.0 | 1.0–3.0 | 1320 | $3,000 | $2.27 | 43d | 4 | 1.27mi |
| 3218 Veterans Memorial Pkwy Tuscaloosa, AL | 3.0 | 3.0–3.5 | 1484 | $1,950 | $1.31 | 21d | 1 | 1.28mi |
| 80 16th St Unit 1-8 Tuscaloosa, AL | 1.0–3.0 | 1.0–3.0 | 1320 | $3,000 | $2.27 | 43d | 4 | 1.29mi |
| 1619 1st Ave Tuscaloosa, AL | 4.0 | 2.0 | 1656 | $1,600 | $0.97 | 13d | 1 | 1.30mi |
| 2919 University Blvd E Tuscaloosa, AL | 3.0 | 1.5 | 1968 | $1,800 | $0.91 | 43d | 1 | 1.38mi |
| 2402 Prince Ave Tuscaloosa, AL | 3.0 | 3.0 | 1796 | $2,300 | $1.28 | 21d | 1 | 1.46mi |
| 2150 3rd Ct Tuscaloosa, AL | 3.0 | 3.0 | 1886 | $2,150 | $1.14 | 13d | 1 | 1.47mi |
| 2150 3rd Ct #602 Tuscaloosa, AL | 3.0 | 3.0 | 1886 | $2,695 | $1.43 | 21d | 1 | 1.48mi |
Listing history 8 events
-
2026-05-14$239,900 Active
-
2023-02-15$269,900 Active
-
2020-09-21soldstatus $210,900
-
2020-09-11soldstatus $210,900 596-char remark
Show marketing remark (596 chars)
This 4 bedroom charmer in the center of town is a must-see! The spacious family room boasts hardwood floors and a wood burning fireplace with a gas starter. The updated kitchen includes wood floors, new countertops and cabinets. Both bathrooms have been completely remodeled with tile floors, new tub, a walk-in shower, new toilets and one of them even has a beautiful shiplap wall. The fourth bedroom has a separate entrance and would be ideal as an office space. The backyard was made for entertaining with a large deck and separate patio inside a fenced in yard. The roof was replaced in 2018.
-
2020-07-26$209,900 596-char remark
Show marketing remark (596 chars)
This 4 bedroom charmer in the center of town is a must-see! The spacious family room boasts hardwood floors and a wood burning fireplace with a gas starter. The updated kitchen includes wood floors, new countertops and cabinets. Both bathrooms have been completely remodeled with tile floors, new tub, a walk-in shower, new toilets and one of them even has a beautiful shiplap wall. The fourth bedroom has a separate entrance and would be ideal as an office space. The backyard was made for entertaining with a large deck and separate patio inside a fenced in yard. The roof was replaced in 2018.
-
2019-09-04soldstatus $197,000
-
2019-08-30soldstatus $197,000
-
2019-06-27$195,000
ⓘ Source: listings_history table (triggers on properties + properties_extension) + one-shot
backfill from property_details.listing_events for pre-trigger history.
Tax reassessment forecast AL · Resets to sale price
- Current annual tax
- $1,766 · $147/mo
- Projected year-2 tax
- $1,766 · $147/mo
- Expected delta
- $0/yr ($0/mo · 0.0%)
ⓘ Screening estimate from a state-policy table — verify with the county assessor before closing.
Climate risk First Street
- Flood 1/10 Low FEMA zone X (unshaded) · 0% chance over 30 yrs
- Wildfire 1/10 Low
- Heat 7/10 Severe 7 d/yr ≥107°F today · 20 d/yr by 30 yrs out
- Wind 6/10 Major 56% chance of damaging wind over 30 yrs
- Air quality 3/10 Moderate 2 unhealthy d/yr today · 3 by 30 yrs out
Nearby sold comps map
Loading sold comps map…
Walkable amenities ~0.75 mi
Loading nearby amenities…
Taxation est. · year 1
- Rental income
- $26,347
- − Mortgage interest
- −$13,438
- − Property taxes
- −$1,766
- − Insurance
- −$1,200
- − Repairs & maintenance
- −$2,108
- − Management
- −$2,108
- − Depreciation
- −$6,979
- Taxable loss
- −$1,251
- Est. tax savings @ 24.0%
- +$300
- After-tax cash flow
- $3,052/yr
For passive investors: Depreciation is non-cash, so a rental often shows a tax loss while cash-flowing — sheltering income. Rental losses are passive: they offset passive income freely, and up to $25,000/yr can offset ordinary (W-2) income if you actively participate and your MAGI is under $100k (phasing out to $0 by $150k); unused losses carry forward. On sale, claimed depreciation is recaptured at up to 25%, and gains may owe capital-gains tax (a 1031 exchange can defer both). Figures are a year-1 estimate at your 24.0% rate — not tax advice; consult a CPA.
Schools (NCES district)
- District
- Tuscaloosa City
- NCES district ID
- 0103360
- Math proficiency
- 19% ▼ -24.00%
- Reading proficiency
- 40% ▼ -1.00%
- Median HH income
- $37,474
- Composite
- 24.51/100
- National rank
- #7647
- State rank
- #74 of 129 in AL
Livability — Tuscaloosa
- Score
- 77/100
- State rank
- #9
- US rank
- #2909
Category grades
Schools grade is shown separately in the Schools card above.
Census & demographics
- Census place
- Tuscaloosa, AL
- County
- Tuscaloosa County · 206,491 people
- City population
- 134,228
- Metro
- Tuscaloosa, AL
- Population (ZIP)
- 22,445
- Household income
- $48,932
- Rent vs Own
- Severe rent burden
- 1531.0
Population outlook (Tuscaloosa County) Hauer SSP2
- Today (2025)
- 228,293 people
- By 2030
- 240,551 · +5.4%
- By 2040
- 263,856 · +15.6%
- By 2050
- 286,491 · +25.5%
- By 2075
- 335,783 · +47.1%
- By 2100
- 370,520 · +62.3%
Race, ethnicity, and origin ACS 2023
- Neighborhood character
- Diverse neighborhood (Simpson 0.59)
- Race & ethnicity
- Black 46% White 44% Hispanic / Latino 8% Two or more races 5% Asian 1%
- Hispanic origin (detail)
- Mexican 8%
- Common ancestry
- Italian 2% Slovak 1% Serbian 1%
- Foreign-born
- 6% · Canada, South Korea
- Languages at home
- 91% English-only · Spanish 7%
Political lean MEDSL · Tuscaloosa
- 2024 margin
- Strong R (+20.4) · D 39.4% · R 59.8%
- 2008→2024 swing
- -4.4pp toward R · 2008: -16.0pp · 2024: -20.4pp
- All cycles
- 2024: R+20.4 2020: R+14.8 2016: R+19.5 2012: R+17.4 2008: R+16.0
Not yet ingested
- Civics
- —
Market trends
- HPI YoY
- ▼ -103.00%
- Current HPI
- 170.026
- Rent YoY
- ▲ 6.81%
- Metro
- Tuscaloosa, AL
- State GDP YoY
- ▲ 2.94%
- F500 in state
- 4
Industry mix (Fortune 500 HQ in AL)
| Industry | F500 HQs | Revenue |
|---|---|---|
| Financial Services | 1 | $8B |
|
||
| Healthcare | 1 | $5B |
|
||
Price history
+23.0% since first listed8 events — show timeline
- 2026-05-14 Listed $239,900 WAMLS
- 2023-02-15 Listed $269,900 WAMLS
- 2020-09-21 Sold (Public Records) $210,900 Public Records
- 2020-09-11 Sold (MLS) $210,900 WAMLS
- 2020-07-26 Listed $209,900 WAMLS
- 2019-09-04 Sold (Public Records) $197,000 Public Records
- 2019-08-30 Sold (MLS) $197,000 WAMLS
- 2019-06-27 Listed $195,000 WAMLS
Property tax history
+9.9%/yrLatest (2025): $1,766 · +7.0% YoY. Source: county tax records.
Cash-flow waterfall
monthlySold comps — $/sqft
last 12 mo · ≤1 miLoading sold comps…