 🏗️ New Construction
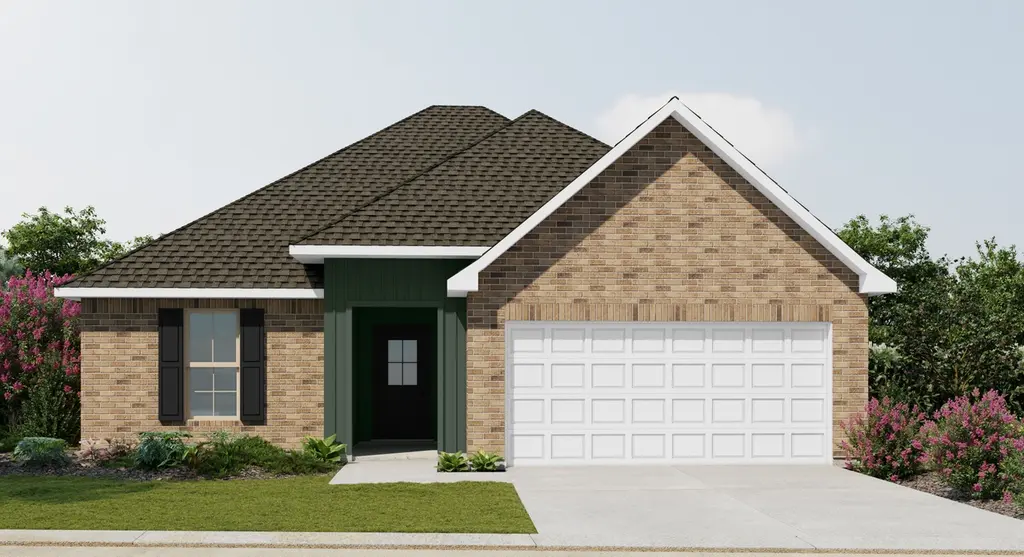
Rayleigh IV G Plan · Scott, LA
Flood risk No data
- FEMA flood zone
- —
- Chance of flooding over 30 yrs
- —
- Est. flood insurance / yr
- —
Fire risk No data
- Est. fire insurance / yr
- —
Heat risk No data
- Hot days now (above threshold)
- —
- Hot days in 30 yrs
- —
Wind risk No data
- Chance of severe wind over 30 yrs
- —
Air-quality risk No data
- Unhealthy air days now
- —
- Unhealthy air days in 30 yrs
- —
Risk factors via First Street. Map © Google.
Why this score? — see what drove the F grade
The composite is a weighted blend of 9 inputs, each scored 0–100. Each bar is that input's sub-score; the figure is the points it added to the 100-point composite (weight × sub-score).
- Cash flow +7.9/30.0
- ARV discount +7.5/15.0
- Schools +3.6/10.0
- Livability +3.3/5.0
- Rent growth +2.5/5.0
- 1% rule +2.4/10.0
- DSCR +2.0/10.0
- Condition / age +1.0/5.0
- Appreciation +0.0/10.0
$228,990
🖨 Deal sheet (PDF) 📄 Offer letter ✓ Due diligence
Listing remarks MLS
- Open Floor Plan - Three Bedrooms, Two Bathrooms - Brick & Siding Exterior - Recessed Can Lighting in Kitchen - Double Master Vanity - Walk-In Master Closet - Two Car Garage - Covered Rear Patio
Key facts
- Open floor plan
- Covered rear patio
- Double master vanity
Tags
Neighborhood map
What this means for you Summary
Snapshot
- This is a 3-bed/2.0-bath single-family listed at $229k. Condition is rated poor.
Deal economics
- At list price, monthly cash flow is $-270 ($-3k/yr) — negative.
- To cash-flow at today's rent, offer at most $217k (5.4% below list).
- To meet the 1% rule (rent ≥ 1% of price), the offer needs to be $190k (17.2% below list).
- Recommended offer: $190k (17.2% below list) — sets the bar for 1% rule.
Location & tenants
- Location reads 66/100 on livability (#116 in LA) — a middle-class / working-renter tenant base. Strengths: cost of living A+, health & safety A+, housing B+; Watch: crime F, amenities F, commute F.
- Lafayette Parish (urban): math 38% / reading 46% proficiency, ranked #19 of 98 in LA (top 19%) — families likely to look elsewhere, expect single-tenant / working-renter base with shorter leases.
- Zoned schools: J. Wallace James Elementary School (math 46% / reading 49%, grade D, #147 of 646 statewide, top 23%, 939 students, 64% FRL); Scott Middle School (math 20% / reading 28%, grade F, #143 of 218 statewide, top 65%, 559 students, 65% FRL); Acadiana High School (math 31% / reading 29%, grade F, #125 of 265 statewide, top 47%, 1,813 students, 56% FRL).
- Market conditions: 277 active listings in the ZIP; 8 comparable units currently listed for rent nearby; rentals lingering (median 46d on market — plan ~5-8 weeks vacancy on turnover, expect pricing pressure); 50% of comp listings sitting > 30 days — soft ceiling on asking rent; 1,585 units permitted in Lafayette Parish in 2024 (10 in 5+ unit buildings).
Forward outlook
- Local home prices are declining (-3.0%/yr); year-one equity from $2k of loan paydown is wiped out by about $8k of value loss. Plan a longer hold.
- Lafayette County population projected at +34% by 2050 — long-run rental-demand tailwind backs the buy-and-hold thesis.
Negotiation context
- It's been on market 614 days — a 12% lower offer ($202k) is reasonable based on typical stale-listing flexibility.
Questions for the listing agent
- What do current leases actually rent for vs. the listed asking? Can we see a recent rent roll and the last 12 months of T-12 income?
- It's been on market 614 days. Have you received any prior offers? Is the seller open to a 17% concession, seller financing, or rate buy-down credit?
- Have any recent inspections been done? Can we get a copy of the seller's disclosures and any deferred-maintenance estimates?
- Why hasn't it sold? Are there any deal-killer items the seller is aware of (foundation, flood, title, zoning, code violations)?
- Is there a deadline driving the sale (1031 exchange, divorce, estate, relocation)? That informs how much negotiation room exists.
- Schools are B-rated — typically a magnet for longer-tenancy family renters. What's the average tenant stay here, and is there a school-zone premium baked into asking?
- Crime grade is F in this area — have there been break-ins, vandalism, or insurance claims at this property in the last 3 years? What carrier currently insures it and at what premium?
- The area grade is low — what's the realistic commute time and amenity access for the typical tenant pool here? Any planned neighborhood developments (good or bad) we should know about?
- What's the average days-on-market for RENTAL listings here right now (not sales)? A rising rental-DOM trend means longer vacancies and softer asking-rent achievability than the comps imply.
- What's the recent tenant-quality profile in this submarket — average credit score on applications, eviction rate, late-payment / NSF rate, and stable-employment percentage? A property-management company in the area should have these aggregated.
- How much new for-sale + rental construction is in the pipeline within 1–3 miles? Heavy new supply typically softens prices + rents 12–24 months out; constrained supply supports both.
Investment metrics
- 1% rule
- 0.74% ✗
- Cap rate
- 5.03%
- Cash-on-cash
- -4.52%
- DSCR
- 0.80
- GRM
- 11.2
CMA / ARV
- ARV (median comp)
- $255,744
- List price
- $228,990
- Delta
- -10.46%
- Verdict
- UNDERPRICED
- Comps
- 20 within 1.0 mi
Show comp detail 12 sales within ~0.75 mi
| Address | Dist | Beds/Ba | Sqft | Sold | Price | $/sf | Match |
|---|---|---|---|---|---|---|---|
| 211 Nandina Dr | 0.10mi | 3/2.0 | 1,495 (0%) | 0mo | $231,321 | $155 | 95 |
| 108 Sandstone Ave | 0.34mi | 3/2.0 | 1,448 (-3%) | 3mo | $285,000 | $197 | 76 |
| 100 Sandstone Ave | 0.31mi | 3/2.0 | 1,578 (+6%) | 1mo | $345,000 | $219 | 76 |
| 107 Earline Dr | 0.25mi | 3/2.0 | 1,387 (-7%) | 2mo | $167,000 | $120 | 75 |
| 111 Nandina Dr | 0.11mi | 3/2.0 | 1,689 (+13%) | 2mo | $245,664 | $145 | 71 |
| 123 Pine Harvest Ln | 0.63mi | 3/2.0 | 1,495 (0%) | 4mo | $228,220 | $153 | 67 |
| 116 Earline Dr | 0.23mi | 3/2.0 | 1,314 (-12%) | 2mo | $175,000 | $133 | 67 |
| 102 Pine Harvest Ln | 0.65mi | 3/2.0 | 1,538 (+3%) | 2mo | $234,265 | $152 | 63 |
| 204 Keystone Dr | 0.40mi | 3/2.0 | 1,346 (-10%) | 2mo | $309,000 | $230 | 63 |
| 104 Breckenridge Loop | 0.63mi | 3/2.0 | 1,544 (+3%) | 3mo | $212,500 | $138 | 63 |
| 129 Harvest Pointe Cir | 0.74mi | 3/2.0 | 1,440 (-4%) | 2mo | $219,900 | $153 | 58 |
| 205 Boxview St | 0.60mi | 3/2.0 | 1,626 (+9%) | 3mo | $335,000 | $206 | 55 |
Match score weights: distance 35% · size 25% · config 20% · recency 20%. Top-matched comps best support the ARV.
Projected returns pro-forma
-3.0% appreciation · 3.0% rent growth · sell at horizon
- IRR
- -23.9%
- Equity multiple
- 0.18×
- Total profit
- $-58,607
- Equity at exit
- $38,132
- IRR
- -19.0%
- Equity multiple
- -0.02×
- Total profit
- $-73,058
- Equity at exit
- $22,112
Cash invested: $71,608 (down + closing). Projections, not guarantees.
Landlord ↔ Tenant lean methodology
- Overall (STATE)
- 90 Strongly Landlord-Friendly
- State Louisiana
- 90 Strongly Landlord-Friendly · R+12
- County
- — inherits STATE
- City
- — inherits STATE
ZIP-level market 70583
- Active inventory
- 277
- Price-to-rent
- 10.1×
Monthly cashflow live
- Estimated rent
- $1,895 high interval (Pro) →
- Mortgage (P&I)
- −$1,341
- Tax est. 1.5%
- −$320 /mo · $3,836/yr
- Insurance
- −$107
- HOA
- −$0
- Vacancy / Maint / Mgmt
- −$398
- Net cashflow
- $-270
Break-even live
Sensitivity live
| Price | -10% $-93 | -5% $-182 | +0% $-270 | +5% $-358 | +10% $-447 |
|---|---|---|---|---|---|
| Rent | -10% $-420 | -5% $-345 | +0% $-270 | +5% $-195 | +10% $-120 |
| Rate | -1.0pp $-141 | -0.5pp $-205 | base $-270 | +0.5pp $-336 | +1.0pp $-404 |
UW: 25.0% down · 7.5% · 30yr · 1.5% tax · 5.0% vac · 8.0% maint · 8.0% mgmt
Financing live
Cash to close
- Down payment
- $63,936
- Closing costs
- $7,672
- Reserves months
- —
- Total cash needed
- —
Loan-product check · same deal, 3 products live
Conventional
25% down · 7.5% · 30yr
- Down + closing
- —
- Monthly P&I
- —
- Monthly cashflow
- —
- DSCR
- —
- Eligible?
- —
Personal DTI + credit; lowest rate.
DSCR
20% down · 8.5% · 30yr
- Down + closing
- —
- Monthly P&I
- —
- Monthly cashflow
- —
- DSCR
- —
- Eligible?
- —
No personal income docs; deal must DSCR.
Hard money
10% down · 12.0% · 12mo
- Down + closing
- —
- Monthly P&I
- —
- Monthly cashflow
- —
- DSCR
- —
- Eligible?
- —
Short-term bridge; refi at stabilization.
Rent comps 8 comps
| Address | Beds | Baths | Sqft | Rent | $/sqft | DOM | Units | Dist |
|---|---|---|---|---|---|---|---|---|
| 110 Bozeman Trl Scott, LA | 2.0 | 2.0 | 972 | $1,650 | $1.70 | 15d | 1 | 0.32mi |
| 100 Sandstone Ave Unit 100 Scott, LA | 2.0 | 2.5 | 990 | $1,650 | $1.67 | 45d | 1 | 0.33mi |
| 1313 Apollo Rd Scott, LA | 1.0–3.0 | 1.0–2.0 | 1100 | $2,000 | $1.82 | 15d | 10 | 0.43mi |
| 315 Sandstone Ave #202 Scott, LA | 2.0 | 2.5 | 1193 | $1,895 | $1.59 | 15d | 1 | 0.56mi |
| 315 Sandstone Ave #103 Scott, LA | 2.0 | 2.5 | 990 | $1,650 | $1.67 | 45d | 1 | 0.56mi |
| 128 Oak Village Dr Scott, LA | 3.0 | 2.0 | 1445 | $2,450 | $1.70 | 15d | 1 | 0.58mi |
| 108 Notre Dame Dr Lafayette, LA | 3.0 | 3.0 | 1700 | $1,700 | $1.00 | 45d | 1 | 1.04mi |
| 401 Pinto St Lafayette, LA | 3.0 | 2.0 | 1601 | $2,300 | $1.44 | 45d | 1 | 1.08mi |
Listing history 18 events
-
2026-06-21days on market $228,990 Active 614 DOM
-
2026-06-18days on market $228,990 Active 611 DOM
-
2026-06-17days on market $228,990 Active 610 DOM
-
2026-06-16days on market $228,990 Active 609 DOM
-
2026-06-15days on market $228,990 Active 608 DOM
-
2026-06-14days on market $228,990 Active 606 DOM
-
2026-06-13days on market $228,990 Active 605 DOM
-
2026-06-10days on market $228,990 Active 603 DOM
-
2026-06-09days on market $228,990 Active 602 DOM
-
2026-06-08days on market $228,990 Active 601 DOM
-
2026-06-07days on market $228,990 Active 600 DOM
-
2026-06-05days on market $228,990 Active 597 DOM
-
2026-06-03days on market $228,990 Active 596 DOM
-
2026-06-02days on market $228,990 Active 595 DOM
-
2026-06-01days on market $228,990 Active 594 DOM
-
2026-05-31days on market $228,990 Active 593 DOM
-
2026-05-30days on market $228,990 Active 592 DOM
-
2024-10-16$228,990 Active 201-char remark
Show marketing remark (201 chars)
- Open Floor Plan - Three Bedrooms, Two Bathrooms - Brick & Siding Exterior - Recessed Can Lighting in Kitchen - Double Master Vanity - Walk-In Master Closet - Two Car Garage - Covered Rear Patio
ⓘ Source: listings_history table (triggers on properties + properties_extension) + one-shot
backfill from property_details.listing_events for pre-trigger history.
Nearby sold comps map
Loading sold comps map…
Walkable amenities ~0.75 mi
Loading nearby amenities…
Taxation est. · year 1
- Rental income
- $22,746
- − Mortgage interest
- −$14,326
- − Property taxes
- −$3,836
- − Insurance
- −$1,279
- − Repairs & maintenance
- −$1,820
- − Management
- −$1,820
- − Depreciation
- −$7,440
- Taxable loss
- −$7,774
- Est. tax savings @ 24.0%
- +$1,866
- After-tax cash flow
- $-1,374/yr
For passive investors: Depreciation is non-cash, so a rental often shows a tax loss while cash-flowing — sheltering income. Rental losses are passive: they offset passive income freely, and up to $25,000/yr can offset ordinary (W-2) income if you actively participate and your MAGI is under $100k (phasing out to $0 by $150k); unused losses carry forward. On sale, claimed depreciation is recaptured at up to 25%, and gains may owe capital-gains tax (a 1031 exchange can defer both). Figures are a year-1 estimate at your 24.0% rate — not tax advice; consult a CPA.
Condition & rehab AI · 3 photos
This property requires extensive repairs and maintenance, including landscaping, exterior painting, interior repairs, HVAC upgrades, and window replacement. Significant improvements are needed to increase its resale and rental value.
Repairs flagged
- Major Landscaping and debris removal — Significant overgrowth and debris are visible in the independent image, indicating major repairs are needed.
- Major Exterior painting — The listing photo shows a well-maintained exterior, but the independent image reveals neglect, indicating major repairs are needed.
- Major Landscaping and curb appeal — The independent image shows overgrown vegetation and debris, indicating major repairs are needed.
- Major Interior painting and repairs — No interior walls or paint are visible in the photos, indicating major repairs are needed.
- Major HVAC and mechanical systems — No systems are visible in the photos, indicating major repairs are needed.
- Major Windows and glass replacement — No windows are visible in the photos, indicating major repairs are needed.
Value-add opportunities
- Both Landscaping and curb appeal — A well-maintained exterior and landscaping can significantly increase both resale and rental value.
- Both Interior painting and repairs — A fresh coat of paint and repairs can enhance the home's appearance and appeal to potential buyers or renters.
- Both HVAC and mechanical systems — Upgrading HVAC and mechanical systems can improve comfort and energy efficiency, increasing both resale and rental value.
- Both Windows and glass replacement — New windows can improve energy efficiency, reduce noise, and enhance the home's curb appeal, increasing both resale and rental value.
Renovation cost estimate screening
| Repair item | Severity | Est. cost |
|---|---|---|
| Landscaping and debris removal · Significant overgrowth and debris are visible in the independent image, indicating major repairs are needed. | Major | $15,000–50,000 |
| Exterior painting · The listing photo shows a well-maintained exterior, but the independent image reveals neglect, indicating major repairs are needed. | Major | $15,000–50,000 |
| Landscaping and curb appeal · The independent image shows overgrown vegetation and debris, indicating major repairs are needed. | Major | $15,000–50,000 |
| Interior painting and repairs · No interior walls or paint are visible in the photos, indicating major repairs are needed. | Major | $15,000–50,000 |
| HVAC and mechanical systems · No systems are visible in the photos, indicating major repairs are needed. | Major | $15,000–50,000 |
| Windows and glass replacement · No windows are visible in the photos, indicating major repairs are needed. | Major | $15,000–50,000 |
| Total estimated repair cost · 6 items | $90,000–300,000 |
Value-add ROI direction
- Both Landscaping and curb appeal — A well-maintained exterior and landscaping can significantly increase both resale and rental value. ↑
- Both Interior painting and repairs — A fresh coat of paint and repairs can enhance the home's appearance and appeal to potential buyers or renters. ↑
- Both HVAC and mechanical systems — Upgrading HVAC and mechanical systems can improve comfort and energy efficiency, increasing both resale and rental value. ↑
- Both Windows and glass replacement — New windows can improve energy efficiency, reduce noise, and enhance the home's curb appeal, increasing both resale and rental value. ↑
ⓘ Cost ranges are severity-bucket heuristics (US national rule-of-thumb). Get contractor quotes + a written scope before underwriting a rehab budget.
Schools (NCES district)
- District
- Lafayette Parish
- NCES district ID
- 2200870
- Math proficiency
- 38% ▼ -32.00%
- Reading proficiency
- 46% ▼ -24.00%
- Median HH income
- $50,238
- Composite
- 36.15/100
- National rank
- #4741
- State rank
- #19 of 98 in LA
Livability — Scott
- Score
- 66/100
- State rank
- #116
- US rank
- #11265
Category grades
Schools grade is shown separately in the Schools card above.
Census & demographics
- Census place
- Scott, LA
- City population
- 8,670
- Population (ZIP)
- 8,670
Population outlook (Lafayette County) Hauer SSP2
- Today (2025)
- 280,930 people
- By 2030
- 301,092 · +7.2%
- By 2040
- 339,456 · +20.8%
- By 2050
- 375,156 · +33.5%
- By 2075
- 451,672 · +60.8%
- By 2100
- 497,203 · +77.0%
Race, ethnicity, and origin ACS 2023
- Neighborhood character
- Predominantly White (68%)
- Race & ethnicity
- White 68% Hispanic / Latino 16% Black 13% Two or more races 11%
- Hispanic origin (detail)
- Mexican 7% Cuban 2%
- Common ancestry
- Lithuanian 11% Slovak 3% Italian 1%
- Foreign-born
- 11% · Canada
- Languages at home
- 81% English-only · Spanish 12% French/Haitian/Cajun 7%
Political lean MEDSL · Lafayette
- 2024 margin
- Solid R (+31.4) · D 33.5% · R 64.8% · Other 1.7%
- 2008→2024 swing
- -0.1pp no change · 2008: -31.3pp · 2024: -31.4pp
- All cycles
- 2024: R+31.4 2020: R+28.7 2016: R+33.6 2012: R+33.7 2008: R+31.3
Not yet ingested
- Civics
- —
Market trends
- HPI YoY
- ▼ -84.03%
- Current HPI
- 132.4083
- Rent YoY
- —
- Metro
- —
- State GDP YoY
- ▲ 3.29%
- F500 in state
- 10
Industry mix (Fortune 500 HQ in LA)
| Industry | F500 HQs | Revenue |
|---|---|---|
| Telecommunications | 2 | $23B |
|
||
| Utilities | 1 | $12B |
|
||
| Wholesale / Distribution | 1 | $5B |
|
||
| Advertising | 1 | $2B |
|
||
Price history
1 event — show timeline
- 2024-10-16 Listed $228,990 Zillow
Cash-flow waterfall
monthlySold comps — $/sqft
last 12 mo · ≤1 miLoading sold comps…