 Duplex
415 Daws RD Rd Unit 415-417 · Hiawatha, IA
Flood risk 1/10 · Minimal
- FEMA flood zone
- X (unshaded)
- Chance of flooding over 30 yrs
- 0.0%
- Est. flood insurance / yr
- $473 – $860
Fire risk 2/10 · Minimal
- Est. fire insurance / yr
- $902 – $1,676
Heat risk 2/10 · Minimal
- Hot days now (above 103°F)
- 7 days/yr
- Hot days in 30 yrs
- 15 days/yr
Wind risk 2/10 · Minimal
- Chance of severe wind over 30 yrs
- —
Air-quality risk 2/10 · Minimal
- Unhealthy air days now
- 0 days/yr
- Unhealthy air days in 30 yrs
- 1 days/yr
Risk factors via First Street. Map © Google.
Why this score? — see what drove the B+ grade
The composite is a weighted blend of 9 inputs, each scored 0–100. Each bar is that input's sub-score; the figure is the points it added to the 100-point composite (weight × sub-score).
- Cash flow +30.0/30.0
- ARV discount +15.0/15.0
- 1% rule +10.0/10.0
- DSCR +10.0/10.0
- Schools +4.7/10.0
- Livability +4.0/5.0
- Rent growth +2.5/5.0
- Condition / age +2.2/5.0
- Appreciation +0.0/10.0
$160,000
🖨 Deal sheet (PDF) 📄 Offer letter ✓ Due diligence
Multi-family units
County records classify this as Multi-Family (2-4 Unit). Listing-text estimate: 2 units. confirmed
Listing remarks
IF YOUR LOOKING FOR A PROJECT THAT HAS LOTS OF POTENTIAL, THIS ONE MAY BE FOR YOU. THIS PROPERTY IS SET UP AS A DUPLEX BUT COULD BE CONVERTED TO A TRIPLEX. IT HAS A 2 BED WITH 1 BATH, AND A 5 BED WITH 2 BATH. WITH PROJECTED RENTAL INCOME BETWEEN 2500-3000K. PROPERTY SOLD IN AS-IS CONDITION. OWNER IS A LICENSED REALTOR IN IOWA.
Key facts
- Duplex
- 8,059 sq ft lot
- 5 parking spots
Tags
Neighborhood map
What this means for you Summary
Snapshot
- This is a 2 × 2-bed/?-bath units multifamily listed at $160k. Condition is rated fair.
Deal economics
- At list price, monthly cash flow is $2k ($27k/yr) — positive. Per door: $1k/mo.
- The deal already cash-flows at list — no discount required.
- Meets the 1% rule at list price ($4k rent vs $160k).
- Cap rate 22.9% vs local median 2.0% in Hiawatha — top-decile yield for the area; either an underpriced asset or a hidden risk that comps aren't pricing in. Stress-test before assuming the spread holds.
Location & tenants
- Location reads 79/100 on livability (#93 in IA, #1,983 nationally) — a middle-class / working-renter tenant base. Strengths: cost of living A+, housing A+, health & safety A+; Watch: employment D, amenities F.
- Cedar Rapids Community School District (urban): math 50% / reading 59% proficiency, ranked #265 of 289 in IA (top 92%) — acceptable for families but not a draw, mixed tenant base, ~2y average lease.
- Zoned schools: Nixon Elementary School (math 52% / reading 57%, grade C, #462 of 616 statewide, top 79%, 289 students, 67% FRL); Harding Middle School (math 61% / reading 69%, grade A-, #154 of 246 statewide, top 63%, 713 students, 43% FRL); John F Kennedy High School (math 63% / reading 77%, grade B+, #146 of 336 statewide, top 45%, 1,714 students, 31% FRL) — zoned schools at 47% FRL track the district average.
- Market conditions: 138 active listings in the ZIP; 1,023 units permitted in Linn County in 2024 (456 in 5+ unit buildings).
Forward outlook
- Local home prices are declining (-3.0%/yr); year-one equity from $1k of loan paydown is wiped out by about $5k of value loss. Plan a longer hold.
- Linn County population projected at +16% by 2050 — long-run rental-demand tailwind backs the buy-and-hold thesis.
- At projected returns (-3.0% appreciation + 3.0% rent growth), your $45k cash investment doubles in ~2 years — after that, you're playing with house money.
Negotiation context
- Only 3 days on market — expect competitive offers; lowballing is unlikely to land.
Questions for the listing agent
- Can we see the unit-by-unit rent roll, current vacancy, and any below-market leases? What's the average tenancy length?
- What capital expenditures (roof, boiler, parking lot, exteriors) have been made in the last 5 years, and what's planned in the next 2?
- Have any recent inspections been done? Can we get a copy of the seller's disclosures and any deferred-maintenance estimates?
- Built in 1977 — when were the roof, HVAC, electrical panel, plumbing, and water heater last replaced?
- Is there a deadline driving the sale (1031 exchange, divorce, estate, relocation)? That informs how much negotiation room exists.
- Schools are B-rated — typically a magnet for longer-tenancy family renters. What's the average tenant stay here, and is there a school-zone premium baked into asking?
- What's the average days-on-market for RENTAL listings here right now (not sales)? A rising rental-DOM trend means longer vacancies and softer asking-rent achievability than the comps imply.
- What's the recent tenant-quality profile in this submarket — average credit score on applications, eviction rate, late-payment / NSF rate, and stable-employment percentage? A property-management company in the area should have these aggregated.
- How much new apartment / multifamily construction is in the pipeline within 1–3 miles? Heavy new supply (>2% of stock underway) typically softens rents 12–24 months out; light construction supports rent growth.
Investment metrics
- 1% rule
- 2.62% ✓
- Cap rate
- 22.87%
- Cash-on-cash
- 59.19%
- DSCR
- 3.63
- GRM
- 3.2
CMA / ARV
- ARV (on-the-fly)
- $218,880
- Comps found
- 2
Show comp detail 2 sales within ~0.75 mi
| Address | Dist | Beds/Ba | Sqft | Sold | Price | $/sf | Match |
|---|---|---|---|---|---|---|---|
| 58 Northwood Dr Unit 1,2,3,4 | 0.48mi | —/— | 2,880 (0%) | 12mo | $220,000 | $76 | 67 |
| 780 Ryan Ave Ave | 0.40mi | —/— | 3,100 (+8%) | 4mo | $225,000 | $73 | 65 |
Match score weights: distance 35% · size 25% · config 20% · recency 20%. Top-matched comps best support the ARV.
Projected returns pro-forma
-3.0% appreciation · 3.0% rent growth · sell at horizon
- IRR
- 57.9%
- Equity multiple
- 3.56×
- Total profit
- $114,887
- Equity at exit
- $23,857
- IRR
- 62.7%
- Equity multiple
- 7.28×
- Total profit
- $281,537
- Equity at exit
- $13,834
Cash invested: $44,800 (down + closing). Projections, not guarantees.
Landlord ↔ Tenant lean methodology
- Overall (STATE)
- 83 Strongly Landlord-Friendly
- State Iowa
- 83 Strongly Landlord-Friendly · R+6
- County
- — inherits STATE
- City
- — inherits STATE
ZIP-level market 52233
- Home prices YoY
- -28.1%
- Active inventory
- 138
- Price-to-rent
- 6.4×
Monthly cashflow live
- Estimated rent
- $4,197 medium interval (Pro) →
- Mortgage (P&I)
- −$839
- Tax est. 1.5%
- −$200 /mo · $2,400/yr
- Insurance
- −$67
- HOA
- −$0
- Vacancy / Maint / Mgmt
- −$881
- Net cashflow
- $2,210
Break-even live
Sensitivity live
| Price | -10% $2,320 | -5% $2,265 | +0% $2,210 | +5% $2,155 | +10% $2,099 |
|---|---|---|---|---|---|
| Rent | -10% $1,878 | -5% $2,044 | +0% $2,210 | +5% $2,376 | +10% $2,541 |
| Rate | -1.0pp $2,290 | -0.5pp $2,251 | base $2,210 | +0.5pp $2,168 | +1.0pp $2,126 |
2-unit breakdown (identical units grouped — click to expand)
| Units | Beds | Baths | Est. rent |
|---|---|---|---|
| 2× units | 2 | — | $4,196 |
| #1 | 2 | — | $2,098 |
| #2 | 2 | — | $2,098 |
| Total (2 units) | $4,197 | ||
UW: 25.0% down · 7.5% · 30yr · 1.5% tax · 5.0% vac · 8.0% maint · 8.0% mgmt
Financing live
Cash to close
- Down payment
- $40,000
- Closing costs
- $4,800
- Reserves months
- —
- Total cash needed
- —
Loan-product check · same deal, 3 products live
Conventional
25% down · 7.5% · 30yr
- Down + closing
- —
- Monthly P&I
- —
- Monthly cashflow
- —
- DSCR
- —
- Eligible?
- —
Personal DTI + credit; lowest rate.
DSCR
20% down · 8.5% · 30yr
- Down + closing
- —
- Monthly P&I
- —
- Monthly cashflow
- —
- DSCR
- —
- Eligible?
- —
No personal income docs; deal must DSCR.
Hard money
10% down · 12.0% · 12mo
- Down + closing
- —
- Monthly P&I
- —
- Monthly cashflow
- —
- DSCR
- —
- Eligible?
- —
Short-term bridge; refi at stabilization.
Listing history 3 events
-
2026-05-11soldstatus $161,500 Closed
-
2026-03-08status Pending
-
2026-03-05$160,000 Active
ⓘ Source: listings_history table (triggers on properties + properties_extension) + one-shot
backfill from property_details.listing_events for pre-trigger history.
Climate risk First Street
- Flood 1/10 Low FEMA zone X (unshaded) · 0% chance over 30 yrs
- Wildfire 2/10 Low
- Heat 2/10 Low 7 d/yr ≥103°F today · 15 d/yr by 30 yrs out
- Wind 2/10 Low
- Air quality 2/10 Low 0 unhealthy d/yr today · 1 by 30 yrs out
Nearby sold comps map
Loading sold comps map…
Walkable amenities ~0.75 mi
Loading nearby amenities…
Taxation est. · year 1
- Rental income
- $50,364
- − Mortgage interest
- −$8,962
- − Property taxes
- −$2,400
- − Insurance
- −$800
- − Repairs & maintenance
- −$4,029
- − Management
- −$4,029
- − Depreciation
- −$4,655
- Taxable income
- $25,489
- Est. tax owed @ 24.0%
- −$6,117
- After-tax cash flow
- $20,402/yr
For passive investors: Depreciation is non-cash, so a rental often shows a tax loss while cash-flowing — sheltering income. Rental losses are passive: they offset passive income freely, and up to $25,000/yr can offset ordinary (W-2) income if you actively participate and your MAGI is under $100k (phasing out to $0 by $150k); unused losses carry forward. On sale, claimed depreciation is recaptured at up to 25%, and gains may owe capital-gains tax (a 1031 exchange can defer both). Figures are a year-1 estimate at your 24.0% rate — not tax advice; consult a CPA.
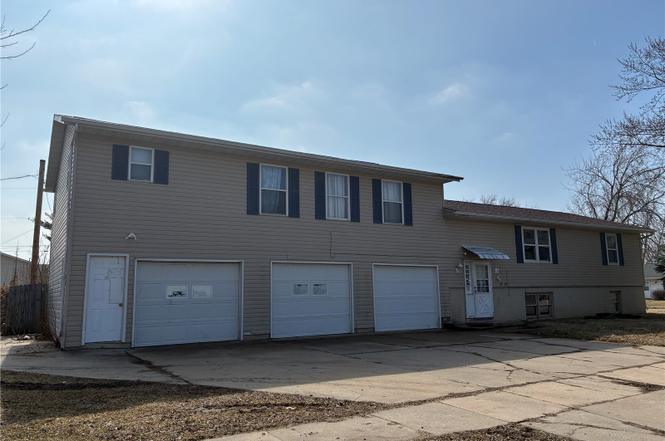
Condition & rehab AI · 8 photos
This multi-family property requires extensive repairs and maintenance, including a new roof, exterior painting and staining, and landscaping and fencing repair. The home is in fair condition and has potential for significant value increase with these improvements.
Repairs flagged
- Major roof — The roof appears to be in poor condition, with visible wear and tear.
- Moderate exterior siding — The siding is in fair condition, with some discoloration and minor damage.
- Major landscaping — The landscaping is overgrown and in need of trimming.
- Moderate fencing — The fencing is in fair condition, with some wear and tear.
Value-add opportunities
- Both roof replacement — A new roof will significantly improve the home's appearance and increase its value for both resale and rental.
- Both exterior painting and staining — Painting and staining the exterior will improve the home's curb appeal and increase its value for both resale and rental.
- Both landscaping and fencing repair — Trimming the landscaping and repairing the fencing will improve the home's curb appeal and increase its value for both resale and rental.
Renovation cost estimate screening
| Repair item | Severity | Est. cost |
|---|---|---|
| roof · The roof appears to be in poor condition, with visible wear and tear. | Major | $15,000–50,000 |
| exterior siding · The siding is in fair condition, with some discoloration and minor damage. | Moderate | $3,000–15,000 |
| landscaping · The landscaping is overgrown and in need of trimming. | Major | $15,000–50,000 |
| fencing · The fencing is in fair condition, with some wear and tear. | Moderate | $3,000–15,000 |
| Total estimated repair cost · 4 items | $36,000–130,000 |
Value-add ROI direction
- Both roof replacement — A new roof will significantly improve the home's appearance and increase its value for both resale and rental. ↑
- Both exterior painting and staining — Painting and staining the exterior will improve the home's curb appeal and increase its value for both resale and rental. ↑
- Both landscaping and fencing repair — Trimming the landscaping and repairing the fencing will improve the home's curb appeal and increase its value for both resale and rental. ↑
ⓘ Cost ranges are severity-bucket heuristics (US national rule-of-thumb). Get contractor quotes + a written scope before underwriting a rehab budget.
Schools (NCES district)
- District
- Cedar Rapids Community School District
- NCES district ID
- 1906540
- Math proficiency
- 50% ▼ -12.00%
- Reading proficiency
- 59% ▼ -6.00%
- Median HH income
- $53,568
- Composite
- 46.82/100
- National rank
- #2378
- State rank
- #265 of 289 in IA
Livability — Hiawatha
- Score
- 79/100
- State rank
- #93
- US rank
- #1983
Category grades
Schools grade is shown separately in the Schools card above.
Census & demographics
- Census place
- Hiawatha, IA
- City population
- 7,008
- Population (ZIP)
- 7,008
Population outlook (Linn County) Hauer SSP2
- Today (2025)
- 239,589 people
- By 2030
- 248,587 · +3.8%
- By 2040
- 264,817 · +10.5%
- By 2050
- 278,685 · +16.3%
- By 2075
- 311,754 · +30.1%
- By 2100
- 336,773 · +40.6%
Race, ethnicity, and origin ACS 2023
- Neighborhood character
- Predominantly White (80%)
- Race & ethnicity
- White 80% Asian 6% Two or more races 5% Black 4% Hispanic / Latino 4%
- Common ancestry
- Portuguese 6% Scottish 3% Iranian 1%
- Foreign-born
- 6% · China, Canada
- Languages at home
- 90% English-only · Other Indo-European 6% Spanish 3%
Political lean MEDSL · Linn
- 2024 margin
- Lean D (+9.9) · D 54.2% · R 44.3% · Other 1.4%
- 2008→2024 swing
- -11.6pp toward R · 2008: 21.5pp · 2024: 9.9pp
- All cycles
- 2024: D+9.9 2020: D+13.7 2016: D+9.0 2012: D+17.6 2008: D+21.5
Not yet ingested
- Civics
- —
Market trends
- HPI YoY
- ▼ -78.12%
- Current HPI
- 199.6054
- Rent YoY
- —
- Metro
- —
- State GDP YoY
- ▲ 2.48%
- F500 in state
- 4
Industry mix (Fortune 500 HQ in IA)
| Industry | F500 HQs | Revenue |
|---|---|---|
| Financial Services | 1 | $16B |
|
||
| Retail / Convenience | 1 | $15B |
|
||
Price history
+0.9% since first listed3 events — show timeline
- 2026-05-11 Sold (MLS) $161,500 CRAAR, CDRMLS
- 2026-03-08 Pending — CRAAR, CDRMLS
- 2026-03-05 Listed $160,000 CRAAR, CDRMLS
Cash-flow waterfall
monthlySold comps — $/sqft
last 12 mo · ≤1 miLoading sold comps…