35118 Country Rd · Marked Tree, AR
Flood risk 1/10 · Minimal
- FEMA flood zone
- X
- Chance of flooding over 30 yrs
- 0.0%
- Est. flood insurance / yr
- $507 – $1,088
Fire risk 1/10 · Minimal
- Est. fire insurance / yr
- $1,499 – $2,785
Heat risk 6/10 · Moderate
- Hot days now (above 109°F)
- 7 days/yr
- Hot days in 30 yrs
- 22 days/yr
Wind risk 4/10 · Minor
- Chance of severe wind over 30 yrs
- 18.0%
Air-quality risk 1/10 · Minimal
- Unhealthy air days now
- 0 days/yr
- Unhealthy air days in 30 yrs
- 0 days/yr
Risk factors via First Street. Map © Google.
Why this score? — see what drove the C grade
The composite is a weighted blend of 9 inputs, each scored 0–100. Each bar is that input's sub-score; the figure is the points it added to the 100-point composite (weight × sub-score).
- Cash flow +22.5/30.0
- ARV discount +7.5/15.0
- DSCR +7.2/10.0
- 1% rule +5.9/10.0
- Appreciation +5.0/10.0
- Livability +3.1/5.0
- Rent growth +2.5/5.0
- Schools +2.5/10.0
- Condition / age +2.5/5.0
$110,000
🖨 Deal sheet (PDF) 📄 Offer letter ✓ Due diligence
Listing remarks
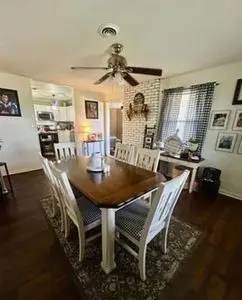
This is a cozy home on a county road about two miles outside of Marked Tree. It has been completely remodeled from the inside, new hot water heater in 2019, new gas lines in 2020, new appliances in 2023, all new lighting fixtures and ceiling fans in 2023, as well as new paint, cabinets, countertops, and LVT flooring. I have lived here for 32 years, raised two kids in this home, and hosted hundreds of large family get togethers over those years. The house does not have HVAC, but what it does have is very low cost utilities; the electric bill is never over $125 per month and is cheaper in winter. The water and garbage are $60 per month, and I spend about $50 per month on gas. It & acirc;
Key facts
- Completely remodeled
- New ceiling fans
- New hot water heater
Tags
Neighborhood map
What this means for you Summary
Snapshot
- This is a 3-bed/1.0-bath single-family listed at $110k.
Deal economics
- At list price, monthly cash flow is $186 ($2k/yr) — positive.
- The deal already cash-flows at list — no discount required.
- Meets the 1% rule at list price ($1k rent vs $110k).
- Recommended offer: $107k (3.0% below list) — sets the bar for market timing.
Location & tenants
- Location reads 61/100 on livability (#243 in AR) — a middle-class / working-renter tenant base. Strengths: cost of living A+, health & safety A, housing B+; Watch: schools D-, amenities F, commute F.
- Marked Tree School District (rural): math 33% / reading 28% proficiency, ranked #155 of 238 in AR (top 65%) — families likely to look elsewhere, expect single-tenant / working-renter base with shorter leases; 70% free/reduced lunch — lower-income household profile, screen leases tightly.
- Market conditions: 5 active listings in the ZIP; 67 units permitted in Poinsett County in 2024 (5 in 5+ unit buildings).
Forward outlook
- In year one you build about $4k of equity ($761 loan paydown + $3k appreciation (3.0% local appreciation)).
- Poinsett County population projected at -13% by 2050 — secular population decline; favor cash flow + early exit over multi-decade hold.
- At projected returns (3.0% appreciation + 3.0% rent growth), your $31k cash investment doubles in ~5 years — after that, you're playing with house money.
- By year 8, paydown + projected appreciation supports a ~$30k cash-out refi (75% LTV) — recoverable capital for the next deal without selling this one.
Negotiation context
- It's been on market 32 days — a 3% lower offer ($107k) is reasonable based on typical stale-listing flexibility.
- 2 sale attempts with the ask held roughly flat each time — persistent listings suggest the price (not the market) is what's stuck; bring a comps-based counter.
- Current owner paid $15k; list at $110k implies a 633% gain — meaningful room to come down on a strong offer.
Risks & watch-outs
- Climate carrying-cost: extreme-heat days projected 7→22/yr by 2055 (HVAC capex compounding) — expect insurance premiums to compound above CPI over the hold.
Questions for the listing agent
- It's been on market 32 days. Have you received any prior offers? Is the seller open to a 3% concession, seller financing, or rate buy-down credit?
- Built in 1972 — when were the roof, HVAC, electrical panel, plumbing, and water heater last replaced?
- Is there a deadline driving the sale (1031 exchange, divorce, estate, relocation)? That informs how much negotiation room exists.
- Schools are D-rated, which usually means shorter tenancies and higher turnover. Who's the typical renter profile here, and what's been the actual vacancy rate?
- What's the average days-on-market for RENTAL listings here right now (not sales)? A rising rental-DOM trend means longer vacancies and softer asking-rent achievability than the comps imply.
- What's the recent tenant-quality profile in this submarket — average credit score on applications, eviction rate, late-payment / NSF rate, and stable-employment percentage? A property-management company in the area should have these aggregated.
- How much new for-sale + rental construction is in the pipeline within 1–3 miles? Heavy new supply typically softens prices + rents 12–24 months out; constrained supply supports both.
Investment metrics
- 1% rule
- 1.09% ✓
- Cap rate
- 8.32%
- Cash-on-cash
- 7.24%
- DSCR
- 1.32
- GRM
- 7.7
CMA / ARV
No comps found within radius.
Projected returns pro-forma
3.0% appreciation · 3.0% rent growth · sell at horizon
- IRR
- 14.3%
- Equity multiple
- 1.81×
- Total profit
- $25,097
- Equity at exit
- $49,461
- IRR
- 16.1%
- Equity multiple
- 3.36×
- Total profit
- $72,809
- Equity at exit
- $76,225
Cash invested: $30,800 (down + closing). Projections, not guarantees.
Landlord ↔ Tenant lean methodology
- Overall (STATE)
- 92 Strongly Landlord-Friendly
- State Arkansas
- 92 Strongly Landlord-Friendly · R+14
- County
- — inherits STATE
- City
- — inherits STATE
ZIP-level market 72386
- Active inventory
- 5
- Price-to-rent
- 7.7×
Monthly cashflow live
- Estimated rent
- $1,197 medium interval (Pro) →
- Mortgage (P&I)
- −$577
- Tax est. 1.5%
- −$138 /mo · $1,650/yr
- Insurance
- −$46
- HOA
- −$0
- Vacancy / Maint / Mgmt
- −$251
- Net cashflow
- $186
Break-even live
Sensitivity live
| Price | -10% $262 | -5% $224 | +0% $186 | +5% $148 | +10% $110 |
|---|---|---|---|---|---|
| Rent | -10% $91 | -5% $138 | +0% $186 | +5% $233 | +10% $280 |
| Rate | -1.0pp $241 | -0.5pp $214 | base $186 | +0.5pp $157 | +1.0pp $128 |
UW: 25.0% down · 7.5% · 30yr · 1.5% tax · 5.0% vac · 8.0% maint · 8.0% mgmt
Financing live
Cash to close
- Down payment
- $27,500
- Closing costs
- $3,300
- Reserves months
- —
- Total cash needed
- —
Loan-product check · same deal, 3 products live
Conventional
25% down · 7.5% · 30yr
- Down + closing
- —
- Monthly P&I
- —
- Monthly cashflow
- —
- DSCR
- —
- Eligible?
- —
Personal DTI + credit; lowest rate.
DSCR
20% down · 8.5% · 30yr
- Down + closing
- —
- Monthly P&I
- —
- Monthly cashflow
- —
- DSCR
- —
- Eligible?
- —
No personal income docs; deal must DSCR.
Hard money
10% down · 12.0% · 12mo
- Down + closing
- —
- Monthly P&I
- —
- Monthly cashflow
- —
- DSCR
- —
- Eligible?
- —
Short-term bridge; refi at stabilization.
Listing history 22 events
-
2026-06-19days on market $110,000 Active 32 DOM
-
2026-06-18days on market $110,000 Active 31 DOM
-
2026-06-17days on market $110,000 Active 30 DOM
-
2026-06-16days on market $110,000 Active 29 DOM
-
2026-06-15days on market $110,000 Active 28 DOM
-
2026-06-14days on market $110,000 Active 26 DOM
-
2026-06-12days on market $110,000 Active 25 DOM
-
2026-06-09days on market $110,000 Active 22 DOM
-
2026-06-08days on market $110,000 Active 21 DOM
-
2026-06-07days on market $110,000 Active 20 DOM
-
2026-06-07days on market $110,000 Active 19 DOM
-
2026-06-04days on market $110,000 Active 16 DOM
-
2026-06-02days on market $110,000 Active 15 DOM
-
2026-06-01days on market $110,000 Active 14 DOM
-
2026-05-31days on market $110,000 Active 13 DOM
-
2026-05-31days on market $110,000 Active 12 DOM
-
2026-05-19$110,000 Active
-
2026-04-02price $120,000
-
2026-02-03price $132,000
-
2025-11-11price $142,000
-
2025-11-02$160,000 Active
-
1996-07-23soldstatus $15,000
ⓘ Source: listings_history table (triggers on properties + properties_extension) + one-shot
backfill from property_details.listing_events for pre-trigger history.
Climate risk First Street
- Flood 1/10 Low FEMA zone X · 0% chance over 30 yrs
- Wildfire 1/10 Low
- Heat 6/10 Major 7 d/yr ≥109°F today · 22 d/yr by 30 yrs out
- Wind 4/10 Moderate 18% chance of damaging wind over 30 yrs
- Air quality 1/10 Low 0 unhealthy d/yr today · 0 by 30 yrs out
Nearby sold comps map
Loading sold comps map…
Walkable amenities ~0.75 mi
Loading nearby amenities…
Taxation est. · year 1
- Rental income
- $14,368
- − Mortgage interest
- −$6,162
- − Property taxes
- −$1,650
- − Insurance
- −$550
- − Repairs & maintenance
- −$1,149
- − Management
- −$1,149
- − Depreciation
- −$3,200
- Taxable income
- $507
- Est. tax owed @ 24.0%
- −$122
- After-tax cash flow
- $2,107/yr
For passive investors: Depreciation is non-cash, so a rental often shows a tax loss while cash-flowing — sheltering income. Rental losses are passive: they offset passive income freely, and up to $25,000/yr can offset ordinary (W-2) income if you actively participate and your MAGI is under $100k (phasing out to $0 by $150k); unused losses carry forward. On sale, claimed depreciation is recaptured at up to 25%, and gains may owe capital-gains tax (a 1031 exchange can defer both). Figures are a year-1 estimate at your 24.0% rate — not tax advice; consult a CPA.
Schools (NCES district)
- District
- Marked Tree School District
- NCES district ID
- 0509420
- Math proficiency
- 33% ▼ -7.00%
- Reading proficiency
- 28% ▼ -6.00%
- Median HH income
- $31,151
- Composite
- 24.85/100
- National rank
- #7588
- State rank
- #155 of 238 in AR
Livability — Marked Tree
- Score
- 61/100
- State rank
- #243
- US rank
- #17926
Category grades
Schools grade is shown separately in the Schools card above.
Census & demographics
- Population (ZIP)
- 1,385
Population outlook (Poinsett County) Hauer SSP2
- Today (2025)
- 22,998 people
- By 2030
- 22,356 · -2.8%
- By 2040
- 21,150 · -8.0%
- By 2050
- 20,035 · -12.9%
- By 2075
- 17,745 · -22.8%
- By 2100
- 15,358 · -33.2%
Race, ethnicity, and origin ACS 2023
- Neighborhood character
- Predominantly White (90%)
- Race & ethnicity
- White 90% Two or more races 6% Black 4%
- Common ancestry
- Lithuanian 2% Slovak 1% Serbian 1%
- Foreign-born
- 1% · Canada
- Languages at home
- 99% English-only · Spanish 1%
Political lean MEDSL · Poinsett
- 2024 margin
- Solid R (+63.5) · D 17.4% · R 81.0% · Other 1.6%
- 2008→2024 swing
- -36.3pp toward R · 2008: -27.2pp · 2024: -63.5pp
- All cycles
- 2024: R+63.5 2020: R+59.8 2016: R+24.1 2012: R+34.2 2008: R+27.2
Not yet ingested
- Civics
- —
Market trends
- HPI YoY
- —
- Current HPI
- —
- Rent YoY
- —
- Metro
- —
- State GDP YoY
- ▲ 3.80%
- F500 in state
- 10
Industry mix (Fortune 500 HQ in AR)
| Industry | F500 HQs | Revenue |
|---|---|---|
| Retail | 1 | $681B |
|
||
| Food / Agriculture | 1 | $53B |
|
||
| Retail / Energy | 1 | $22B |
|
||
| Transportation / Logistics | 1 | $12B |
|
||
| Energy | 1 | $4B |
|
||
Price history
+633.3% since first listed6 events — show timeline
- 2026-05-19 Listed $110,000 FSBO.com
- 2026-04-02 Price Changed $120,000 NEABOR MLS
- 2026-02-03 Price Changed $132,000 NEABOR MLS
- 2025-11-11 Price Changed $142,000 NEABOR MLS
- 2025-11-02 Listed $160,000 NEABOR MLS
- 1996-07-23 Sold (Public Records) $15,000 Public Records
Property tax history
-1.6%/yrLatest (2025): $18 · +0.0% YoY. Source: county tax records.
Cash-flow waterfall
monthlySold comps — $/sqft
last 12 mo · ≤1 miLoading sold comps…