 🏗️ New Construction
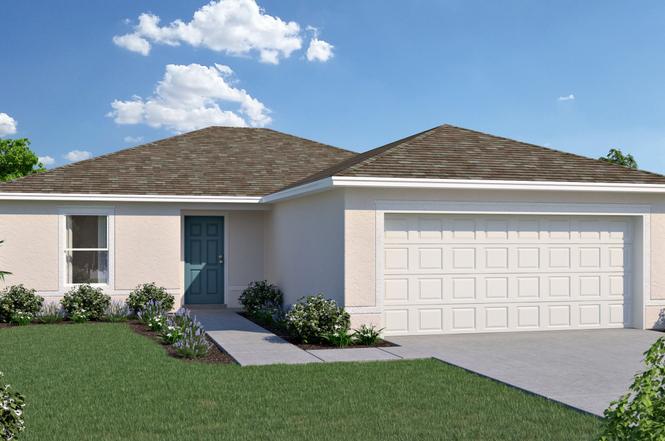
Pindo Plan · Dundee, FL
Flood risk 1/10 · Minimal
- FEMA flood zone
- X (unshaded)
- Chance of flooding over 30 yrs
- 0.0%
- Est. flood insurance / yr
- $507 – $1,088
Fire risk 5/10 · Moderate
- Est. fire insurance / yr
- $947 – $1,759
Heat risk 9/10 · Severe
- Hot days now (above 108°F)
- 7 days/yr
- Hot days in 30 yrs
- 25 days/yr
Wind risk 10/10 · Severe
- Chance of severe wind over 30 yrs
- 99.0%
Air-quality risk 1/10 · Minimal
- Unhealthy air days now
- 0 days/yr
- Unhealthy air days in 30 yrs
- 0 days/yr
Risk factors via First Street. Map © Google.
Why this score? — see what drove the D grade
The composite is a weighted blend of 9 inputs, each scored 0–100. Each bar is that input's sub-score; the figure is the points it added to the 100-point composite (weight × sub-score).
- Appreciation +10.0/10.0
- ARV discount +7.5/15.0
- Cash flow +7.4/30.0
- Schools +3.5/10.0
- Livability +3.2/5.0
- Rent growth +2.5/5.0
- Condition / age +2.5/5.0
- 1% rule +2.1/10.0
- DSCR +1.6/10.0
$281,990
🖨 Deal sheet 📄 Offer letter ✓ Due diligence
Listing remarks
Welcome to the Pindo floorplan, an offering from our Value collection. Step inside and experience the open and airy ambiance created by the long view from the front door to the sliding glass doors at the back of the home. Natural light floods the space, providing a refreshing atmosphere. This thoughtfully designed home features two bedrooms and a bathroom on one side, offering comfort and convenience. On the other side, you'll find the private and spacious Owners Suite, ensuring a tranquil retreat. The open kitchen boasts a breakfast bar and generous countertops, perfect for meal preparation and entertaining. Ample cabinet space allows for easy organization and storage of all your kitchen e
Key facts
- Private owners suite
- Generous countertops
- Ample cabinet space
Tags
Property features AI
Finance
- Other: Address: 208 Spindlewood Blvd, Dundee FL 33838; Status: Active; Last modified: 2026-05-22
- Financial info: List price $289,990
Exterior
- Parking: 2 garage spaces (2 total parking spaces)
- Home design: Single-family plan named Pindo; New construction plan
- Exterior features: Living area about 1,250 (listed)
Interior
- Bedrooms: 3 bedrooms
- Bathrooms: 2 full bathrooms
- Interior features: Open living area (approximate size provided separately)
Neighborhood map
What this means for you Summary
Snapshot
- This is a 3-bed/2.0-bath single-family listed at $282k.
Deal economics
- At list price, monthly cash flow is $-358 ($-4k/yr) — negative.
- To cash-flow at today's rent, offer at most $230k (18.4% below list).
- To meet the 1% rule (rent ≥ 1% of price), the offer needs to be $201k (28.6% below list).
- Recommended offer: $201k (28.6% below list) — sets the bar for 1% rule.
Location & tenants
- Location reads 65/100 on livability (#638 in FL) — a middle-class / working-renter tenant base. Strengths: cost of living A+, housing A+, crime B+; Watch: employment D+, schools D, amenities F.
- Polk (suburban): math 39% / reading 43% proficiency, ranked #62 of 73 in FL (top 85%) — families likely to look elsewhere, expect single-tenant / working-renter base with shorter leases.
- Market conditions: 149 active listings in the ZIP; 2 comparable units currently listed for rent nearby; 10,384 units permitted in Polk County in 2024 (1,716 in 5+ unit buildings).
Forward outlook
- In year one you build about $30k of equity ($2k loan paydown + $28k appreciation (10.0% local appreciation)).
- Polk County population projected at +33% by 2050 — long-run rental-demand tailwind backs the buy-and-hold thesis.
- By year 2, paydown + projected appreciation supports a ~$48k cash-out refi (75% LTV) — recoverable capital for the next deal without selling this one.
Negotiation context
- It's been on market 134 days — a 12% lower offer ($248k) is reasonable based on typical stale-listing flexibility.
Risks & watch-outs
- Climate carrying-cost: severe wind risk, 99% chance of damaging wind over 30y; moderate wildfire risk; extreme-heat days projected 7→25/yr by 2055 (HVAC capex compounding) — expect insurance premiums to compound above CPI over the hold.
Questions for the listing agent
- What do current leases actually rent for vs. the listed asking? Can we see a recent rent roll and the last 12 months of T-12 income?
- It's been on market 134 days. Have you received any prior offers? Is the seller open to a 29% concession, seller financing, or rate buy-down credit?
- Why hasn't it sold? Are there any deal-killer items the seller is aware of (foundation, flood, title, zoning, code violations)?
- Is there a deadline driving the sale (1031 exchange, divorce, estate, relocation)? That informs how much negotiation room exists.
- Schools are D-rated, which usually means shorter tenancies and higher turnover. Who's the typical renter profile here, and what's been the actual vacancy rate?
- The area grade is low — what's the realistic commute time and amenity access for the typical tenant pool here? Any planned neighborhood developments (good or bad) we should know about?
- What's the average days-on-market for RENTAL listings here right now (not sales)? A rising rental-DOM trend means longer vacancies and softer asking-rent achievability than the comps imply.
- What's the recent tenant-quality profile in this submarket — average credit score on applications, eviction rate, late-payment / NSF rate, and stable-employment percentage? A property-management company in the area should have these aggregated.
- How much new for-sale + rental construction is in the pipeline within 1–3 miles? Heavy new supply typically softens prices + rents 12–24 months out; constrained supply supports both.
Investment metrics
- 1% rule
- 0.71% ✗
- Cap rate
- 4.77%
- Cash-on-cash
- -5.44%
- DSCR
- 0.76
- GRM
- 11.7
CMA / ARV
No comps found within radius.
Projected returns pro-forma
10.0% appreciation · 3.0% rent growth · sell at horizon
- IRR
- 20.4%
- Equity multiple
- 2.66×
- Total profit
- $130,826
- Equity at exit
- $254,039
- IRR
- 18.6%
- Equity multiple
- 6.11×
- Total profit
- $403,238
- Equity at exit
- $547,845
Cash invested: $78,957 (down + closing). Projections, not guarantees.
Landlord ↔ Tenant lean methodology
- Overall (STATE)
- 87 Strongly Landlord-Friendly
- State Florida
- 87 Strongly Landlord-Friendly · R+3
- County
- — inherits STATE
- City
- — inherits STATE
ZIP-level market 33838
- Home prices YoY
- 17.6%
- Active inventory
- 149
- Price-to-rent
- 11.7×
Monthly cashflow live
- Estimated rent
- $2,014 medium interval (Pro) →
- Mortgage (P&I)
- −$1,479
- Tax est. 1.5%
- −$352 /mo · $4,230/yr
- Insurance
- −$117
- HOA
- −$0
- Vacancy / Maint / Mgmt
- −$423
- Net cashflow
- $-358
Break-even live
UW: 25.0% down · 7.5% · 30yr · 1.5% tax · 5.0% vac · 8.0% maint · 8.0% mgmt
Financing live
Cash to close
- Down payment
- $70,498
- Closing costs
- $8,460
- Reserves months
- —
- Total cash needed
- —
Loan-product check · same deal, 3 products live
Conventional
25% down · 7.5% · 30yr
- Down + closing
- —
- Monthly P&I
- —
- Monthly cashflow
- —
- DSCR
- —
- Eligible?
- —
Personal DTI + credit; lowest rate.
DSCR
20% down · 8.5% · 30yr
- Down + closing
- —
- Monthly P&I
- —
- Monthly cashflow
- —
- DSCR
- —
- Eligible?
- —
No personal income docs; deal must DSCR.
Hard money
10% down · 12.0% · 12mo
- Down + closing
- —
- Monthly P&I
- —
- Monthly cashflow
- —
- DSCR
- —
- Eligible?
- —
Short-term bridge; refi at stabilization.
Rent comps 2 comps
| Address | Beds | Baths | Sqft | Rent | $/sqft | DOM | Units | Dist |
|---|---|---|---|---|---|---|---|---|
| 29 Coyer Rd Unit 2 Haines City, FL | 2.0 | 2.0 | 1008 | $2,000 | $1.98 | 23d | 1 | 0.47mi |
| 2163 Mandarin Loop Dundee, FL | 3.0 | 2.0 | 1688 | $2,049 | $1.21 | 3d | 1 | 1.08mi |
Listing history 13 events
-
2026-06-18days on market $281,990 Active 134 DOM
-
2026-06-17days on market $281,990 Active 133 DOM
-
2026-06-16days on market $281,990 Active 132 DOM
-
2026-06-15days on market $281,990 Active 131 DOM
-
2026-06-13days on market $281,990 Active 129 DOM
-
2026-06-10days on market $281,990 Active 126 DOM
-
2026-06-09days on market $281,990 Active 125 DOM
-
2026-06-08days on market $281,990 Active 124 DOM
-
2026-06-07days on market $281,990 Active 123 DOM
-
2026-06-05pricedays on market $281,990 Active 120 DOM
-
2026-06-03days on market $264,990 Active 118 DOM
-
2026-06-01days on market $264,990 Active 117 DOM
-
2026-05-31days on market $264,990 Active 116 DOM
ⓘ Source: listings_history table (triggers on properties + properties_extension) + one-shot
backfill from property_details.listing_events for pre-trigger history.
Climate risk First Street
- Flood 1/10 Low FEMA zone X (unshaded) · 0% chance over 30 yrs
- Wildfire 5/10 Major
- Heat 9/10 Extreme 7 d/yr ≥108°F today · 25 d/yr by 30 yrs out
- Wind 10/10 Extreme 99% chance of damaging wind over 30 yrs
- Air quality 1/10 Low 0 unhealthy d/yr today · 0 by 30 yrs out
Nearby sold comps map
Loading sold comps map…
Walkable amenities ~0.75 mi
Loading nearby amenities…
Taxation est. · year 1
- Rental income
- $24,168
- − Mortgage interest
- −$15,796
- − Property taxes
- −$4,230
- − Insurance
- −$1,410
- − Repairs & maintenance
- −$1,933
- − Management
- −$1,933
- − Depreciation
- −$8,203
- Taxable loss
- −$9,338
- Est. tax savings @ 24.0%
- +$2,241
- After-tax cash flow
- $-2,052/yr
For passive investors: Depreciation is non-cash, so a rental often shows a tax loss while cash-flowing — sheltering income. Rental losses are passive: they offset passive income freely, and up to $25,000/yr can offset ordinary (W-2) income if you actively participate and your MAGI is under $100k (phasing out to $0 by $150k); unused losses carry forward. On sale, claimed depreciation is recaptured at up to 25%, and gains may owe capital-gains tax (a 1031 exchange can defer both). Figures are a year-1 estimate at your 24.0% rate — not tax advice; consult a CPA.
Schools (NCES district)
- District
- Polk
- NCES district ID
- 1201590
- Math proficiency
- 39% ▼ -11.00%
- Reading proficiency
- 43% ▼ -4.00%
- Median HH income
- $43,979
- Composite
- 34.74/100
- National rank
- #5132
- State rank
- #62 of 73 in FL
Livability — Dundee
- Score
- 65/100
- State rank
- #638
- US rank
- #12542
Category grades
Schools grade is shown separately in the Schools card above.
Census & demographics
- Census place
- Dundee, FL
- City population
- 5,431
- Population (ZIP)
- 5,431
Population outlook (Polk County) Hauer SSP2
- Today (2025)
- 752,975 people
- By 2030
- 804,621 · +6.9%
- By 2040
- 906,117 · +20.3%
- By 2050
- 1,000,476 · +32.9%
- By 2075
- 1,197,520 · +59.0%
- By 2100
- 1,271,518 · +68.9%
Race, ethnicity, and origin ACS 2023
- Neighborhood character
- Diverse neighborhood (Simpson 0.63)
- Race & ethnicity
- Hispanic / Latino 50% White 30% Black 14% Two or more races 7% Asian 3%
- Hispanic origin (detail)
- Mexican 14% Puerto Rican 19% Dominican 6%
- Common ancestry
- Portuguese 1%
- Foreign-born
- 18% · Canada, Guatemala
- Languages at home
- 53% English-only · Spanish 47%
Political lean MEDSL · Polk
- 2024 margin
- Strong R (+20.7) · D 39.2% · R 59.9%
- 2008→2024 swing
- -14.6pp toward R · 2008: -6.1pp · 2024: -20.7pp
- All cycles
- 2024: R+20.7 2020: R+14.4 2016: R+14.1 2012: R+6.8 2008: R+6.1
Not yet ingested
- Civics
- —
Market trends
- HPI YoY
- ▲ 54.34%
- Current HPI
- 363.9764
- Rent YoY
- —
- Metro
- —
- State GDP YoY
- ▲ 3.28%
- F500 in state
- 36
Industry mix (Fortune 500 HQ in FL)
| Industry | F500 HQs | Revenue |
|---|---|---|
| Industrial Technology | 2 | $29B |
|
||
| Insurance | 2 | $17B |
|
||
| Retail | 1 | $60B |
|
||
| Technology Distribution | 1 | $58B |
|
||
| Homebuilding | 1 | $35B |
|
||
| Technology Manufacturing | 1 | $35B |
|
||
Cash-flow waterfall
monthlySold comps — $/sqft
last 12 mo · ≤1 miLoading sold comps…