 Duplex
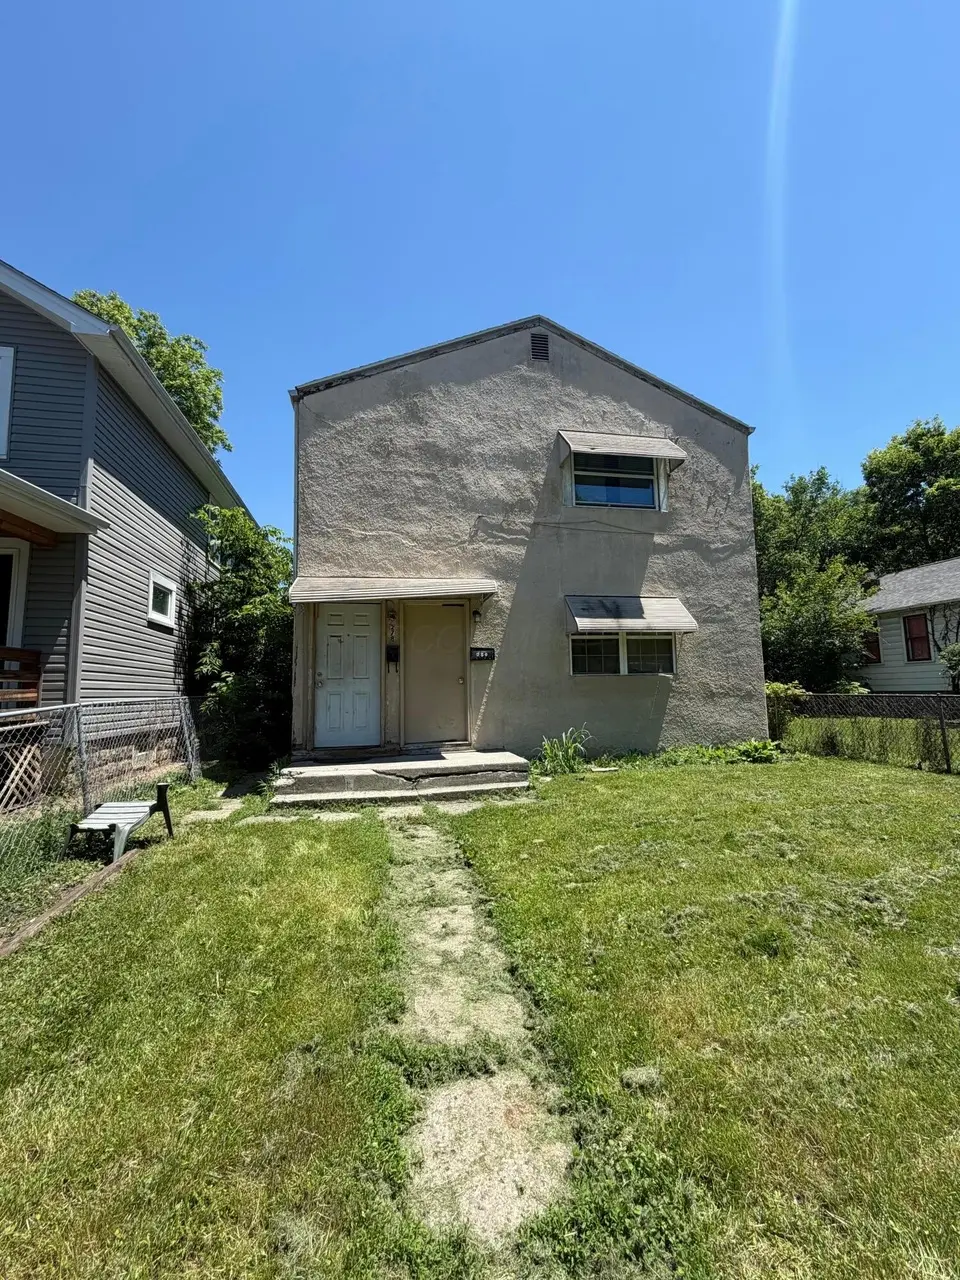
278-280 Brehl Ave · Columbus, OH
Flood risk 5/10 · Moderate
- FEMA flood zone
- X
- Chance of flooding over 30 yrs
- 0.49%
- Est. flood insurance / yr
- $473 – $860
Fire risk 1/10 · Minimal
- Est. fire insurance / yr
- $713 – $1,323
Heat risk 4/10 · Minor
- Hot days now (above 100°F)
- 7 days/yr
- Hot days in 30 yrs
- 18 days/yr
Wind risk 2/10 · Minimal
- Chance of severe wind over 30 yrs
- 1.0%
Air-quality risk 3/10 · Minor
- Unhealthy air days now
- 2 days/yr
- Unhealthy air days in 30 yrs
- 4 days/yr
Risk factors via First Street. Map © Google.
Why this score? — see what drove the A grade
The composite is a weighted blend of 9 inputs, each scored 0–100. Each bar is that input's sub-score; the figure is the points it added to the 100-point composite (weight × sub-score).
- Cash flow +30.0/30.0
- ARV discount +15.0/15.0
- 1% rule +10.0/10.0
- DSCR +10.0/10.0
- Appreciation +10.0/10.0
- Livability +4.0/5.0
- Rent growth +2.5/5.0
- Condition / age +2.5/5.0
- Schools +1.7/10.0
$129,900
🖨 Deal sheet 📄 Offer letter ✓ Due diligence
Multi-family units
County records classify this as Multi-Family (2-4 Unit). Listing-text estimate: 2 units. confirmed
Listing remarks MLS
FANTASTIC BELOW MARKET OPPORTUNITY! HUGE CASH FLOW POTENTIAL! 2-2 BEDROOM UP AND DOWN DUPLEX THAT NEEDS SOME WORK. GREAT RETURN ON INVESTMENT ONCE YOU COMPLETE THE REPAIRS. BANK OWNED! BEING SOLD 'AS-IS'.
Key facts
- Hot water tank
- New water line
- New furnace
Tags
Property features AI
Finance
- Financial info: Annual property tax reported
Exterior
- Utilities: Public water; Public sewer; Electricity available; Water available
- Home design: Duplex; Built in 1956
- Exterior features: Lot approximately 0.09 acres
Interior
- Heating & cooling: Forced air heating
- Interior features: Forced air heating
Neighborhood map
What this means for you Summary
Snapshot
- This is a 2 × 2-bed/1-bath units multifamily listed at $130k.
Deal economics
- At list price, monthly cash flow is $1k ($12k/yr) — positive. Per door: $506/mo.
- The deal already cash-flows at list — no discount required.
- Meets the 1% rule at list price ($2k rent vs $130k).
- Cap rate 15.6% vs local median 3.8% in Columbus — top-decile yield for the area; either an underpriced asset or a hidden risk that comps aren't pricing in. Stress-test before assuming the spread holds.
Location & tenants
- Location reads 81/100 on livability (#97 in OH, #1,491 nationally) — a professional / high-income tenant draw. Strengths: commute A+, cost of living A+, housing A+; Watch: employment C-, crime F.
- Columbus City School District (urban): math 15% / reading 26% proficiency, ranked #626 of 656 in OH (top 95%) — low school quality limits family demand, transient renter base, plan for 1-2y turnover; 72% free/reduced lunch — lower-income household profile, screen leases tightly.
- Market conditions: 50 active listings in the ZIP; 40 comparable units currently listed for rent nearby; rentals at typical pace (median 20d on market — plan ~3-4 weeks tenant-placement turnaround); lower-income renter base — watch delinquency; 8,139 units permitted in Franklin County in 2024 (5,940 in 5+ unit buildings).
- At $2,448/mo this rent would consume 91% of the median local household income ($32k/yr) (locally 126% of renters already pay >50% of income on rent) — very limited rent-growth headroom before tenants either downsize or default.
Forward outlook
- In year one you build about $14k of equity ($898 loan paydown + $13k appreciation (10.0% local appreciation)).
- Franklin County population projected at +34% by 2050 — long-run rental-demand tailwind backs the buy-and-hold thesis.
- At projected returns (10.0% appreciation + 3.0% rent growth), your $36k cash investment doubles in ~2 years — after that, you're playing with house money.
- By year 3, paydown + projected appreciation supports a ~$35k cash-out refi (75% LTV) — recoverable capital for the next deal without selling this one.
Negotiation context
- Only 14 days on market — expect competitive offers; lowballing is unlikely to land.
- 2 sale attempts since 24y ago with the ask held roughly flat each time — persistent listings suggest the price (not the market) is what's stuck; bring a comps-based counter.
- Current owner paid $31k; list at $130k implies a 319% gain — meaningful room to come down on a strong offer.
Risks & watch-outs
- Watch-outs: built in 1956 — expect roof / HVAC / electrical / plumbing capex.
- Climate carrying-cost: moderate flood risk — expect insurance premiums to compound above CPI over the hold.
Questions for the listing agent
- Can we see the unit-by-unit rent roll, current vacancy, and any below-market leases? What's the average tenancy length?
- What capital expenditures (roof, boiler, parking lot, exteriors) have been made in the last 5 years, and what's planned in the next 2?
- Built in 1956 — when were the roof, HVAC, electrical panel, plumbing, and water heater last replaced?
- Is there a deadline driving the sale (1031 exchange, divorce, estate, relocation)? That informs how much negotiation room exists.
- Crime grade is F in this area — have there been break-ins, vandalism, or insurance claims at this property in the last 3 years? What carrier currently insures it and at what premium?
- What's the average days-on-market for RENTAL listings here right now (not sales)? A rising rental-DOM trend means longer vacancies and softer asking-rent achievability than the comps imply.
- What's the recent tenant-quality profile in this submarket — average credit score on applications, eviction rate, late-payment / NSF rate, and stable-employment percentage? A property-management company in the area should have these aggregated.
- How much new apartment / multifamily construction is in the pipeline within 1–3 miles? Heavy new supply (>2% of stock underway) typically softens rents 12–24 months out; light construction supports rent growth.
Investment metrics
- 1% rule
- 1.88% ✓
- Cap rate
- 15.64%
- Cash-on-cash
- 33.37%
- DSCR
- 2.48
- GRM
- 4.4
CMA / ARV
- ARV (on-the-fly)
- $242,688
- Comps found
- 5
Show comp detail 5 sales within ~0.75 mi
| Address | Dist | Beds/Ba | Sqft | Sold | Price | $/sf | Match |
|---|---|---|---|---|---|---|---|
| 1340-1342 W State St | 0.27mi | 4/— | 1,488 (-3%) | 8mo | $235,000 | $158 | 76 |
| 270-272 S Yale Ave | 0.27mi | 4/— | 1,560 (+2%) | 14mo | $275,000 | $176 | 73 |
| 266-288 S Yale Ave | 0.27mi | 4/— | 1,560 (+2%) | 20mo | $270,000 | $173 | 68 |
| 40 Wisconsin Ave | 0.50mi | 3/— (-1) | 1,592 (+4%) | 12mo | $110,000 | $69 | 56 |
| 1473 Thomas Ave | 0.36mi | 4/— | 1,668 (+9%) | 23mo | $200,000 | $120 | 49 |
Match score weights: distance 35% · size 25% · config 20% · recency 20%. Top-matched comps best support the ARV.
Projected returns pro-forma
10.0% appreciation · 3.0% rent growth · sell at horizon
- IRR
- 49.8%
- Equity multiple
- 4.72×
- Total profit
- $135,219
- Equity at exit
- $117,024
- IRR
- 43.5%
- Equity multiple
- 10.56×
- Total profit
- $347,642
- Equity at exit
- $252,367
Cash invested: $36,372 (down + closing). Projections, not guarantees.
Landlord ↔ Tenant lean methodology
- Overall (STATE)
- 73 Landlord-Friendly
- State Ohio
- 73 Landlord-Friendly · R+6
- County
- — inherits STATE
- City
- — inherits STATE
ZIP-level market 43222
- Active inventory
- 50
- Price-to-rent
- 8.8×
Monthly cashflow live
- Estimated rent
- $2,448 high interval (Pro) →
- Mortgage (P&I)
- −$681
- Tax from tax record
- −$187 /mo · $2,246/yr
- Insurance
- −$54
- HOA
- −$0
- Vacancy / Maint / Mgmt
- −$514
- Net cashflow
- $1,011
Break-even live
2-unit breakdown (identical units grouped — click to expand)
| Units | Beds | Baths | Est. rent |
|---|---|---|---|
| 2× units | 2 | 1 | $2,448 |
| #1 | 2 | 1 | $1,224 |
| #2 | 2 | 1 | $1,224 |
| Total (2 units) | $2,448 | ||
UW: 25.0% down · 7.5% · 30yr · 1.5% tax · 5.0% vac · 8.0% maint · 8.0% mgmt
Financing live
Cash to close
- Down payment
- $32,475
- Closing costs
- $3,897
- Reserves months
- —
- Total cash needed
- —
Loan-product check · same deal, 3 products live
Conventional
25% down · 7.5% · 30yr
- Down + closing
- —
- Monthly P&I
- —
- Monthly cashflow
- —
- DSCR
- —
- Eligible?
- —
Personal DTI + credit; lowest rate.
DSCR
20% down · 8.5% · 30yr
- Down + closing
- —
- Monthly P&I
- —
- Monthly cashflow
- —
- DSCR
- —
- Eligible?
- —
No personal income docs; deal must DSCR.
Hard money
10% down · 12.0% · 12mo
- Down + closing
- —
- Monthly P&I
- —
- Monthly cashflow
- —
- DSCR
- —
- Eligible?
- —
Short-term bridge; refi at stabilization.
Rent comps 40 comps
| Address | Beds | Baths | Sqft | Rent | $/sqft | DOM | Units | Dist |
|---|---|---|---|---|---|---|---|---|
| 394 S Guilford Ave Columbus, OH | 3.0 | 1.5 | 1404 | $1,450 | $1.03 | 7d | 1 | 0.18mi |
| 189 W Park Ave Unit 189 Columbus, OH | 3.0 | 2.0 | 1276 | $1,395 | $1.09 | 7d | 1 | 0.23mi |
| 120 S Central Ave Columbus, OH | 1.0–3.0 | 1.0–2.0 | 944 | $1,295 | $1.37 | 14d | 12 | 0.24mi |
| 432 Catherine St Columbus, OH | 3.0 | 1.0 | 1073 | $1,325 | $1.23 | 12d | 1 | 0.42mi |
| 432 Catherine St Columbus, OH | 3.0 | 1.0 | 1073 | $1,325 | $1.23 | 14d | 1 | 0.42mi |
| 153 S Cypress Ave Columbus, OH | 3.0 | 1.0 | 1472 | $1,650 | $1.12 | 7d | 1 | 0.45mi |
| 51 N Princeton Ave Columbus, OH | 3.0 | 1.0 | 1188 | $1,175 | $0.99 | 23d | 1 | 0.49mi |
| 135-137 Dakota Ave Unit 135 Columbus, OH | 3.0 | 1.5 | 2200 | $1,800 | $0.82 | 43d | 1 | 0.51mi |
| 32 Schultz Ave Columbus, OH | 3.0 | 1.0 | 1218 | $1,250 | $1.03 | 21d | 1 | 0.52mi |
| 58 Stevens Ave Columbus, OH | 3.0 | 1.0 | 1176 | $1,250 | $1.06 | 43d | 1 | 0.53mi |
| 158 Dakota Ave Columbus, OH | 4.0 | 2.0 | 1800 | $2,045 | $1.14 | 7d | 1 | 0.53mi |
| 125 Avondale Ave Columbus, OH | 3.0 | 1.5 | 1344 | $1,695 | $1.26 | 43d | 1 | 0.58mi |
| 85 N Yale Ave Columbus, OH | 3.0 | 1.0 | 1215 | $1,100 | $0.91 | 7d | 1 | 0.60mi |
| 85 N Yale Ave Columbus, OH | 3.0 | 1.0 | 1215 | $1,100 | $0.91 | 19d | 1 | 0.60mi |
| 137 N Guilford Ave Columbus, OH | 4.0 | 2.0 | 1456 | $1,850 | $1.27 | 43d | 1 | 0.63mi |
| 378 Hawkes Ave Columbus, OH | 3.0 | 2.0 | 1200 | $1,649 | $1.37 | 23d | 1 | 0.63mi |
| 162 Wisconsin Ave Columbus, OH | 4.0 | 2.5 | 1930 | $1,900 | $0.98 | 43d | 1 | 0.69mi |
| 488 Woodbury Ave Columbus, OH | 3.0 | 1.5 | 1222 | $1,250 | $1.02 | 43d | 1 | 0.72mi |
| 76 Rodgers Ave Columbus, OH | 3.0 | 1.5 | 1422 | $1,695 | $1.19 | 23d | 1 | 0.74mi |
| 60 Martin Ave Columbus, OH | 3.0 | 2.0 | 1807 | $1,650 | $0.91 | 23d | 1 | 0.75mi |
| 543 Woodbury Ave Unit NA Columbus, OH | 3.0 | 1.0 | 1308 | $1,645 | $1.26 | 14d | 1 | 0.77mi |
| 228 Schultz Ave Unit 1407033P Columbus, OH | 5.0 | 1.5 | 1991 | $5,806 | $2.92 | 7d | 1 | 0.78mi |
| 228 Schultz Ave Unit 1407024P Columbus, OH | 4.0 | 1.5 | 1991 | $6,208 | $3.12 | 14d | 1 | 0.78mi |
| 1964 Sullivant Ave Columbus, OH | 4.0 | 2.0 | 1580 | $1,650 | $1.04 | 23d | 1 | 0.86mi |
| 749 Canonby Pl Apt E Columbus, OH | 3.0 | 1.5 | 1200 | $1,095 | $0.91 | 17d | 1 | 0.89mi |
| 713 Canonby Pl Apt E Columbus, OH | 3.0 | 1.5 | 1200 | $1,095 | $0.91 | 43d | 1 | 0.90mi |
| 713 Canonby Pl Unit B Columbus, OH | 3.0 | 1.5 | 1200 | $1,095 | $0.91 | 3d | 1 | 0.90mi |
| 257 S Skidmore St Columbus, OH | 3.0 | 2.0 | 1224 | $1,895 | $1.55 | 43d | 1 | 1.09mi |
| 95-97 Whitethorne Ave Columbus, OH | 3.0 | 1.5 | 1260 | $1,475 | $1.17 | 19d | 1 | 1.12mi |
| 95-97 Whitethorne Ave Columbus, OH | 3.0 | 1.5 | 1260 | $1,375 | $1.09 | 3d | 1 | 1.12mi |
| 285 S Gift St Columbus, OH | 3.0 | 2.0 | 1641 | $1,700 | $1.04 | 16d | 1 | 1.14mi |
| 285 S Gift St Columbus, OH | 3.0 | 2.0 | 1641 | $1,700 | $1.04 | 23d | 1 | 1.14mi |
| 2205 Sullivant Ave Columbus, OH | 3.0 | 1.0 | 1275 | $1,200 | $0.94 | 43d | 1 | 1.23mi |
| 501 W Broad St Columbus, OH | 3.0 | 1.0–2.5 | 1166 | $3,649 | $3.13 | 1d | 52 | 1.30mi |
| 501 W Broad St Columbus, OH | 3.0 | 1.0–2.5 | 1166 | $3,599 | $3.09 | 43d | 15 | 1.30mi |
| 1475 Stimmel Rd Columbus, OH | 1.0–4.0 | 1.0 | 868 | $1,585 | $1.83 | 16d | 1 | 1.39mi |
| 692 S Wheatland Ave Columbus, OH | 3.0 | 1.0 | 1608 | $1,547 | $0.96 | 43d | 1 | 1.46mi |
| 41 S Oakley Ave Columbus, OH | 3.0 | 1.5 | 1428 | $1,550 | $1.09 | 43d | 1 | 1.46mi |
| 1314 City View Dr Columbus, OH | 1.0–3.0 | 1.0–2.0 | 961 | $3,539 | $3.68 | 1d | 51 | 1.46mi |
| 252-254 S Wayne Ave Unit 254 Columbus, OH | 3.0 | 1.0 | 1120 | $1,300 | $1.16 | 17d | 1 | 1.47mi |
Listing history 11 events
-
2026-06-18days on market $129,900 Active 14 DOM
-
2026-06-17days on market $129,900 Active 13 DOM
-
2026-06-16days on market $129,900 Active 12 DOM
-
2026-06-15days on market $129,900 Active 11 DOM
-
2026-06-13days on market $129,900 Active 9 DOM
-
2026-06-13days on market $129,900 Active 8 DOM
-
2026-06-09days on market $129,900 Active 5 DOM
-
2026-06-08days on market $129,900 Active 4 DOM
-
2026-06-07days on market $129,900 Active 3 DOM
-
2026-06-05remarks 683-char remark
-
2026-06-05$129,900 Active 1 DOM
ⓘ Source: listings_history table (triggers on properties + properties_extension) + one-shot
backfill from property_details.listing_events for pre-trigger history.
Tax reassessment forecast OH · Partial reset (capped growth)
- Current annual tax
- $2,246 · $187/mo
- Projected year-2 tax
- $2,246 · $187/mo
- Expected delta
- $0/yr ($0/mo · 0.0%)
ⓘ Screening estimate from a state-policy table — verify with the county assessor before closing.
Climate risk First Street
- Flood 5/10 Major FEMA zone X · 49% chance over 30 yrs
- Wildfire 1/10 Low
- Heat 4/10 Moderate 7 d/yr ≥100°F today · 18 d/yr by 30 yrs out
- Wind 2/10 Low 100% chance of damaging wind over 30 yrs
- Air quality 3/10 Moderate 2 unhealthy d/yr today · 4 by 30 yrs out
Nearby sold comps map
Loading sold comps map…
Walkable amenities ~0.75 mi
Loading nearby amenities…
Taxation est. · year 1
- Rental income
- $29,376
- − Mortgage interest
- −$7,276
- − Property taxes
- −$2,246
- − Insurance
- −$650
- − Repairs & maintenance
- −$2,350
- − Management
- −$2,350
- − Depreciation
- −$3,779
- Taxable income
- $10,725
- Est. tax owed @ 24.0%
- −$2,574
- After-tax cash flow
- $9,563/yr
For passive investors: Depreciation is non-cash, so a rental often shows a tax loss while cash-flowing — sheltering income. Rental losses are passive: they offset passive income freely, and up to $25,000/yr can offset ordinary (W-2) income if you actively participate and your MAGI is under $100k (phasing out to $0 by $150k); unused losses carry forward. On sale, claimed depreciation is recaptured at up to 25%, and gains may owe capital-gains tax (a 1031 exchange can defer both). Figures are a year-1 estimate at your 24.0% rate — not tax advice; consult a CPA.
Schools (NCES district)
- District
- Columbus City School District
- NCES district ID
- 3904380
- Math proficiency
- 15% ▼ -17.00%
- Reading proficiency
- 26% ▼ -12.00%
- Median HH income
- $38,483
- Composite
- 17.19/100
- National rank
- #9105
- State rank
- #626 of 656 in OH
Livability — Columbus
- Score
- 81/100
- State rank
- #97
- US rank
- #1491
Category grades
Schools grade is shown separately in the Schools card above.
Census & demographics
- Census place
- Columbus, OH
- County
- Franklin County · 1,351,780 people
- City population
- 612,189
- Metro
- Columbus, OH
- Population (ZIP)
- 4,819
- Household income
- $32,321
- Rent vs Own
- Severe rent burden
- 126.0
Population outlook (Franklin County) Hauer SSP2
- Today (2025)
- 1,456,139 people
- By 2030
- 1,556,890 · +6.9%
- By 2040
- 1,757,349 · +20.7%
- By 2050
- 1,950,539 · +34.0%
- By 2075
- 2,376,171 · +63.2%
- By 2100
- 2,636,796 · +81.1%
Race, ethnicity, and origin ACS 2023
- Neighborhood character
- Highly diverse neighborhood (Simpson 0.71)
- Race & ethnicity
- White 43% Hispanic / Latino 28% Two or more races 21% Black 18% Asian 2%
- Hispanic origin (detail)
- Mexican 1% Puerto Rican 16% Dominican 5%
- Common ancestry
- Lithuanian 1% Slovak 1% Ukrainian 1%
- Foreign-born
- 8% · Canada, South Korea
- Languages at home
- 86% English-only · Spanish 11% Korean 1% Russian/Polish/Slavic 0%
Political lean MEDSL · Franklin
- 2024 margin
- Strong D (+28.4) · D 63.7% · R 35.3% · Other 1.0%
- 2008→2024 swing
- +7.7pp toward D · 2008: 20.7pp · 2024: 28.4pp
- All cycles
- 2024: D+28.4 2020: D+31.4 2016: D+25.9 2012: D+21.7 2008: D+20.7
Not yet ingested
- Civics
- —
Market trends
- HPI YoY
- ▲ 231.44%
- Current HPI
- 654.0855
- Rent YoY
- —
- Metro
- Columbus, OH
- State GDP YoY
- ▲ 1.98%
- F500 in state
- 48
Industry mix (Fortune 500 HQ in OH)
| Industry | F500 HQs | Revenue |
|---|---|---|
| Insurance | 3 | $145B |
|
||
| Industrial Machinery | 3 | $49B |
|
||
| Financial Services | 3 | $24B |
|
||
| Consumer Goods | 2 | $93B |
|
||
| Aerospace / Defense | 2 | $47B |
|
||
| Utilities | 2 | $33B |
|
||
Price history
+390.2% since first listed10 events — show timeline
- 2026-06-04 Listed $129,900 CBRMLS
- 2002-12-23 Sold (Public Records) $31,000 Public Records
- 2002-11-01 Sold (MLS) $22,000 CBRMLS
- 2002-05-16 Listing Removed — CBRMLS
- 2002-05-13 Listed $24,900 CBRMLS
- 1997-04-16 Sold (Public Records) $30,400 Public Records
- 1996-10-10 Sold (Public Records) $30,400 Public Records
- 1996-10-03 Sold (Public Records) $30,000 Public Records
- 1987-01-30 Sold (Public Records) $32,800 Public Records
- 1985-12-11 Sold (Public Records) $26,500 Public Records
Property tax history
+11.3%/yrLatest (2024): $2,246 · +1.3% YoY. Source: county tax records.
Cash-flow waterfall
monthlySold comps — $/sqft
last 12 mo · ≤1 miLoading sold comps…