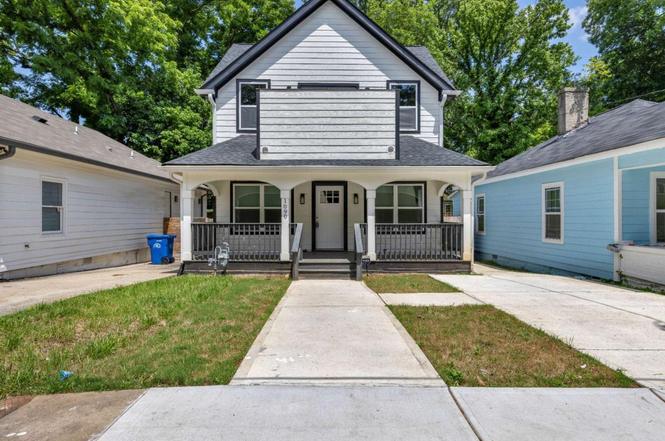
1090 Mcdaniel St SW · Atlanta, GA
Flood risk 8/10 · Major
- FEMA flood zone
- X (unshaded)
- Chance of flooding over 30 yrs
- 0.78%
- Est. flood insurance / yr
- $473 – $860
Fire risk 1/10 · Minimal
- Est. fire insurance / yr
- $963 – $1,789
Heat risk 5/10 · Moderate
- Hot days now (above 104°F)
- 7 days/yr
- Hot days in 30 yrs
- 18 days/yr
Wind risk 4/10 · Minor
- Chance of severe wind over 30 yrs
- 24.0%
Air-quality risk 4/10 · Minor
- Unhealthy air days now
- 4 days/yr
- Unhealthy air days in 30 yrs
- 6 days/yr
Risk factors via First Street. Map © Google.
Why this score? — see what drove the B- grade
The composite is a weighted blend of 9 inputs, each scored 0–100. Each bar is that input's sub-score; the figure is the points it added to the 100-point composite (weight × sub-score).
- Cash flow +25.7/30.0
- ARV discount +15.0/15.0
- DSCR +8.6/10.0
- 1% rule +5.6/10.0
- Livability +4.2/5.0
- Rent growth +3.2/5.0
- Schools +2.7/10.0
- Condition / age +2.5/5.0
- Appreciation +0.0/10.0
$375,000
🖨 Deal sheet 📄 Offer letter ✓ Due diligence
Listing remarks MLS
Rare opportunity to acquire a partially completed 2024 construction home in Atlanta's rapidly transforming Pittsburgh community. This property offers a compelling value-add opportunity with substantial work already completed, including a contemporary floor plan, luxury kitchen finishes, oversized island, spacious bedrooms, designer primary bath, private balcony, rear deck, and fenced yard. Interior repairs and finishing work remain, making this property best suited for cash buyers or renovation-minded purchasers seeking equity potential. Conveniently located near Downtown Atlanta, Georgia State University, major employment centers, parks, dining, and redevelopment projects. Sols As IS Bank-owned property being sold as-is with tremendous upside for the right buyer.
Key facts
- Fenced yard
- Private balcony
- Rear deck
Tags
Property features AI
Finance
- HOA & community: Community features include proximity to public transport, schools, shopping, parks, restaurants, sidewalks and street lights
Exterior
- Parking: Driveway parking; Open parking available
- Utilities: Public water; Public sewer; Electricity available; Natural gas available; Sewer available; Water available
- Home design: Two levels; Resale property; Composition roof; Wood siding construction; Foundation details: see remarks
- Construction: Wood siding; Composition roof
- Exterior features: Private entrance; Private yard; Deck; Front porch; Patio; Fenced yard with privacy wood fencing (front and back)
Interior
- Kitchen: Breakfast bar; White cabinetry; Eat-in kitchen; Kitchen island; Stone countertops; Open view to family room
- Bedrooms: Five upper-level bedrooms; Oversized master bedroom
- Flooring: Luxury vinyl
- Bathrooms: Two full bathrooms; One half bathroom; Master bath with double vanity and soaking tub
- Heating & cooling: Central air; Ceiling fans; Electric forced-air heating
- Interior features: 9-foot ceilings on the main level; Vaulted ceilings; Walk-in closets; Insulated windows; No shared/common walls
- Laundry & utility: Laundry features listed (details not specified)
Neighborhood map
What this means for you Summary
Snapshot
- This is a 5-bed/2.5-bath single-family listed at $375k.
Deal economics
- At list price, monthly cash flow is $840 ($10k/yr) — positive.
- The deal already cash-flows at list — no discount required.
- Meets the 1% rule at list price ($4k rent vs $375k).
- Cap rate 9.2% vs local median 3.1% in Atlanta — top-decile yield for the area; either an underpriced asset or a hidden risk that comps aren't pricing in. Stress-test before assuming the spread holds.
Location & tenants
- Location reads 83/100 on livability (#6 in GA, #919 nationally) — a professional / high-income tenant draw. Strengths: amenities A+, commute A+, housing A+; Watch: cost of living C-.
- Atlanta Public Schools (urban): math 28% / reading 35% proficiency, ranked #80 of 174 in GA (top 46%) — families likely to look elsewhere, expect single-tenant / working-renter base with shorter leases; 71% free/reduced lunch — lower-income household profile, screen leases tightly.
- Zoned schools: Charles L. Gideons Elementary School (math 2% / reading 8%, grade F, #1,160 of 1,228 statewide, top 98%, 343 students, 100% FRL); Sylvan Hills Middle School (math 5% / reading 12%, grade F, #439 of 470 statewide, top 94%, 445 students, 100% FRL) — zoned schools average 100% FRL vs 71% district-wide (29 pts higher); higher-poverty schools than district average — tighter screening recommended.
- Zoned-school proficiency averages 7% at this address vs 32% district-wide (-25 pts) — the specific schools serving this property underperform the Atlanta Public Schools average; the district grade overstates school quality for this exact location.
- Market conditions: Rents rising (+2.8%/yr); 452 active listings in the ZIP; 11 comparable units currently listed for rent nearby; rentals at typical pace (median 25d on market — plan ~3-4 weeks tenant-placement turnaround); 11,565 units permitted in Fulton County in 2024 (8,159 in 5+ unit buildings).
- At $3,980/mo this rent would consume 90% of the median local household income ($53k/yr) (locally 1676% of renters already pay >50% of income on rent) — very limited rent-growth headroom before tenants either downsize or default.
Forward outlook
- Local home prices are declining (-3.0%/yr); year-one equity from $3k of loan paydown is wiped out by about $11k of value loss. Plan a longer hold.
- Fulton County population projected at +38% by 2050 — long-run rental-demand tailwind backs the buy-and-hold thesis.
Negotiation context
- Only 2 days on market — expect competitive offers; lowballing is unlikely to land.
- 3 sale attempts since 7y ago; this cycle's ask has dropped $175k (32%) from the opening price — seller is motivated, your offer sets the floor, not the list.
- Current owner paid $85k; list at $375k implies a 341% gain — meaningful room to come down on a strong offer.
Risks & watch-outs
- Watch-outs: flood insurance adds $56/mo.
- Climate carrying-cost: severe flood risk; extreme-heat days projected 7→18/yr by 2055 (HVAC capex compounding) — expect insurance premiums to compound above CPI over the hold.
Questions for the listing agent
- What's the actual annual flood-insurance premium (NFIP or private), and is the property in a SFHA with mandatory coverage?
- Is there a deadline driving the sale (1031 exchange, divorce, estate, relocation)? That informs how much negotiation room exists.
- What's the average days-on-market for RENTAL listings here right now (not sales)? A rising rental-DOM trend means longer vacancies and softer asking-rent achievability than the comps imply.
- What's the recent tenant-quality profile in this submarket — average credit score on applications, eviction rate, late-payment / NSF rate, and stable-employment percentage? A property-management company in the area should have these aggregated.
- How much new for-sale + rental construction is in the pipeline within 1–3 miles? Heavy new supply typically softens prices + rents 12–24 months out; constrained supply supports both.
Investment metrics
- 1% rule
- 1.06% ✓
- Cap rate
- 9.16%
- Cash-on-cash
- 10.23%
- DSCR
- 1.46
- GRM
- 7.9
CMA / ARV
- ARV (on-the-fly)
- $553,832
- Comps found
- 12
Show comp detail 12 sales within ~0.75 mi
| Address | Dist | Beds/Ba | Sqft | Sold | Price | $/sf | Match |
|---|---|---|---|---|---|---|---|
| 1052 Windsor St SW | 0.20mi | 4/2.5 (-1) | 2,583 (-0%) | 3mo | $315,000 | $122 | 83 |
| 1045 Mcdaniel St | 0.09mi | 4/3.5 (-1) | 2,398 (-7%) | 9mo | $405,000 | $169 | 67 |
| 916 Ira St SW | 0.35mi | 5/3.0 | 2,456 (-5%) | 11mo | $625,000 | $254 | 64 |
| 941 Garibaldi St SW | 0.30mi | 4/3.5 (-1) | 2,732 (+6%) | 7mo | $640,000 | $234 | 62 |
| 563 Manford Rd SW | 0.52mi | 4/2.0 (-1) | 2,536 (-2%) | 7mo | $460,000 | $181 | 60 |
| 676 Elbert St SW | 0.52mi | 4/3.0 (-1) | 2,737 (+6%) | 4mo | $685,000 | $250 | 56 |
| 1002 Coleman St SW | 0.22mi | 4/3.0 (-1) | 2,264 (-12%) | 9mo | $530,000 | $234 | 55 |
| 210 Ormond St SW | 0.59mi | 4/3.0 (-1) | 2,490 (-4%) | 7mo | $248,000 | $100 | 54 |
| 1405 Athens Ave SW | 0.74mi | 4/2.0 (-1) | 2,540 (-2%) | 3mo | $399,000 | $157 | 53 |
| 576 Rockwell St SW | 0.54mi | 6/4.5 (+1) | 2,567 (-1%) | 12mo | $372,000 | $145 | 51 |
| 727 Garibaldi St SW | 0.70mi | 4/3.5 (-1) | 2,500 (-3%) | 3mo | $535,000 | $214 | 50 |
| 514 Cohen St SW | 0.45mi | 4/3.0 (-1) | 2,264 (-12%) | 3mo | $535,000 | $236 | 49 |
Match score weights: distance 35% · size 25% · config 20% · recency 20%. Top-matched comps best support the ARV.
Projected returns pro-forma
-3.0% appreciation · 2.77% rent growth · sell at horizon
- IRR
- -2.1%
- Equity multiple
- 0.92×
- Total profit
- $-8,306
- Equity at exit
- $55,914
- IRR
- 7.3%
- Equity multiple
- 1.55×
- Total profit
- $57,426
- Equity at exit
- $32,423
Cash invested: $105,000 (down + closing). Projections, not guarantees.
Landlord ↔ Tenant lean methodology
- Overall (STATE)
- 90 Strongly Landlord-Friendly
- State Georgia
- 90 Strongly Landlord-Friendly · R+3
- County
- — inherits STATE
- City
- — inherits STATE
ZIP-level market 30310
- Home prices YoY
- -32.8%
- Rents YoY
- 2.8%
- Active inventory
- 452
- Price-to-rent
- 7.9×
Monthly cashflow live
- Estimated rent
- $3,980 high interval (Pro) →
- Mortgage (P&I)
- −$1,967
- Tax from tax record
- −$126 /mo · $1,515/yr
- Insurance
- −$156
- Flood insurance flood zone
- −$56 /mo · $666/yr
- HOA
- −$0
- Vacancy / Maint / Mgmt
- −$836
- Net cashflow
- $840
Break-even live
UW: 25.0% down · 7.5% · 30yr · 1.5% tax · 5.0% vac · 8.0% maint · 8.0% mgmt
Financing live
Cash to close
- Down payment
- $93,750
- Closing costs
- $11,250
- Reserves months
- —
- Total cash needed
- —
Loan-product check · same deal, 3 products live
Conventional
25% down · 7.5% · 30yr
- Down + closing
- —
- Monthly P&I
- —
- Monthly cashflow
- —
- DSCR
- —
- Eligible?
- —
Personal DTI + credit; lowest rate.
DSCR
20% down · 8.5% · 30yr
- Down + closing
- —
- Monthly P&I
- —
- Monthly cashflow
- —
- DSCR
- —
- Eligible?
- —
No personal income docs; deal must DSCR.
Hard money
10% down · 12.0% · 12mo
- Down + closing
- —
- Monthly P&I
- —
- Monthly cashflow
- —
- DSCR
- —
- Eligible?
- —
Short-term bridge; refi at stabilization.
Rent comps 11 comps
| Address | Beds | Baths | Sqft | Rent | $/sqft | DOM | Units | Dist |
|---|---|---|---|---|---|---|---|---|
| 1089 Coleman St SW Atlanta, GA | 4.0 | 3.0 | 2500 | $4,500 | $1.80 | 24d | 1 | 0.19mi |
| 798 Bender St SW Unit 1075536P Atlanta, GA | 4.0 | 3.5 | 2292 | $6,989 | $3.05 | 5d | 1 | 0.65mi |
| 1005 Linam Ave SE Atlanta, GA | 4.0 | 3.0 | 1757 | $3,000 | $1.71 | 24d | 1 | 0.85mi |
| 1656 Thornton Pl SW Atlanta, GA | 6.0 | 3.0 | 1815 | $3,300 | $1.82 | 24d | 1 | 0.93mi |
| 83 Ormond St SE Atlanta, GA | 5.0 | 3.0 | 2772 | $3,195 | $1.15 | 3d | 1 | 1.01mi |
| 907 Beecher St SW Atlanta, GA | 4.0 | 2.0 | 1890 | $6,500 | $3.44 | 22d | 1 | 1.12mi |
| 1017 Sparks St SW Atlanta, GA | 4.0 | 2.5 | 1950 | $2,475 | $1.27 | 24d | 1 | 1.16mi |
| 64 Moury Ave SE Atlanta, GA | 4.0 | 3.5 | 1877 | $2,699 | $1.44 | 24d | 1 | 1.23mi |
| 1010 Dill Ave SW Atlanta, GA | 4.0 | 3.0 | 2236 | $2,850 | $1.27 | 24d | 1 | 1.26mi |
| 352 Skylar Ct SE Atlanta, GA | 4.0 | 2.5 | 2674 | $4,400 | $1.65 | 24d | 1 | 1.30mi |
| 570 Reed St SE Atlanta, GA | 4.0 | 3.0 | 1812 | $4,250 | $2.35 | 18d | 1 | 1.32mi |
Listing history 4 events
-
2026-06-18days on market $375,000 Active 2 DOM
-
2026-06-16status $375,000 Active 1 DOM
-
2026-06-15remarks 699-char remark
Show marketing remark (780 chars)
Rare opportunity to acquire a partially completed 2024 construction home in Atlanta's rapidly transforming Pittsburgh community. This property offers a compelling value-add opportunity with substantial work already completed, including a contemporary floor plan, luxury kitchen finishes, oversized island, spacious bedrooms, designer primary bath, private balcony, rear deck, and fenced yard. Interior repairs and finishing work remain, making this property best suited for cash buyers or renovation-minded purchasers seeking equity potential. Conveniently located near Downtown Atlanta, Georgia State University, major employment centers, parks, dining, and redevelopment projects. Sols As IS Bank-owned property being sold as-is with tremendous upside for the right buyer.
-
2026-06-15$375,000 Coming Soon 1 DOM
Show marketing remark (780 chars)
Rare opportunity to acquire a partially completed 2024 construction home in Atlanta's rapidly transforming Pittsburgh community. This property offers a compelling value-add opportunity with substantial work already completed, including a contemporary floor plan, luxury kitchen finishes, oversized island, spacious bedrooms, designer primary bath, private balcony, rear deck, and fenced yard. Interior repairs and finishing work remain, making this property best suited for cash buyers or renovation-minded purchasers seeking equity potential. Conveniently located near Downtown Atlanta, Georgia State University, major employment centers, parks, dining, and redevelopment projects. Sols As IS Bank-owned property being sold as-is with tremendous upside for the right buyer.
ⓘ Source: listings_history table (triggers on properties + properties_extension) + one-shot
backfill from property_details.listing_events for pre-trigger history.
Tax reassessment forecast GA · Resets to sale price
- Current annual tax
- $1,515 · $126/mo
- Projected year-2 tax
- $3,450 · $288/mo
- Expected delta
- +$1,935/yr (+$161/mo · 127.7%)
ⓘ Screening estimate from a state-policy table — verify with the county assessor before closing.
Climate risk First Street
- Flood 8/10 Severe FEMA zone X (unshaded) · 78% chance over 30 yrs
- Wildfire 1/10 Low
- Heat 5/10 Major 7 d/yr ≥104°F today · 18 d/yr by 30 yrs out
- Wind 4/10 Moderate 24% chance of damaging wind over 30 yrs
- Air quality 4/10 Moderate 4 unhealthy d/yr today · 6 by 30 yrs out
Nearby sold comps map
Loading sold comps map…
Walkable amenities ~0.75 mi
Loading nearby amenities…
Taxation est. · year 1
- Rental income
- $47,765
- − Mortgage interest
- −$21,006
- − Property taxes
- −$1,515
- − Insurance
- −$2,542
- − Repairs & maintenance
- −$3,821
- − Management
- −$3,821
- − Depreciation
- −$10,909
- Taxable income
- $4,151
- Est. tax owed @ 24.0%
- −$996
- After-tax cash flow
- $9,083/yr
For passive investors: Depreciation is non-cash, so a rental often shows a tax loss while cash-flowing — sheltering income. Rental losses are passive: they offset passive income freely, and up to $25,000/yr can offset ordinary (W-2) income if you actively participate and your MAGI is under $100k (phasing out to $0 by $150k); unused losses carry forward. On sale, claimed depreciation is recaptured at up to 25%, and gains may owe capital-gains tax (a 1031 exchange can defer both). Figures are a year-1 estimate at your 24.0% rate — not tax advice; consult a CPA.
Schools (NCES district)
- District
- Atlanta Public Schools
- NCES district ID
- 1300120
- Math proficiency
- 28% ▼ -6.00%
- Reading proficiency
- 35% ▼ -2.00%
- Median HH income
- $48,306
- Composite
- 27.27/100
- National rank
- #7006
- State rank
- #80 of 174 in GA
Livability — Atlanta
- Score
- 83/100
- State rank
- #6
- US rank
- #919
Category grades
Schools grade is shown separately in the Schools card above.
Census & demographics
- Census place
- Atlanta, GA
- County
- Fulton County · 1,094,430 people
- City population
- 629,525
- Metro
- Atlanta-Sandy Springs-Alpharetta, GA
- Population (ZIP)
- 27,186
- Household income
- $53,037
- Rent vs Own
- Severe rent burden
- 1676.0
Population outlook (Fulton County) Hauer SSP2
- Today (2025)
- 1,203,707 people
- By 2030
- 1,299,706 · +8.0%
- By 2040
- 1,488,256 · +23.6%
- By 2050
- 1,664,580 · +38.3%
- By 2075
- 2,036,072 · +69.2%
- By 2100
- 2,222,402 · +84.6%
Race, ethnicity, and origin ACS 2023
- Neighborhood character
- Predominantly Black (76%)
- Race & ethnicity
- Black 76% White 14% Two or more races 4% Hispanic / Latino 4% Asian 2%
- Common ancestry
- Lithuanian 1% Slovak 1% Serbian 0%
- Foreign-born
- 5% · Canada, South Korea, Vietnam
- Languages at home
- 92% English-only · Spanish 4% French/Haitian/Cajun 1% Other Indo-European 1%
Political lean MEDSL · Fulton
- 2024 margin
- Solid D (+44.9) · D 71.9% · R 27.0% · Other 1.1%
- 2008→2024 swing
- +9.8pp toward D · 2008: 35.0pp · 2024: 44.9pp
- All cycles
- 2024: D+44.9 2020: D+46.4 2016: D+42.1 2012: D+29.6 2008: D+35.0
Not yet ingested
- Civics
- —
Market trends
- HPI YoY
- ▼ -204.00%
- Current HPI
- 418.7297
- Rent YoY
- ▲ 2.77%
- Metro
- Atlanta-Sandy Springs-Alpharetta, GA
- State GDP YoY
- ▲ 2.66%
- F500 in state
- 28
Industry mix (Fortune 500 HQ in GA)
| Industry | F500 HQs | Revenue |
|---|---|---|
| Paper / Packaging | 2 | $29B |
|
||
| Retail | 1 | $160B |
|
||
| Transportation / Logistics | 1 | $91B |
|
||
| Airlines | 1 | $62B |
|
||
| Consumer Goods | 1 | $47B |
|
||
| Utilities | 1 | $25B |
|
||
Price history
+369.3% since first listed14 events — show timeline
- 2026-06-15 Coming Soon $375,000 GAMLS
- 2026-06-15 Coming Soon $375,000 FMLS
- 2025-12-01 Listing Removed — FMLS
- 2025-10-24 Price Changed $449,000 FMLS
- 2025-08-08 Price Changed $499,900 FMLS
- 2025-05-23 Listed $550,000 FMLS
- 2019-10-18 Sold (Public Records) $85,000 Public Records
- 2019-08-05 Sold (Public Records) $80,000 Public Records
- 2019-08-02 Sold (MLS) $80,000 FMLS
- 2019-07-31 Sold (MLS) $80,000 GAMLS
- 2019-07-21 Pending — GAMLS
- 2019-07-21 Pending — FMLS
- 2019-07-19 Listed $79,900 GAMLS
- 2019-07-19 Listed $79,900 FMLS
Property tax history
+4.5%/yrLatest (2025): $1,515 · -0.1% YoY. Source: county tax records.
Cash-flow waterfall
monthlySold comps — $/sqft
last 12 mo · ≤1 miLoading sold comps…