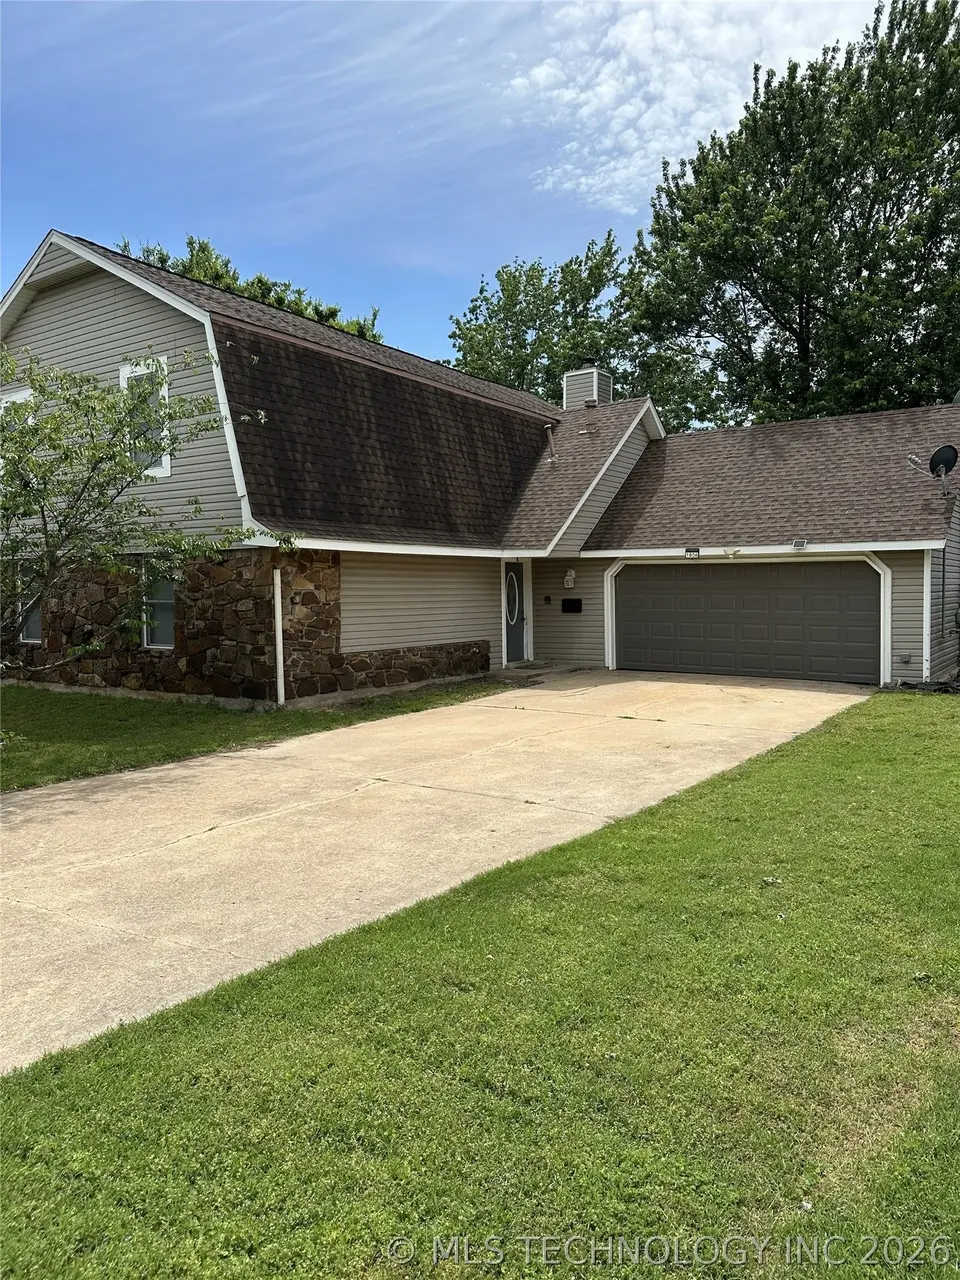
1806 N Ironwood Ave · Broken Arrow, OK
Flood risk 1/10 · Minimal
- FEMA flood zone
- X (unshaded)
- Chance of flooding over 30 yrs
- 0.0%
- Est. flood insurance / yr
- $473 – $860
Fire risk 1/10 · Minimal
- Est. fire insurance / yr
- $2,463 – $4,575
Heat risk 6/10 · Moderate
- Hot days now (above 110°F)
- 7 days/yr
- Hot days in 30 yrs
- 18 days/yr
Wind risk 3/10 · Minor
- Chance of severe wind over 30 yrs
- 4.0%
Air-quality risk 2/10 · Minimal
- Unhealthy air days now
- 1 days/yr
- Unhealthy air days in 30 yrs
- 1 days/yr
Risk factors via First Street. Map © Google.
Why this score? — see what drove the D+ grade
The composite is a weighted blend of 9 inputs, each scored 0–100. Each bar is that input's sub-score; the figure is the points it added to the 100-point composite (weight × sub-score).
- ARV discount +15.0/15.0
- Cash flow +14.6/30.0
- DSCR +4.4/10.0
- Livability +3.9/5.0
- 1% rule +3.3/10.0
- Rent growth +3.2/5.0
- Condition / age +2.5/5.0
- Schools +2.4/10.0
- Appreciation +0.0/10.0
$260,000
🖨 Deal sheet (PDF) 📄 Offer letter ✓ Due diligence
Listing remarks
Charming Dutch Colonial Revival as-is property full of character and potential. This classic home features the hallmark gambrel roof, original details, spacious rooms, and timeless curb appeal. With a newer dishwasher, and vintage charm throughout, it’s the perfect opportunity to personalize this property. Ideal for buyers with vision, this home offers endless possibilities with recently updated wood-like tile floor in kitchen and living room while preserving its distinctive colonial character. This perfectly located home is conveniently situated in a cul de sac near the Broken Arrow Expressway, Bass Pro, delicious restaurants and minutes from the Rose District. This gem is priced to
Key facts
- Wood-like tile floor
- Cul de sac
- Gambrel roof
Tags
Property features AI
Exterior
- Parking: Attached garage with 2 spaces
- Security: Safe room interior; Smoke detectors
- Utilities: Public water; Public sewer; Electricity available; Natural gas available; Cable available; Fiber optic available; High-speed internet available; Phone service available
- Home design: Two-story home; Faces east; Slab foundation
- Construction: Built (year per public records); Stone veneer and vinyl siding over wood frame; Asphalt/fiberglass roof
- Exterior features: Concrete driveway; Deck; Privacy fencing; Shed(s); Sloping topography; Cul-de-sac lot
Interior
- Kitchen: Dishwasher; Range/Stove; Disposal
- Bedrooms: Multiple bedrooms including second-floor bedrooms; First-floor bedroom; Bonus room on second floor (additional room, split bedroom)
- Flooring: Carpet; Tile
- Bathrooms: Two full bathrooms; One half bathroom; Master bathroom with bathtub and vent; Hall bath with vent
- Heating & cooling: Central heating (gas); Central air conditioning
- Interior features: High-speed internet available; Cable TV connection; Wired for data; Intercom; Ceiling fan(s); Programmable thermostat; Laminate counters; Electric oven/range connection; Gas oven/range connection
- Laundry & utility: Washer hookup; Electric dryer hookup; Gas dryer hookup; Gas water heater
Neighborhood map
What this means for you Summary
Snapshot
- This is a 6-bed/2.5-bath single-family listed at $260k.
Deal economics
- At list price, monthly cash flow is $60 ($718/yr) — positive.
- The deal already cash-flows at list — no discount required.
- To meet the 1% rule (rent ≥ 1% of price), the offer needs to be $216k (17.1% below list).
- Recommended offer: $216k (17.1% below list) — sets the bar for 1% rule.
- Cap rate 6.6% vs local median 4.0% in Broken Arrow — top-decile yield for the area; either an underpriced asset or a hidden risk that comps aren't pricing in. Stress-test before assuming the spread holds.
Location & tenants
- Location reads 78/100 on livability (#7 in OK, #2,691 nationally) — a middle-class / working-renter tenant base. Strengths: commute A+, cost of living A+, housing A+; Watch: amenities F.
- Broken Arrow (suburban): math 23% / reading 28% proficiency, ranked #79 of 270 in OK (top 29%) — low school quality limits family demand, transient renter base, plan for 1-2y turnover.
- Zoned schools: Arrowhead Es (math 17% / reading 22%, grade F, #479 of 845 statewide, top 63%, 411 students, 0% FRL); Sequoyah Ms (math 12% / reading 15%, grade F, #252 of 345 statewide, top 74%, 720 students, 0% FRL); Broken Arrow Hs (math 22% / reading 36%, grade F, #120 of 447 statewide, top 27%, 4,589 students, 0% FRL) — zoned schools average 0% FRL vs 33% district-wide (33 pts lower); this property's tenant base skews higher-income than the district average.
- Market conditions: Rents rising (+2.9%/yr); 445 active listings in the ZIP; solid renter incomes; 2,818 units permitted in Tulsa County in 2024 (518 in 5+ unit buildings).
- This rent runs 32% of the median local income ($81k/yr) — at the standard rent-burdened threshold; future hikes will face affordability resistance.
Forward outlook
- Local home prices are declining (-3.0%/yr); year-one equity from $2k of loan paydown is wiped out by about $8k of value loss. Plan a longer hold.
- Tulsa County population projected at +30% by 2050 — long-run rental-demand tailwind backs the buy-and-hold thesis.
Negotiation context
- Only 7 days on market — expect competitive offers; lowballing is unlikely to land.
- Current owner paid $123k; list at $260k implies a 111% gain — meaningful room to come down on a strong offer.
Risks & watch-outs
- Climate carrying-cost: extreme-heat days projected 7→18/yr by 2055 (HVAC capex compounding) — expect insurance premiums to compound above CPI over the hold.
Questions for the listing agent
- Is there a deadline driving the sale (1031 exchange, divorce, estate, relocation)? That informs how much negotiation room exists.
- Schools are D-rated, which usually means shorter tenancies and higher turnover. Who's the typical renter profile here, and what's been the actual vacancy rate?
- The area grade is low — what's the realistic commute time and amenity access for the typical tenant pool here? Any planned neighborhood developments (good or bad) we should know about?
- What's the average days-on-market for RENTAL listings here right now (not sales)? A rising rental-DOM trend means longer vacancies and softer asking-rent achievability than the comps imply.
- What's the recent tenant-quality profile in this submarket — average credit score on applications, eviction rate, late-payment / NSF rate, and stable-employment percentage? A property-management company in the area should have these aggregated.
- How much new for-sale + rental construction is in the pipeline within 1–3 miles? Heavy new supply typically softens prices + rents 12–24 months out; constrained supply supports both.
Investment metrics
- 1% rule
- 0.83% ✗
- Cap rate
- 6.57%
- Cash-on-cash
- 0.99%
- DSCR
- 1.04
- GRM
- 10.0
CMA / ARV
- ARV (on-the-fly)
- $407,160
- Comps found
- 1
Show comp detail 1 sale within ~0.75 mi
| Address | Dist | Beds/Ba | Sqft | Sold | Price | $/sf | Match |
|---|---|---|---|---|---|---|---|
| 2823 N Ironwood Ct | 0.71mi | 5/3.5 (-1) | 2,752 (+5%) | 17mo | $429,900 | $156 | 34 |
Match score weights: distance 35% · size 25% · config 20% · recency 20%. Top-matched comps best support the ARV.
Projected returns pro-forma
-3.0% appreciation · 2.94% rent growth · sell at horizon
- IRR
- -14.8%
- Equity multiple
- 0.47×
- Total profit
- $-38,513
- Equity at exit
- $38,767
- IRR
- -6.3%
- Equity multiple
- 0.60×
- Total profit
- $-29,413
- Equity at exit
- $22,480
Cash invested: $72,800 (down + closing). Projections, not guarantees.
Landlord ↔ Tenant lean methodology
- Overall (STATE)
- 83 Strongly Landlord-Friendly
- State Oklahoma
- 83 Strongly Landlord-Friendly · R+20
- County
- — inherits STATE
- City
- — inherits STATE
ZIP-level market 74012
- Rents YoY
- 2.9%
- Active inventory
- 445
- Price-to-rent
- 10.0×
Monthly cashflow live
- Estimated rent
- $2,157 medium interval (Pro) →
- Mortgage (P&I)
- −$1,363
- Tax from tax record
- −$172 /mo · $2,066/yr
- Insurance
- −$108
- HOA
- −$0
- Vacancy / Maint / Mgmt
- −$453
- Net cashflow
- $60
Break-even live
Sensitivity live
| Price | -10% $207 | -5% $133 | +0% $60 | +5% $-14 | +10% $-87 |
|---|---|---|---|---|---|
| Rent | -10% $-111 | -5% $-25 | +0% $60 | +5% $145 | +10% $230 |
| Rate | -1.0pp $191 | -0.5pp $126 | base $60 | +0.5pp $-8 | +1.0pp $-76 |
UW: 25.0% down · 7.5% · 30yr · 1.5% tax · 5.0% vac · 8.0% maint · 8.0% mgmt
Financing live
Cash to close
- Down payment
- $65,000
- Closing costs
- $7,800
- Reserves months
- —
- Total cash needed
- —
Loan-product check · same deal, 3 products live
Conventional
25% down · 7.5% · 30yr
- Down + closing
- —
- Monthly P&I
- —
- Monthly cashflow
- —
- DSCR
- —
- Eligible?
- —
Personal DTI + credit; lowest rate.
DSCR
20% down · 8.5% · 30yr
- Down + closing
- —
- Monthly P&I
- —
- Monthly cashflow
- —
- DSCR
- —
- Eligible?
- —
No personal income docs; deal must DSCR.
Hard money
10% down · 12.0% · 12mo
- Down + closing
- —
- Monthly P&I
- —
- Monthly cashflow
- —
- DSCR
- —
- Eligible?
- —
Short-term bridge; refi at stabilization.
Listing history 3 events
-
2026-05-19status Pending
-
2026-05-11$260,000 Active
-
2013-03-01soldstatus $123,000
ⓘ Source: listings_history table (triggers on properties + properties_extension) + one-shot
backfill from property_details.listing_events for pre-trigger history.
Tax reassessment forecast OK · Resets to sale price
- Current annual tax
- $2,066 · $172/mo
- Projected year-2 tax
- $2,340 · $195/mo
- Expected delta
- +$274/yr (+$23/mo · 13.3%)
ⓘ Screening estimate from a state-policy table — verify with the county assessor before closing.
Climate risk First Street
- Flood 1/10 Low FEMA zone X (unshaded) · 0% chance over 30 yrs
- Wildfire 1/10 Low
- Heat 6/10 Major 7 d/yr ≥110°F today · 18 d/yr by 30 yrs out
- Wind 3/10 Moderate 4% chance of damaging wind over 30 yrs
- Air quality 2/10 Low 1 unhealthy d/yr today · 1 by 30 yrs out
Nearby sold comps map
Loading sold comps map…
Walkable amenities ~0.75 mi
Loading nearby amenities…
Taxation est. · year 1
- Rental income
- $25,880
- − Mortgage interest
- −$14,564
- − Property taxes
- −$2,066
- − Insurance
- −$1,300
- − Repairs & maintenance
- −$2,070
- − Management
- −$2,070
- − Depreciation
- −$7,564
- Taxable loss
- −$3,754
- Est. tax savings @ 24.0%
- +$901
- After-tax cash flow
- $1,619/yr
For passive investors: Depreciation is non-cash, so a rental often shows a tax loss while cash-flowing — sheltering income. Rental losses are passive: they offset passive income freely, and up to $25,000/yr can offset ordinary (W-2) income if you actively participate and your MAGI is under $100k (phasing out to $0 by $150k); unused losses carry forward. On sale, claimed depreciation is recaptured at up to 25%, and gains may owe capital-gains tax (a 1031 exchange can defer both). Figures are a year-1 estimate at your 24.0% rate — not tax advice; consult a CPA.
Schools (NCES district)
- District
- Broken Arrow
- NCES district ID
- 4005490
- Math proficiency
- 23% ▼ -9.00%
- Reading proficiency
- 28% ▼ -9.00%
- Median HH income
- $64,646
- Composite
- 23.86/100
- National rank
- #7801
- State rank
- #79 of 270 in OK
Livability — Broken Arrow
- Score
- 78/100
- State rank
- #7
- US rank
- #2691
Category grades
Schools grade is shown separately in the Schools card above.
Census & demographics
- Census place
- Broken Arrow, OK
- County
- Tulsa County · 640,811 people
- City population
- 144,172
- Metro
- Tulsa, OK
- Population (ZIP)
- 65,060
- Household income
- $81,456
- Rent vs Own
- Severe rent burden
- 1378.0
Population outlook (Tulsa County) Hauer SSP2
- Today (2025)
- 723,846 people
- By 2030
- 766,033 · +5.8%
- By 2040
- 851,386 · +17.6%
- By 2050
- 938,389 · +29.6%
- By 2075
- 1,166,011 · +61.1%
- By 2100
- 1,350,277 · +86.5%
Race, ethnicity, and origin ACS 2023
- Neighborhood character
- Diverse neighborhood (Simpson 0.58)
- Race & ethnicity
- White 63% Two or more races 13% Hispanic / Latino 11% Black 7% Asian 5% Native American 5%
- Hispanic origin (detail)
- Mexican 8%
- Common ancestry
- Slovak 2% Italian 2% Lithuanian 2%
- Foreign-born
- 10% · Canada, Vietnam
- Languages at home
- 86% English-only · Spanish 7% Vietnamese 2% Other Asian/Pacific 1%
Political lean MEDSL · Tulsa
- 2024 margin
- R (+15.2) · D 41.3% · R 56.5% · Other 2.2%
- 2008→2024 swing
- +9.2pp toward D · 2008: -24.5pp · 2024: -15.2pp
- All cycles
- 2024: R+15.2 2020: R+15.6 2016: R+22.9 2012: R+27.4 2008: R+24.5
Not yet ingested
- Civics
- —
Market trends
- HPI YoY
- ▼ -170.42%
- Current HPI
- 214.1279
- Rent YoY
- ▲ 2.94%
- Metro
- Tulsa, OK
- State GDP YoY
- ▲ 1.55%
- F500 in state
- 6
Industry mix (Fortune 500 HQ in OK)
| Industry | F500 HQs | Revenue |
|---|---|---|
| Energy | 3 | $48B |
|
||
Price history
+111.4% since first listed3 events — show timeline
- 2026-05-19 Pending — MLS Technology, Inc.
- 2026-05-11 Listed $260,000 MLS Technology, Inc.
- 2013-03-01 Sold (Public Records) $123,000 Public Records
Property tax history
+2.1%/yrLatest (2025): $2,066 · +3.0% YoY. Source: county tax records.
Cash-flow waterfall
monthlySold comps — $/sqft
last 12 mo · ≤1 miLoading sold comps…