 Duplex
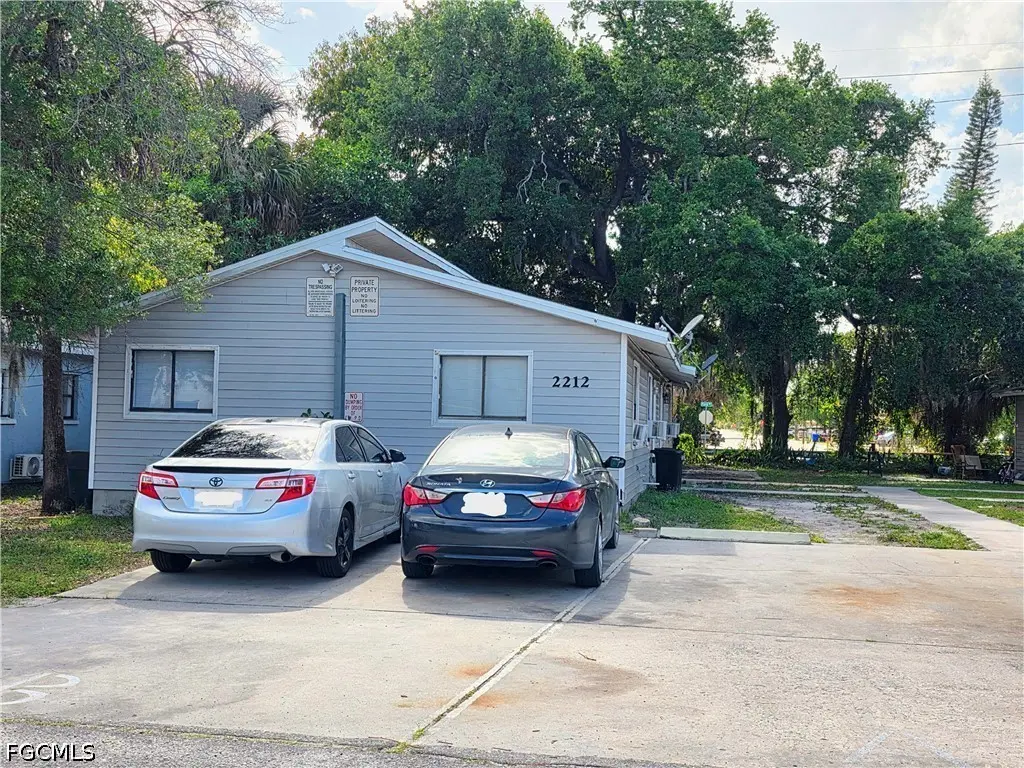
2212 Quality Life Center Way · Fort Myers, FL
Flood risk 1/10 · Minimal
- FEMA flood zone
- X (unshaded)
- Chance of flooding over 30 yrs
- 0.0%
- Est. flood insurance / yr
- $507 – $1,088
Fire risk 1/10 · Minimal
- Est. fire insurance / yr
- $947 – $1,759
Heat risk 10/10 · Severe
- Hot days now (above 107°F)
- 7 days/yr
- Hot days in 30 yrs
- 31 days/yr
Wind risk 10/10 · Severe
- Chance of severe wind over 30 yrs
- 99.0%
Air-quality risk 2/10 · Minimal
- Unhealthy air days now
- 1 days/yr
- Unhealthy air days in 30 yrs
- 1 days/yr
Risk factors via First Street. Map © Google.
Why this score? — see what drove the B- grade
The composite is a weighted blend of 9 inputs, each scored 0–100. Each bar is that input's sub-score; the figure is the points it added to the 100-point composite (weight × sub-score).
- Cash flow +28.7/30.0
- DSCR +10.0/10.0
- 1% rule +8.1/10.0
- ARV discount +7.5/15.0
- Livability +4.3/5.0
- Schools +4.1/10.0
- Condition / age +2.5/5.0
- Rent growth +1.4/5.0
- Appreciation +0.0/10.0
$235,000
🖨 Deal sheet 📄 Offer letter ✓ Due diligence
Multi-family units
County records classify this as Multi-Family (2-4 Unit). Listing-text estimate: 2 units. confirmed
Listing remarks MLS
Great investment opportunity! Nice 4/2, 1,872 sq. ft Duplex with tenants in place! Built in 1981, each unit has central a/c & heat, 2 bedrooms 1 Bath, 936 sq. ft under air. Get it while its HOT and start making money right away!
Key facts
- 7,579 sq ft lot
- Built 1981
- Listed 42 days
Property features AI
Finance
- Financial info: Two rental units; each unit currently shows actual rent $1,000 and pro forma $1,000; Tenants pay electricity, internet, and water; Pets allowed
- HOA & community: No association fee; Non-gated community
Exterior
- Utilities: Public water; Public sewer; Cable not available
- Home design: Resale property; Zoned RS-7
- Construction: Vinyl siding with wood frame construction; Shingle roof; Property built on a foundation (standard residential)
- Exterior features: Dead-end lot; Paved public road access; No additional exterior features listed
Interior
- Kitchen: Range and refrigerator in each unit
- Bedrooms: Two 2-bedroom units (each unit listed as Two Bedroom)
- Flooring: Tile
- Bathrooms: Each unit has 1 full bathroom (total 2 units)
- Heating & cooling: Window unit heating; Ceiling fans; Window air-conditioning units
- Interior features: Single-hung and sliding windows; Tile flooring
- Laundry & utility: Washer and dryer in residence or washer/dryer hookup (per unit descriptions)
Neighborhood map
What this means for you Summary
Snapshot
- This is a 2 × 2-bed/1-bath units multifamily listed at $235k.
Deal economics
- At list price, monthly cash flow is $783 ($9k/yr) — positive. Per door: $391/mo.
- The deal already cash-flows at list — no discount required.
- Meets the 1% rule at list price ($3k rent vs $235k).
- Recommended offer: $228k (3.0% below list) — sets the bar for market timing.
- Cap rate 10.3% vs local median 3.0% in Fort Myers — top-decile yield for the area; either an underpriced asset or a hidden risk that comps aren't pricing in. Stress-test before assuming the spread holds.
Location & tenants
- Location reads 86/100 on livability (#14 in FL, #383 nationally) — a professional / high-income tenant draw. Strengths: amenities A+, commute A+, housing A+.
- Lee (suburban): math 47% / reading 50% proficiency, ranked #42 of 73 in FL (top 58%) — families likely to look elsewhere, expect single-tenant / working-renter base with shorter leases.
- Market conditions: Rents falling (-4.3%/yr); 267 active listings in the ZIP; 40 comparable units currently listed for rent nearby; rentals at typical pace (median 24d on market — plan ~3-4 weeks tenant-placement turnaround); 15,411 units permitted in Lee County in 2024 (4,686 in 5+ unit buildings).
- At $3,088/mo this rent would consume 70% of the median local household income ($53k/yr) (locally 2324% of renters already pay >50% of income on rent) — very limited rent-growth headroom before tenants either downsize or default.
Forward outlook
- Local home prices are declining (-3.0%/yr); year-one equity from $2k of loan paydown is wiped out by about $7k of value loss. Plan a longer hold.
- Lee County population projected at +44% by 2050 — long-run rental-demand tailwind backs the buy-and-hold thesis.
Negotiation context
- It's been on market 42 days — a 3% lower offer ($228k) is reasonable based on typical stale-listing flexibility.
- 3 sale attempts since 11y ago; this cycle's ask has dropped $15k (6%) from the opening price — seller is motivated, your offer sets the floor, not the list.
- Current owner paid $71k; list at $235k implies a 231% gain — meaningful room to come down on a strong offer.
Risks & watch-outs
- Climate carrying-cost: severe wind risk, 99% chance of damaging wind over 30y; extreme-heat days projected 7→31/yr by 2055 (HVAC capex compounding) — expect insurance premiums to compound above CPI over the hold.
Questions for the listing agent
- It's been on market 42 days. Have you received any prior offers? Is the seller open to a 3% concession, seller financing, or rate buy-down credit?
- Can we see the unit-by-unit rent roll, current vacancy, and any below-market leases? What's the average tenancy length?
- What capital expenditures (roof, boiler, parking lot, exteriors) have been made in the last 5 years, and what's planned in the next 2?
- Is there a deadline driving the sale (1031 exchange, divorce, estate, relocation)? That informs how much negotiation room exists.
- What's the average days-on-market for RENTAL listings here right now (not sales)? A rising rental-DOM trend means longer vacancies and softer asking-rent achievability than the comps imply.
- What's the recent tenant-quality profile in this submarket — average credit score on applications, eviction rate, late-payment / NSF rate, and stable-employment percentage? A property-management company in the area should have these aggregated.
- How much new apartment / multifamily construction is in the pipeline within 1–3 miles? Heavy new supply (>2% of stock underway) typically softens rents 12–24 months out; light construction supports rent growth.
Investment metrics
- 1% rule
- 1.31% ✓
- Cap rate
- 10.29%
- Cash-on-cash
- 14.27%
- DSCR
- 1.64
- GRM
- 6.3
CMA / ARV
No comps found within radius.
Projected returns pro-forma
-3.0% appreciation · 0.0% rent growth · sell at horizon
- IRR
- 1.1%
- Equity multiple
- 1.04×
- Total profit
- $2,780
- Equity at exit
- $35,039
- IRR
- 7.4%
- Equity multiple
- 1.48×
- Total profit
- $31,900
- Equity at exit
- $20,319
Cash invested: $65,800 (down + closing). Projections, not guarantees.
Landlord ↔ Tenant lean methodology
- Overall (STATE)
- 87 Strongly Landlord-Friendly
- State Florida
- 87 Strongly Landlord-Friendly · R+3
- County
- — inherits STATE
- City
- — inherits STATE
ZIP-level market 33916
- Home prices YoY
- -28.2%
- Rents YoY
- -4.3%
- Active inventory
- 267
- Price-to-rent
- 12.7×
Monthly cashflow live
- Estimated rent
- $3,088 high interval (Pro) →
- Mortgage (P&I)
- −$1,232
- Tax from tax record
- −$327 /mo · $3,920/yr
- Insurance
- −$98
- HOA
- −$0
- Vacancy / Maint / Mgmt
- −$648
- Net cashflow
- $783
Break-even live
2-unit breakdown (identical units grouped — click to expand)
| Units | Beds | Baths | Est. rent |
|---|---|---|---|
| 2× units | 2 | 1 | $3,088 |
| #1 | 2 | 1 | $1,544 |
| #2 | 2 | 1 | $1,544 |
| Total (2 units) | $3,088 | ||
UW: 25.0% down · 7.5% · 30yr · 1.5% tax · 5.0% vac · 8.0% maint · 8.0% mgmt
Financing live
Cash to close
- Down payment
- $58,750
- Closing costs
- $7,050
- Reserves months
- —
- Total cash needed
- —
Loan-product check · same deal, 3 products live
Conventional
25% down · 7.5% · 30yr
- Down + closing
- —
- Monthly P&I
- —
- Monthly cashflow
- —
- DSCR
- —
- Eligible?
- —
Personal DTI + credit; lowest rate.
DSCR
20% down · 8.5% · 30yr
- Down + closing
- —
- Monthly P&I
- —
- Monthly cashflow
- —
- DSCR
- —
- Eligible?
- —
No personal income docs; deal must DSCR.
Hard money
10% down · 12.0% · 12mo
- Down + closing
- —
- Monthly P&I
- —
- Monthly cashflow
- —
- DSCR
- —
- Eligible?
- —
Short-term bridge; refi at stabilization.
Rent comps 40 comps
| Address | Beds | Baths | Sqft | Rent | $/sqft | DOM | Units | Dist |
|---|---|---|---|---|---|---|---|---|
| 2218 Quality Life Center Way Fort Myers, FL | 4.0 | 2.0 | 1257 | $2,250 | $1.79 | 23d | 1 | 0.03mi |
| 4051 Regata Way Fort Myers, FL | 1.0–3.0 | 1.0–2.0 | 987 | $2,021 | $2.05 | 2d | 34 | 0.08mi |
| 3034 Price Ave Fort Myers, FL | 3.0 | 2.0 | 1367 | $2,100 | $1.54 | 3d | 1 | 0.18mi |
| 3306 Bassie Ct Fort Myers, FL | 4.0 | 2.0 | 1257 | $2,100 | $1.67 | 23d | 1 | 0.21mi |
| 2955 Dunbar St Unit A Fort Myers, FL | 3.0 | 2.0 | 1285 | $2,300 | $1.79 | 15d | 1 | 0.30mi |
| 3341 Willard St Fort Myers, FL | 4.0 | 2.0 | 1257 | $2,500 | $1.99 | 15d | 1 | 0.39mi |
| 3341 Willard St Fort Myers, FL | 4.0 | 2.0 | 1619 | $2,500 | $1.54 | 19d | 1 | 0.39mi |
| 2188 Barker Blvd Fort Myers, FL | 4.0 | 2.0 | 1367 | $2,600 | $1.90 | 23d | 1 | 0.60mi |
| 2132 Barker Blvd Fort Myers, FL | 4.0 | 2.0 | 1367 | $2,600 | $1.90 | 23d | 1 | 0.61mi |
| 2132 Barker Blvd Fort Myers, FL | 4.0 | 2.0 | 1979 | $2,600 | $1.31 | 3d | 1 | 0.61mi |
| 2197 Davis Ct Fort Myers, FL | 4.0 | 2.0 | 1257 | $2,450 | $1.95 | 2d | 1 | 0.68mi |
| 2627 Saint Charles St Fort Myers, FL | 4.0 | 2.0 | 1400 | $1,850 | $1.32 | 14d | 1 | 0.73mi |
| 2656 Lime St Fort Myers, FL | 4.0 | 2.0 | 1232 | $1,700 | $1.38 | 3d | 1 | 0.79mi |
| 1775 Glenway Ct Fort Myers, FL | 4.0 | 2.0 | 1367 | $2,600 | $1.90 | 23d | 1 | 0.90mi |
| 2579 Second St Fort Myers, FL | 3.0 | 2.0 | 1404 | $2,500 | $1.78 | 15d | 1 | 1.01mi |
| 2330 Hoople St Fort Myers, FL | 3.0 | 2.0 | 1250 | $1,750 | $1.40 | 15d | 1 | 1.10mi |
| 2825 Palm Beach Blvd Fort Myers, FL | 1.0–3.0 | 1.5–2.5 | 990 | $2,200 | $2.22 | 10d | 7 | 1.13mi |
| 2743 First St Unit 605 Fort Myers, FL | 3.0 | 2.0 | 1721 | $2,750 | $1.60 | 23d | 1 | 1.16mi |
| 2743 1st St #506 Fort Myers, FL | 3.0 | 2.0 | 1663 | $2,200 | $1.32 | 23d | 1 | 1.16mi |
| 2743 1st St #2102 Fort Myers, FL | 3.0 | 2.0 | 1656 | $2,800 | $1.69 | 23d | 1 | 1.16mi |
| 2743 1st St #2206 Fort Myers, FL | 3.0 | 2.0 | 1756 | $2,600 | $1.48 | 23d | 1 | 1.16mi |
| 2743 1st St #405 Fort Myers, FL | 3.0 | 2.0 | 1721 | $2,500 | $1.45 | 23d | 1 | 1.16mi |
| 2743 1st St #304 Fort Myers, FL | 3.0 | 2.0 | 1341 | $2,300 | $1.72 | 23d | 1 | 1.16mi |
| 2743 1st St #803 Fort Myers, FL | 3.0 | 2.0 | 1571 | $5,500 | $3.50 | 23d | 1 | 1.16mi |
| 2745 1st St #404 Fort Myers, FL | 3.0 | 2.0 | 1408 | $2,750 | $1.95 | 23d | 1 | 1.18mi |
| 2745 1st St #2703 Fort Myers, FL | 3.0 | 2.0 | 1408 | $3,000 | $2.13 | 23d | 1 | 1.18mi |
| 2745 1st St #2602 Fort Myers, FL | 3.0 | 2.0 | 1656 | $6,000 | $3.62 | 23d | 1 | 1.18mi |
| 2745 1st St #1903 Fort Myers, FL | 3.0 | 2.0 | 1408 | $5,500 | $3.91 | 23d | 1 | 1.18mi |
| 2745 1st St #306 Fort Myers, FL | 3.0 | 2.0 | 1602 | $2,100 | $1.31 | 23d | 1 | 1.18mi |
| 2797 1st St #2202 Fort Myers, FL | 3.0 | 2.5 | 1954 | $4,300 | $2.20 | 3d | 1 | 1.18mi |
| 2797 1st St #1602 Fort Myers, FL | 3.0 | 2.0 | 1459 | $2,495 | $1.71 | 23d | 1 | 1.18mi |
| 2797 First St Unit 1546387P Fort Myers, FL | 3.0 | 3.0 | 1442 | $3,059 | $2.12 | 14d | 1 | 1.18mi |
| 3000 Oasis Grand Blvd #801 Fort Myers, FL | 3.0 | 2.5 | 1854 | $4,000 | $2.16 | 23d | 1 | 1.19mi |
| 3000 Oasis Grand Blvd #2004 Fort Myers, FL | 3.0 | 2.5 | 1708 | $2,995 | $1.75 | 11d | 1 | 1.19mi |
| 3000 Oasis Grand Blvd #2004 Fort Myers, FL | 3.0 | 2.5 | 1708 | $2,995 | $1.75 | 23d | 1 | 1.19mi |
| 3000 Oasis Grand Blvd #401 Fort Myers, FL | 3.0 | 2.5 | 1854 | $3,000 | $1.62 | 23d | 1 | 1.19mi |
| 2745 1st St #1006 Fort Myers, FL | 3.0 | 2.0 | 1721 | $2,500 | $1.45 | 23d | 1 | 1.19mi |
| 3000 Oasis Grand Blvd Unit LPH1 Fort Myers, FL | 3.0 | 2.5 | 1584 | $5,000 | $3.16 | 15d | 1 | 1.19mi |
| 3040 Oasis Grand Blvd Fort Myers, FL | 1.0–4.0 | 1.0–2.0 | 1444 | $3,759 | $2.60 | 1d | 68 | 1.22mi |
| 2330 Union St Fort Myers, FL | 3.0 | 1.0–2.0 | 951 | $3,714 | $3.90 | 3d | 27 | 1.25mi |
Listing history 31 events
-
2026-06-17days on market $235,000 Active 42 DOM
-
2026-06-16days on market $235,000 Active 41 DOM
-
2026-06-15days on market $235,000 Active 40 DOM
-
2026-06-13days on market $235,000 Active 38 DOM
-
2026-06-10days on market $235,000 Active 35 DOM
-
2026-06-09days on market $235,000 Active 34 DOM
-
2026-06-08days on market $235,000 Active 33 DOM
-
2026-06-07days on market $235,000 Active 32 DOM
-
2026-06-03days on market $235,000 Active 28 DOM
-
2026-06-02days on market $235,000 Active 27 DOM
-
2026-06-01days on market $235,000 Active 26 DOM
-
2026-05-31days on market $235,000 Active 25 DOM
-
2026-05-19price $245,000
-
2026-05-06$250,000 Active
-
2016-07-06soldstatus $71,000
-
2016-07-05price $71,000 234-char remark
Show marketing remark (234 chars)
Great investment opportunity! Nice 4/2, 1,872 sq. ft Duplex with tenants in place! Built in 1981, each unit has central a/c & heat, 2 bedrooms 1 Bath, 936 sq. ft under air. Get it while its HOT and start making money right away!
-
2016-07-01price $75,500 234-char remark
Show marketing remark (234 chars)
Great investment opportunity! Nice 4/2, 1,872 sq. ft Duplex with tenants in place! Built in 1981, each unit has central a/c & heat, 2 bedrooms 1 Bath, 936 sq. ft under air. Get it while its HOT and start making money right away!
-
2016-07-01soldstatus $71,000 Sold 234-char remark
Show marketing remark (234 chars)
Great investment opportunity! Nice 4/2, 1,872 sq. ft Duplex with tenants in place! Built in 1981, each unit has central a/c & heat, 2 bedrooms 1 Bath, 936 sq. ft under air. Get it while its HOT and start making money right away!
-
2016-06-10status Pending 234-char remark
Show marketing remark (234 chars)
Great investment opportunity! Nice 4/2, 1,872 sq. ft Duplex with tenants in place! Built in 1981, each unit has central a/c & heat, 2 bedrooms 1 Bath, 936 sq. ft under air. Get it while its HOT and start making money right away!
-
2016-04-12$75,500 Active 234-char remark
Show marketing remark (234 chars)
Great investment opportunity! Nice 4/2, 1,872 sq. ft Duplex with tenants in place! Built in 1981, each unit has central a/c & heat, 2 bedrooms 1 Bath, 936 sq. ft under air. Get it while its HOT and start making money right away!
-
2015-11-19historical
-
2015-09-17price $76,000
-
2015-05-25$79,000 Active
-
2011-03-24soldstatus $32,500
-
2011-03-11soldstatus $32,500
-
2011-02-15price $38,000
-
2009-07-24soldstatus $6,500
-
2009-06-21price $11,000
-
2006-07-10soldstatus $132,800
-
2006-07-10soldstatus $132,800
-
1988-06-16soldstatus $22,000
ⓘ Source: listings_history table (triggers on properties + properties_extension) + one-shot
backfill from property_details.listing_events for pre-trigger history.
Tax reassessment forecast FL · Resets to sale price
- Current annual tax
- $3,920 · $327/mo
- Projected year-2 tax
- $3,920 · $327/mo
- Expected delta
- $0/yr ($0/mo · 0.0%)
ⓘ Screening estimate from a state-policy table — verify with the county assessor before closing.
Climate risk First Street
- Flood 1/10 Low FEMA zone X (unshaded) · 0% chance over 30 yrs
- Wildfire 1/10 Low
- Heat 10/10 Extreme 7 d/yr ≥107°F today · 31 d/yr by 30 yrs out
- Wind 10/10 Extreme 99% chance of damaging wind over 30 yrs
- Air quality 2/10 Low 1 unhealthy d/yr today · 1 by 30 yrs out
Nearby sold comps map
Loading sold comps map…
Walkable amenities ~0.75 mi
Loading nearby amenities…
Taxation est. · year 1
- Rental income
- $37,056
- − Mortgage interest
- −$13,164
- − Property taxes
- −$3,920
- − Insurance
- −$1,175
- − Repairs & maintenance
- −$2,964
- − Management
- −$2,964
- − Depreciation
- −$6,836
- Taxable income
- $6,032
- Est. tax owed @ 24.0%
- −$1,448
- After-tax cash flow
- $7,943/yr
For passive investors: Depreciation is non-cash, so a rental often shows a tax loss while cash-flowing — sheltering income. Rental losses are passive: they offset passive income freely, and up to $25,000/yr can offset ordinary (W-2) income if you actively participate and your MAGI is under $100k (phasing out to $0 by $150k); unused losses carry forward. On sale, claimed depreciation is recaptured at up to 25%, and gains may owe capital-gains tax (a 1031 exchange can defer both). Figures are a year-1 estimate at your 24.0% rate — not tax advice; consult a CPA.
Schools (NCES district)
- District
- Lee
- NCES district ID
- 1201080
- Math proficiency
- 47% ▼ -11.00%
- Reading proficiency
- 50% ▼ -4.00%
- Median HH income
- $49,518
- Composite
- 41.49/100
- National rank
- #3458
- State rank
- #42 of 73 in FL
Livability — Fort Myers
- Score
- 86/100
- State rank
- #14
- US rank
- #383
Category grades
Schools grade is shown separately in the Schools card above.
Census & demographics
- Census place
- Fort Myers, FL
- County
- Lee County · 788,662 people
- City population
- 278,598
- Metro
- Cape Coral-Fort Myers, FL
- Population (ZIP)
- 27,943
- Household income
- $52,586
- Rent vs Own
- Severe rent burden
- 2324.0
Population outlook (Lee County) Hauer SSP2
- Today (2025)
- 871,946 people
- By 2030
- 955,468 · +9.6%
- By 2040
- 1,113,587 · +27.7%
- By 2050
- 1,256,891 · +44.1%
- By 2075
- 1,560,270 · +78.9%
- By 2100
- 1,726,848 · +98.0%
Race, ethnicity, and origin ACS 2023
- Neighborhood character
- Highly diverse neighborhood (Simpson 0.71)
- Race & ethnicity
- Black 34% Hispanic / Latino 30% White 28% Two or more races 21% Asian 2%
- Hispanic origin (detail)
- Mexican 5% Puerto Rican 6% Cuban 7% Dominican 1%
- Common ancestry
- Estonian 3% Hispanic 1% Romanian 1%
- Foreign-born
- 22% · Canada, Vietnam, China
- Languages at home
- 69% English-only · Spanish 24% Other Indo-European 4% French/Haitian/Cajun 1%
Political lean MEDSL · Lee
- 2024 margin
- Strong R (+28.4) · D 35.5% · R 63.9%
- 2008→2024 swing
- -18.0pp toward R · 2008: -10.4pp · 2024: -28.4pp
- All cycles
- 2024: R+28.4 2020: R+19.2 2016: R+20.4 2012: R+16.6 2008: R+10.4
Not yet ingested
- Civics
- —
Market trends
- HPI YoY
- ▼ -95.73%
- Current HPI
- 243.2657
- Rent YoY
- ▼ -4.30%
- Metro
- Cape Coral-Fort Myers, FL
- State GDP YoY
- ▲ 3.28%
- F500 in state
- 36
Industry mix (Fortune 500 HQ in FL)
| Industry | F500 HQs | Revenue |
|---|---|---|
| Industrial Technology | 2 | $29B |
|
||
| Insurance | 2 | $17B |
|
||
| Retail | 1 | $60B |
|
||
| Technology Distribution | 1 | $58B |
|
||
| Homebuilding | 1 | $35B |
|
||
| Technology Manufacturing | 1 | $35B |
|
||
Price history
+1013.6% since first listed19 events — show timeline
- 2026-05-19 Price Changed $245,000 FORTMLS
- 2026-05-06 Listed $250,000 FORTMLS
- 2016-07-06 Sold (Public Records) $71,000 Public Records
- 2016-07-05 Price Changed $71,000 FORTMLS
- 2016-07-01 Sold (MLS) $71,000 FORTMLS
- 2016-07-01 Price Changed $75,500 FORTMLS
- 2016-06-10 Pending — FORTMLS
- 2016-04-12 Listed $75,500 FORTMLS
- 2015-11-19 Listing Removed — FORTMLS
- 2015-09-17 Price Changed $76,000 FORTMLS
- 2015-05-25 Listed $79,000 FORTMLS
- 2011-03-24 Sold (Public Records) $32,500 Public Records
- 2011-03-11 Sold (MLS) $32,500 FORTMLS
- 2011-02-15 Price Changed $38,000 FORTMLS
- 2009-07-24 Sold (MLS) $6,500 FORTMLS
- 2009-06-21 Price Changed $11,000 FORTMLS
- 2006-07-10 Sold (Public Records) $132,800 Public Records
- 2006-07-10 Sold (Public Records) $132,800 Public Records
- 1988-06-16 Sold (Public Records) $22,000 Public Records
Property tax history
+13.0%/yrLatest (2025): $3,920 · +8.8% YoY. Source: county tax records.
Cash-flow waterfall
monthlySold comps — $/sqft
last 12 mo · ≤1 miLoading sold comps…