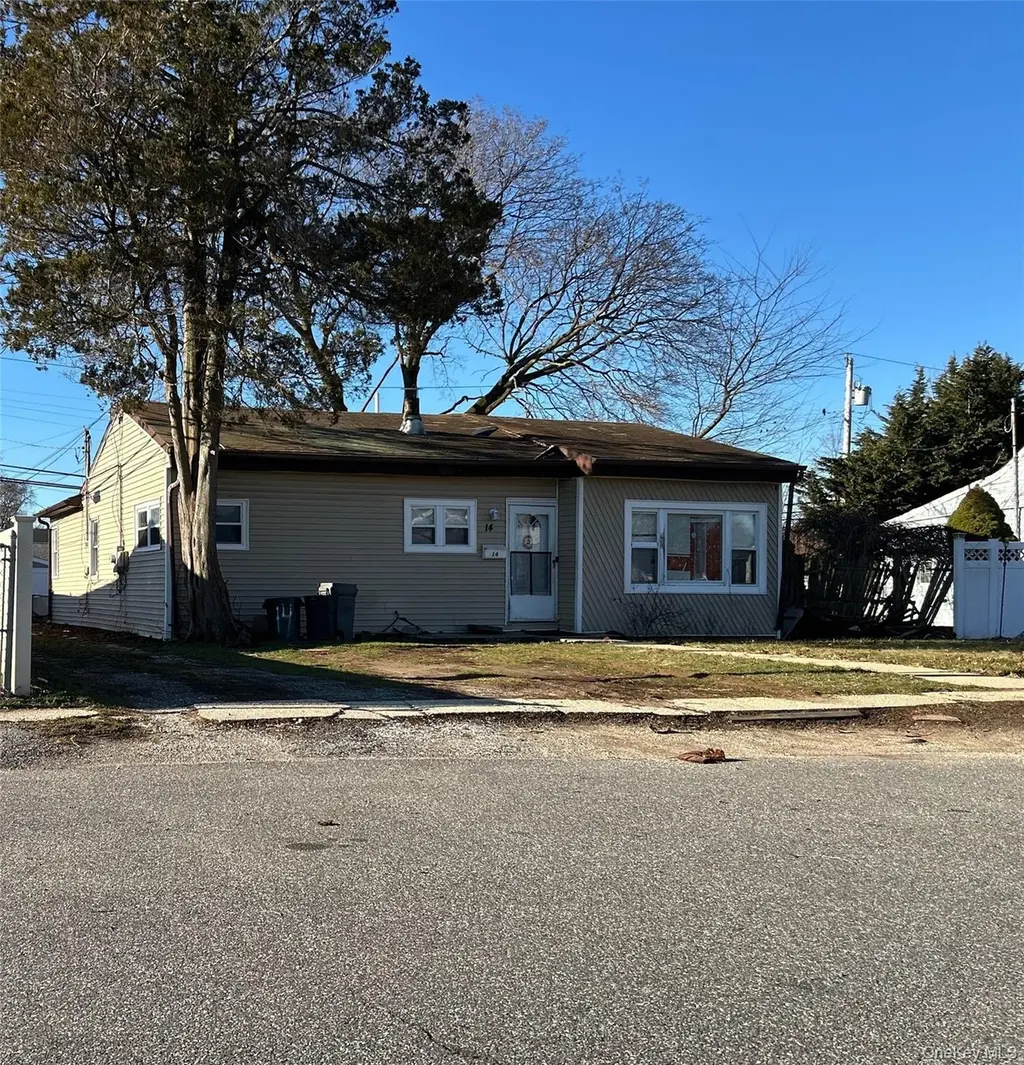
14 Chevy Chase · North Amityville, NY
Flood risk 1/10 · Minimal
- FEMA flood zone
- X (unshaded)
- Chance of flooding over 30 yrs
- 0.0%
- Est. flood insurance / yr
- $473 – $860
Fire risk 1/10 · Minimal
- Est. fire insurance / yr
- $691 – $1,283
Heat risk 5/10 · Moderate
- Hot days now (above 94°F)
- 7 days/yr
- Hot days in 30 yrs
- 17 days/yr
Wind risk 6/10 · Moderate
- Chance of severe wind over 30 yrs
- 63.0%
Air-quality risk 4/10 · Minor
- Unhealthy air days now
- 5 days/yr
- Unhealthy air days in 30 yrs
- 7 days/yr
Risk factors via First Street. Map © Google.
Why this score? — see what drove the C- grade
The composite is a weighted blend of 9 inputs, each scored 0–100. Each bar is that input's sub-score; the figure is the points it added to the 100-point composite (weight × sub-score).
- Cash flow +15.2/30.0
- ARV discount +15.0/15.0
- 1% rule +4.7/10.0
- DSCR +4.7/10.0
- Schools +3.5/10.0
- Livability +3.2/5.0
- Rent growth +2.5/5.0
- Condition / age +2.5/5.0
- Appreciation +0.0/10.0
$430,000
🖨 Deal sheet 📄 Offer letter ✓ Due diligence
Listing remarks MLS
Ranch-style home. This home features four bedrooms, a full bath, a formal dining room, an eat-in kitchen, and a one-car garage. Centrally located to all. Don't miss this opportunity!
Key facts
- 6,000 sq ft lot
- Built 1950
- Listed 83 days
Neighborhood map
What this means for you Summary
Snapshot
- This is a 4-bed/1.0-bath single-family listed at $430k.
Deal economics
- At list price, monthly cash flow is $148 ($2k/yr) — positive.
- The deal already cash-flows at list — no discount required.
- To meet the 1% rule (rent ≥ 1% of price), the offer needs to be $417k (3.0% below list).
- Recommended offer: $404k (6.0% below list) — sets the bar for market timing.
- Cap rate 6.7% vs local median 3.8% in North Amityville — top-decile yield for the area; either an underpriced asset or a hidden risk that comps aren't pricing in. Stress-test before assuming the spread holds.
Location & tenants
- Location reads 64/100 on livability (#770 in NY) — a middle-class / working-renter tenant base. Strengths: employment A+, housing A+, commute B; Watch: crime C-, schools D, amenities F.
- Copiague Union Free School District (suburban): math 38% / reading 39% proficiency, ranked #506 of 590 in NY (top 86%) — families likely to look elsewhere, expect single-tenant / working-renter base with shorter leases.
- Market conditions: 123 active listings in the ZIP; 2 comparable units currently listed for rent nearby; high-income renter base; 1,366 units permitted in Suffolk County in 2024 (216 in 5+ unit buildings).
- This rent runs 43% of the median local income ($117k/yr) — at the standard rent-burdened threshold; future hikes will face affordability resistance.
Forward outlook
- Local home prices are declining (-3.0%/yr); year-one equity from $3k of loan paydown is wiped out by about $13k of value loss. Plan a longer hold.
- Suffolk County population projected to shrink 5% by 2050 — rents likely to lag national; underwrite the cash flow, not the appreciation.
Negotiation context
- It's been on market 83 days — a 6% lower offer ($404k) is reasonable based on typical stale-listing flexibility.
- 3 sale attempts with the ask held roughly flat each time — persistent listings suggest the price (not the market) is what's stuck; bring a comps-based counter.
- Current owner paid $290k; 48% above their basis — modest negotiation headroom, anchor on the comps not their cost.
Risks & watch-outs
- Watch-outs: built in 1950 — expect roof / HVAC / electrical / plumbing capex.
- Climate carrying-cost: major wind risk, 63% chance of damaging wind over 30y; extreme-heat days projected 7→17/yr by 2055 (HVAC capex compounding) — expect insurance premiums to compound above CPI over the hold.
Questions for the listing agent
- It's been on market 83 days. Have you received any prior offers? Is the seller open to a 6% concession, seller financing, or rate buy-down credit?
- Built in 1950 — when were the roof, HVAC, electrical panel, plumbing, and water heater last replaced?
- Why hasn't it sold? Are there any deal-killer items the seller is aware of (foundation, flood, title, zoning, code violations)?
- Is there a deadline driving the sale (1031 exchange, divorce, estate, relocation)? That informs how much negotiation room exists.
- Schools are D-rated, which usually means shorter tenancies and higher turnover. Who's the typical renter profile here, and what's been the actual vacancy rate?
- What's the average days-on-market for RENTAL listings here right now (not sales)? A rising rental-DOM trend means longer vacancies and softer asking-rent achievability than the comps imply.
- What's the recent tenant-quality profile in this submarket — average credit score on applications, eviction rate, late-payment / NSF rate, and stable-employment percentage? A property-management company in the area should have these aggregated.
- How much new for-sale + rental construction is in the pipeline within 1–3 miles? Heavy new supply typically softens prices + rents 12–24 months out; constrained supply supports both.
Investment metrics
- 1% rule
- 0.97% ✗
- Cap rate
- 6.71%
- Cash-on-cash
- 1.48%
- DSCR
- 1.07
- GRM
- 8.6
CMA / ARV
- ARV (median comp)
- $570,329
- List price
- $430,000
- Delta
- -24.60%
- Verdict
- UNDERPRICED
- Comps
- 20 within 1.0 mi
Show comp detail 12 sales within ~0.75 mi
| Address | Dist | Beds/Ba | Sqft | Sold | Price | $/sf | Match |
|---|---|---|---|---|---|---|---|
| 34 Croydon Rd | 0.14mi | 3/1.0 (-1) | 979 (-14%) | 1mo | $540,000 | $552 | 64 |
| 3 Emerald Ln S | 0.11mi | 3/1.0 (-1) | 1,042 (-9%) | 16mo | $490,000 | $470 | 62 |
| 129 43rd St | 0.32mi | 4/2.0 | 1,225 (+7%) | 9mo | $560,000 | $457 | 61 |
| 1 Somerset Rd W | 0.12mi | 3/2.0 (-1) | 1,007 (-12%) | 8mo | $500,000 | $497 | 59 |
| 29 Coolidge Ave | 0.67mi | 3/1.0 (-1) | 1,190 (+4%) | 6mo | $409,000 | $344 | 52 |
| 85 Williams Ave | 0.62mi | 3/2.0 (-1) | 1,100 (-4%) | 6mo | $598,000 | $544 | 51 |
| 19 Beta Dr | 0.39mi | 3/2.0 (-1) | 1,100 (-4%) | 20mo | $595,000 | $541 | 50 |
| 466 44th St | 0.72mi | 4/1.0 | 1,270 (+11%) | 3mo | $395,000 | $311 | 46 |
| 52 Columbus Blvd | 0.74mi | 3/1.0 (-1) | 1,082 (-5%) | 9mo | $499,999 | $462 | 44 |
| 60 Overland Ave | 0.61mi | 3/2.0 (-1) | 1,232 (+8%) | 8mo | $520,000 | $422 | 43 |
| 6 Rodney Pl | 0.72mi | 3/2.0 (-1) | 1,100 (-4%) | 14mo | $595,000 | $541 | 39 |
| 388 Vespucci Ave | 0.72mi | 3/2.0 (-1) | 1,020 (-11%) | 2mo | $420,000 | $412 | 38 |
Match score weights: distance 35% · size 25% · config 20% · recency 20%. Top-matched comps best support the ARV.
Projected returns pro-forma
-3.0% appreciation · 3.0% rent growth · sell at horizon
- IRR
- -13.9%
- Equity multiple
- 0.50×
- Total profit
- $-60,078
- Equity at exit
- $64,114
- IRR
- -5.0%
- Equity multiple
- 0.67×
- Total profit
- $-39,477
- Equity at exit
- $37,179
Cash invested: $120,400 (down + closing). Projections, not guarantees.
Landlord ↔ Tenant lean methodology
- Overall (STATE)
- 15 Strongly Tenant-Friendly
- State New York
- 15 Strongly Tenant-Friendly · D+10
- County
- — inherits STATE
- City
- — inherits STATE
ZIP-level market 11701
- Active inventory
- 123
- Price-to-rent
- 8.6×
Monthly cashflow live
- Estimated rent
- $4,173 medium interval (Pro) →
- Mortgage (P&I)
- −$2,255
- Tax from tax record
- −$714 /mo · $8,573/yr
- Insurance
- −$179
- HOA
- −$0
- Vacancy / Maint / Mgmt
- −$876
- Net cashflow
- $148
Break-even live
UW: 25.0% down · 7.5% · 30yr · 1.5% tax · 5.0% vac · 8.0% maint · 8.0% mgmt
Financing live
Cash to close
- Down payment
- $107,500
- Closing costs
- $12,900
- Reserves months
- —
- Total cash needed
- —
Loan-product check · same deal, 3 products live
Conventional
25% down · 7.5% · 30yr
- Down + closing
- —
- Monthly P&I
- —
- Monthly cashflow
- —
- DSCR
- —
- Eligible?
- —
Personal DTI + credit; lowest rate.
DSCR
20% down · 8.5% · 30yr
- Down + closing
- —
- Monthly P&I
- —
- Monthly cashflow
- —
- DSCR
- —
- Eligible?
- —
No personal income docs; deal must DSCR.
Hard money
10% down · 12.0% · 12mo
- Down + closing
- —
- Monthly P&I
- —
- Monthly cashflow
- —
- DSCR
- —
- Eligible?
- —
Short-term bridge; refi at stabilization.
Rent comps 2 comps
| Address | Beds | Baths | Sqft | Rent | $/sqft | DOM | Units | Dist |
|---|---|---|---|---|---|---|---|---|
| 366 Broadway Amityville, NY | 3.0 | 1.0–2.5 | 1354 | $5,070 | $3.74 | 1d | 1 | 0.92mi |
| 158 Oldfield Ave Amityville, NY | 3.0 | 2.0 | 1200 | $3,100 | $2.58 | 18d | 1 | 1.47mi |
Listing history 11 events
-
2026-02-25$430,000 Active 182-char remark
Show marketing remark (182 chars)
Ranch-style home. This home features four bedrooms, a full bath, a formal dining room, an eat-in kitchen, and a one-car garage. Centrally located to all. Don't miss this opportunity!
-
2025-10-10historical
-
2025-08-27price $449,990
-
2025-08-27status Active
-
2025-07-16status Pending
-
2025-07-16price $453,000
-
2025-06-06price $395,000
-
2025-05-22$300,000 Active
-
2025-05-08historical
-
2006-03-27soldstatus $290,000
-
2004-10-19soldstatus $255,000
ⓘ Source: listings_history table (triggers on properties + properties_extension) + one-shot
backfill from property_details.listing_events for pre-trigger history.
Tax reassessment forecast NY · Partial reset (capped growth)
- Current annual tax
- $8,573 · $714/mo
- Projected year-2 tax
- $8,573 · $714/mo
- Expected delta
- $0/yr ($0/mo · 0.0%)
ⓘ Screening estimate from a state-policy table — verify with the county assessor before closing.
Climate risk First Street
- Flood 1/10 Low FEMA zone X (unshaded) · 0% chance over 30 yrs
- Wildfire 1/10 Low
- Heat 5/10 Major 7 d/yr ≥94°F today · 17 d/yr by 30 yrs out
- Wind 6/10 Major 63% chance of damaging wind over 30 yrs
- Air quality 4/10 Moderate 5 unhealthy d/yr today · 7 by 30 yrs out
Nearby sold comps map
Loading sold comps map…
Walkable amenities ~0.75 mi
Loading nearby amenities…
Taxation est. · year 1
- Rental income
- $50,075
- − Mortgage interest
- −$24,087
- − Property taxes
- −$8,573
- − Insurance
- −$2,150
- − Repairs & maintenance
- −$4,006
- − Management
- −$4,006
- − Depreciation
- −$12,509
- Taxable loss
- −$5,256
- Est. tax savings @ 24.0%
- +$1,261
- After-tax cash flow
- $3,038/yr
For passive investors: Depreciation is non-cash, so a rental often shows a tax loss while cash-flowing — sheltering income. Rental losses are passive: they offset passive income freely, and up to $25,000/yr can offset ordinary (W-2) income if you actively participate and your MAGI is under $100k (phasing out to $0 by $150k); unused losses carry forward. On sale, claimed depreciation is recaptured at up to 25%, and gains may owe capital-gains tax (a 1031 exchange can defer both). Figures are a year-1 estimate at your 24.0% rate — not tax advice; consult a CPA.
Schools (NCES district)
- District
- Copiague Union Free School District
- NCES district ID
- 3608310
- Math proficiency
- 38% ▼ -12.00%
- Reading proficiency
- 39% ▼ -9.00%
- Median HH income
- $69,215
- Composite
- 35.09/100
- National rank
- #5020
- State rank
- #506 of 590 in NY
Livability — North Amityville
- Score
- 64/100
- State rank
- #770
- US rank
- #14746
Category grades
Schools grade is shown separately in the Schools card above.
Census & demographics
- Census place
- North Amityville, NY
- County
- Suffolk County · 679,920 people
- Metro
- New York-Newark-Jersey City, NY-NJ-PA
- Population (ZIP)
- 29,509
- Household income
- $117,033
- Rent vs Own
- Severe rent burden
- 959.0
Population outlook (Suffolk County) Hauer SSP2
- Today (2025)
- 1,505,262 people
- By 2030
- 1,498,318 · -0.5%
- By 2040
- 1,471,101 · -2.3%
- By 2050
- 1,424,848 · -5.3%
- By 2075
- 1,337,157 · -11.2%
- By 2100
- 1,217,720 · -19.1%
Race, ethnicity, and origin ACS 2023
- Neighborhood character
- Highly diverse neighborhood (Simpson 0.70)
- Race & ethnicity
- White 37% Black 28% Hispanic / Latino 28% Two or more races 12% Asian 2%
- Hispanic origin (detail)
- Puerto Rican 2% Dominican 3%
- Common ancestry
- Hispanic 4% Romanian 2% Slovak 1%
- Foreign-born
- 24% · Canada, Jamaica, China
- Languages at home
- 71% English-only · Spanish 20% French/Haitian/Cajun 3% Other Indo-European 3%
Political lean MEDSL · Suffolk
- 2024 margin
- Lean R (+10.0) · D 45.0% · R 55.0%
- 2008→2024 swing
- -16.0pp toward R · 2008: 6.0pp · 2024: -10.0pp
- All cycles
- 2024: R+10.0 2020: R+0.0 2016: R+8.2 2012: D+2.9 2008: D+6.0
Not yet ingested
- Civics
- —
Market trends
- HPI YoY
- ▼ -345.15%
- Current HPI
- 306.4465
- Rent YoY
- —
- Metro
- New York-Newark-Jersey City, NY-NJ-PA
- State GDP YoY
- ▲ 2.60%
- F500 in state
- 92
Industry mix (Fortune 500 HQ in NY)
| Industry | F500 HQs | Revenue |
|---|---|---|
| Financial Services | 10 | $950B |
|
||
| Consumer Goods | 9 | $162B |
|
||
| Insurance | 4 | $225B |
|
||
| Telecommunications | 2 | $144B |
|
||
| Pharmaceuticals | 2 | $112B |
|
||
| Media / Entertainment | 2 | $69B |
|
||
Price history
+68.6% since first listed11 events — show timeline
- 2026-02-25 Listed $430,000 OneKey® MLS as Distributed by MLS Grid
- 2025-10-10 Listing Removed — OneKey® MLS as Distributed by MLS Grid
- 2025-08-27 Price Changed $449,990 OneKey® MLS as Distributed by MLS Grid
- 2025-08-27 Relisted — OneKey® MLS as Distributed by MLS Grid
- 2025-07-16 Pending — OneKey® MLS as Distributed by MLS Grid
- 2025-07-16 Price Changed $453,000 OneKey® MLS as Distributed by MLS Grid
- 2025-06-06 Price Changed $395,000 OneKey® MLS as Distributed by MLS Grid
- 2025-05-22 Listed $300,000 OneKey® MLS as Distributed by MLS Grid
- 2025-05-08 Coming Soon — OneKey® MLS as Distributed by MLS Grid
- 2006-03-27 Sold (Public Records) $290,000 Public Records
- 2004-10-19 Sold (Public Records) $255,000 Public Records
Property tax history
+2.1%/yrLatest (2025): $8,573 · +0.0% YoY. Source: county tax records.
Cash-flow waterfall
monthlySold comps — $/sqft
last 12 mo · ≤1 miLoading sold comps…