 🏷️ Likely Rental
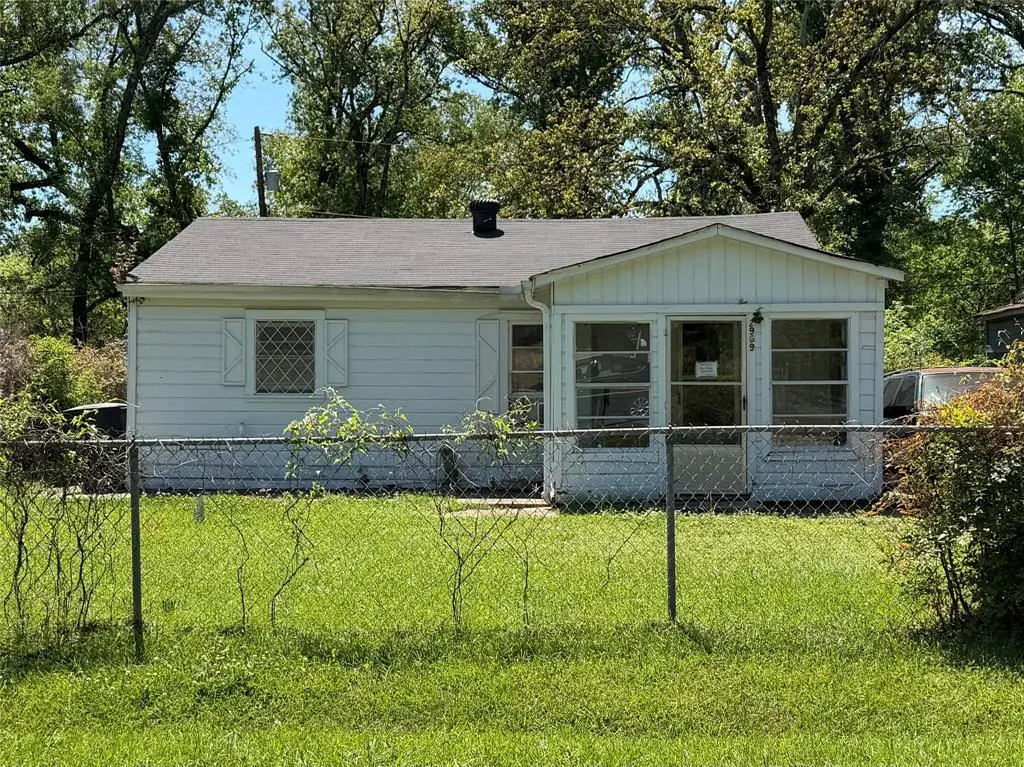
2969 Nena St · Shreveport, LA
Flood risk 1/10 · Minimal
- FEMA flood zone
- X (unshaded)
- Chance of flooding over 30 yrs
- 0.0%
- Est. flood insurance / yr
- $507 – $1,088
Fire risk 2/10 · Minimal
- Est. fire insurance / yr
- $1,269 – $2,357
Heat risk 7/10 · Major
- Hot days now (above 110°F)
- 7 days/yr
- Hot days in 30 yrs
- 22 days/yr
Wind risk 6/10 · Moderate
- Chance of severe wind over 30 yrs
- 63.0%
Air-quality risk 2/10 · Minimal
- Unhealthy air days now
- 1 days/yr
- Unhealthy air days in 30 yrs
- 1 days/yr
Risk factors via First Street. Map © Google.
Why this score? — see what drove the D grade
The composite is a weighted blend of 9 inputs, each scored 0–100. Each bar is that input's sub-score; the figure is the points it added to the 100-point composite (weight × sub-score).
- Cash flow +15.0/30.0
- ARV discount +7.5/15.0
- 1% rule +5.0/10.0
- DSCR +5.0/10.0
- Livability +3.0/5.0
- Rent growth +2.5/5.0
- Condition / age +2.5/5.0
- Schools +2.2/10.0
- Appreciation +0.0/10.0
$27,000
🖨 Deal sheet 📄 Offer letter ✓ Due diligence
Listing remarks MLS
DO NOT DISTURB TENANTS! This little gem is your opportunity to add a rental property to your portfolio with built-in, consistent cash flow. Current tenants pay $500 monthly on a month-to-month lease. This property has been maintained well and is more spacious than what meets the eye. 3 beds, 2 baths, plus a laundry room. Eat-in kitchen plus a dining room. Sale is as-is, where-is with no repairs. Approaching this property without listing agent permission is trespassing! LISTING AGENT HAS MORE PHOTOS ON REQUEST.
Key facts
- 6,752 sq ft lot
- Built 1985
- Listed 71 days
Neighborhood map
What this means for you Summary
Snapshot
- This is a 3-bed/1.0-bath single-family listed at $27k.
Deal economics
- At list price, monthly cash flow is $881 ($11k/yr) — positive.
- The deal already cash-flows at list — no discount required.
- Meets the 1% rule at list price ($1k rent vs $27k).
- Recommended offer: $25k (6.0% below list) — sets the bar for market timing.
- Cap rate 45.4% vs local median 5.7% in Shreveport — top-decile yield for the area; either an underpriced asset or a hidden risk that comps aren't pricing in. Stress-test before assuming the spread holds.
Location & tenants
- Location reads 59/100 on livability (#270 in LA) — a working-class tenant base; expect higher turnover. Strengths: cost of living A+, housing A; Watch: schools D+, crime F, amenities F.
- Caddo Parish (urban): math 21% / reading 32% proficiency, ranked #53 of 98 in LA (top 54%) — low school quality limits family demand, transient renter base, plan for 1-2y turnover; 64% free/reduced lunch — lower-income household profile, screen leases tightly.
- Market conditions: 262 active listings in the ZIP; 1 comparable units currently listed for rent nearby; 221 units permitted in Caddo Parish in 2024 (0 in 5+ unit buildings).
- This rent runs 33% of the median local income ($48k/yr) — at the standard rent-burdened threshold; future hikes will face affordability resistance.
Forward outlook
- Local home prices are declining (-3.0%/yr); year-one equity from $187 of loan paydown is wiped out by about $810 of value loss. Plan a longer hold.
- Caddo County population projected at -15% by 2050 — secular population decline; favor cash flow + early exit over multi-decade hold.
- At projected returns (-3.0% appreciation + 3.0% rent growth), your $8k cash investment doubles in ~1 year — after that, you're playing with house money.
Negotiation context
- It's been on market 71 days — a 6% lower offer ($25k) is reasonable based on typical stale-listing flexibility.
Risks & watch-outs
- Climate carrying-cost: major wind risk, 63% chance of damaging wind over 30y; extreme-heat days projected 7→22/yr by 2055 (HVAC capex compounding) — expect insurance premiums to compound above CPI over the hold.
Questions for the listing agent
- It's been on market 71 days. Have you received any prior offers? Is the seller open to a 6% concession, seller financing, or rate buy-down credit?
- Why hasn't it sold? Are there any deal-killer items the seller is aware of (foundation, flood, title, zoning, code violations)?
- Is there a deadline driving the sale (1031 exchange, divorce, estate, relocation)? That informs how much negotiation room exists.
- Schools are D-rated, which usually means shorter tenancies and higher turnover. Who's the typical renter profile here, and what's been the actual vacancy rate?
- Crime grade is F in this area — have there been break-ins, vandalism, or insurance claims at this property in the last 3 years? What carrier currently insures it and at what premium?
- The area grade is low — what's the realistic commute time and amenity access for the typical tenant pool here? Any planned neighborhood developments (good or bad) we should know about?
- What's the average days-on-market for RENTAL listings here right now (not sales)? A rising rental-DOM trend means longer vacancies and softer asking-rent achievability than the comps imply.
- What's the recent tenant-quality profile in this submarket — average credit score on applications, eviction rate, late-payment / NSF rate, and stable-employment percentage? A property-management company in the area should have these aggregated.
- How much new for-sale + rental construction is in the pipeline within 1–3 miles? Heavy new supply typically softens prices + rents 12–24 months out; constrained supply supports both.
Investment metrics
- 1% rule
- 4.97% ✓
- Cap rate
- 45.43%
- Cash-on-cash
- 139.76%
- DSCR
- 7.22
- GRM
- 1.7
CMA / ARV
- ARV (median comp)
- $89,334
- List price
- $27,000
- Delta
- -69.78%
- Verdict
- UNDERPRICED
- Comps
- 20 within 1.0 mi
Show comp detail 4 sales within ~0.75 mi
| Address | Dist | Beds/Ba | Sqft | Sold | Price | $/sf | Match |
|---|---|---|---|---|---|---|---|
| 2832 Round Grove Ln | 0.53mi | 3/1.5 | 1,096 (-12%) | 2mo | $24,000 | $22 | 51 |
| 1644 Shepherd Dr | 0.67mi | 3/2.0 | 1,162 (-7%) | 8mo | $145,000 | $125 | 46 |
| 1629 Shepherd Dr | 0.72mi | 3/2.0 | 1,246 (-0%) | 21mo | $140,000 | $112 | 44 |
| 2066 Linear St #10 | 0.62mi | 3/2.0 | 1,414 (+13%) | 7mo | $76,000 | $54 | 39 |
Match score weights: distance 35% · size 25% · config 20% · recency 20%. Top-matched comps best support the ARV.
Projected returns pro-forma
-3.0% appreciation · 3.0% rent growth · sell at horizon
- IRR
- —
- Equity multiple
- 7.84×
- Total profit
- $51,721
- Equity at exit
- $4,026
- IRR
- —
- Equity multiple
- 16.52×
- Total profit
- $117,315
- Equity at exit
- $2,334
Cash invested: $7,560 (down + closing). Projections, not guarantees.
Landlord ↔ Tenant lean methodology
- Overall (STATE)
- 90 Strongly Landlord-Friendly
- State Louisiana
- 90 Strongly Landlord-Friendly · R+12
- County
- — inherits STATE
- City
- — inherits STATE
ZIP-level market 71107
- Home prices YoY
- -34.5%
- Active inventory
- 262
- Price-to-rent
- 1.7×
Monthly cashflow live
- Estimated rent
- $1,342 medium interval (Pro) →
- Mortgage (P&I)
- −$142
- Tax from tax record
- −$27 /mo · $326/yr
- Insurance
- −$11
- HOA
- −$0
- Vacancy / Maint / Mgmt
- −$282
- Net cashflow
- $881
Break-even live
UW: 25.0% down · 7.5% · 30yr · 1.5% tax · 5.0% vac · 8.0% maint · 8.0% mgmt
Financing live
Cash to close
- Down payment
- $6,750
- Closing costs
- $810
- Reserves months
- —
- Total cash needed
- —
Loan-product check · same deal, 3 products live
Conventional
25% down · 7.5% · 30yr
- Down + closing
- —
- Monthly P&I
- —
- Monthly cashflow
- —
- DSCR
- —
- Eligible?
- —
Personal DTI + credit; lowest rate.
DSCR
20% down · 8.5% · 30yr
- Down + closing
- —
- Monthly P&I
- —
- Monthly cashflow
- —
- DSCR
- —
- Eligible?
- —
No personal income docs; deal must DSCR.
Hard money
10% down · 12.0% · 12mo
- Down + closing
- —
- Monthly P&I
- —
- Monthly cashflow
- —
- DSCR
- —
- Eligible?
- —
Short-term bridge; refi at stabilization.
Rent comps 1 comps
| Address | Beds | Baths | Sqft | Rent | $/sqft | DOM | Units | Dist |
|---|---|---|---|---|---|---|---|---|
| 4321 Ridgeway St Shreveport, LA | 2.0 | 1.0 | 890 | $800 | $0.90 | 43d | 1 | 1.44mi |
Listing history 19 events
-
2026-06-18days on market $27,000 Active 71 DOM
-
2026-06-17days on market $27,000 Active 70 DOM
-
2026-06-16days on market $27,000 Active 69 DOM
-
2026-06-15days on market $27,000 Active 68 DOM
-
2026-06-14days on market $27,000 Active 66 DOM
-
2026-06-13days on market $27,000 Active 65 DOM
-
2026-06-10days on market $27,000 Active 63 DOM
-
2026-06-09days on market $27,000 Active 62 DOM
-
2026-06-08days on market $27,000 Active 61 DOM
-
2026-06-07days on market $27,000 Active 60 DOM
-
2026-06-05days on market $27,000 Active 57 DOM
-
2026-06-03days on market $27,000 Active 56 DOM
-
2026-06-02days on market $27,000 Active 55 DOM
-
2026-06-01days on market $27,000 Active 54 DOM
-
2026-05-31days on market $27,000 Active 53 DOM
-
2026-05-30days on market $27,000 Active 52 DOM
-
2026-05-16price $27,000 515-char remark
Show marketing remark (515 chars)
DO NOT DISTURB TENANTS! This little gem is your opportunity to add a rental property to your portfolio with built-in, consistent cash flow. Current tenants pay $500 monthly on a month-to-month lease. This property has been maintained well and is more spacious than what meets the eye. 3 beds, 2 baths, plus a laundry room. Eat-in kitchen plus a dining room. Sale is as-is, where-is with no repairs. Approaching this property without listing agent permission is trespassing! LISTING AGENT HAS MORE PHOTOS ON REQUEST.
-
2026-04-08$30,000 Active 515-char remark
Show marketing remark (515 chars)
DO NOT DISTURB TENANTS! This little gem is your opportunity to add a rental property to your portfolio with built-in, consistent cash flow. Current tenants pay $500 monthly on a month-to-month lease. This property has been maintained well and is more spacious than what meets the eye. 3 beds, 2 baths, plus a laundry room. Eat-in kitchen plus a dining room. Sale is as-is, where-is with no repairs. Approaching this property without listing agent permission is trespassing! LISTING AGENT HAS MORE PHOTOS ON REQUEST.
-
2002-11-25soldstatus
ⓘ Source: listings_history table (triggers on properties + properties_extension) + one-shot
backfill from property_details.listing_events for pre-trigger history.
Tax reassessment forecast LA · Resets to sale price
- Current annual tax
- $326 · $27/mo
- Projected year-2 tax
- $326 · $27/mo
- Expected delta
- $0/yr ($0/mo · 0.0%)
ⓘ Screening estimate from a state-policy table — verify with the county assessor before closing.
Climate risk First Street
- Flood 1/10 Low FEMA zone X (unshaded) · 0% chance over 30 yrs
- Wildfire 2/10 Low
- Heat 7/10 Severe 7 d/yr ≥110°F today · 22 d/yr by 30 yrs out
- Wind 6/10 Major 63% chance of damaging wind over 30 yrs
- Air quality 2/10 Low 1 unhealthy d/yr today · 1 by 30 yrs out
Nearby sold comps map
Loading sold comps map…
Walkable amenities ~0.75 mi
Loading nearby amenities…
Taxation est. · year 1
- Rental income
- $16,108
- − Mortgage interest
- −$1,512
- − Property taxes
- −$326
- − Insurance
- −$135
- − Repairs & maintenance
- −$1,289
- − Management
- −$1,289
- − Depreciation
- −$785
- Taxable income
- $10,773
- Est. tax owed @ 24.0%
- −$2,585
- After-tax cash flow
- $7,981/yr
For passive investors: Depreciation is non-cash, so a rental often shows a tax loss while cash-flowing — sheltering income. Rental losses are passive: they offset passive income freely, and up to $25,000/yr can offset ordinary (W-2) income if you actively participate and your MAGI is under $100k (phasing out to $0 by $150k); unused losses carry forward. On sale, claimed depreciation is recaptured at up to 25%, and gains may owe capital-gains tax (a 1031 exchange can defer both). Figures are a year-1 estimate at your 24.0% rate — not tax advice; consult a CPA.
Schools (NCES district)
- District
- Caddo Parish
- NCES district ID
- 2200300
- Math proficiency
- 21% ▼ -33.00%
- Reading proficiency
- 32% ▼ -30.00%
- Median HH income
- $39,227
- Composite
- 22.23/100
- National rank
- #8148
- State rank
- #53 of 98 in LA
Livability — Shreveport
- Score
- 59/100
- State rank
- #270
- US rank
- #19730
Category grades
Schools grade is shown separately in the Schools card above.
Census & demographics
- Census place
- Shreveport, LA
- County
- Caddo Parish · 178,536 people
- City population
- 164,123
- Metro
- Shreveport-Bossier City, LA
- Population (ZIP)
- 31,734
- Household income
- $48,365
- Rent vs Own
- Severe rent burden
- 1346.0
Population outlook (Caddo County) Hauer SSP2
- Today (2025)
- 243,190 people
- By 2030
- 237,231 · -2.5%
- By 2040
- 222,502 · -8.5%
- By 2050
- 206,516 · -15.1%
- By 2075
- 165,706 · -31.9%
- By 2100
- 122,262 · -49.7%
Race, ethnicity, and origin ACS 2023
- Neighborhood character
- Diverse neighborhood (Simpson 0.55)
- Race & ethnicity
- Black 51% White 43% Two or more races 4% Hispanic / Latino 2%
- Common ancestry
- Slovak 3% Lithuanian 1%
- Foreign-born
- 1% · Canada
- Languages at home
- 98% English-only · Spanish 1%
Political lean MEDSL · Caddo
- 2024 margin
- Toss-up / Even · D 51.6% · R 47.0% · Other 1.4%
- 2008→2024 swing
- +1.6pp toward D · 2008: 3.0pp · 2024: 4.6pp
- All cycles
- 2024: D+4.6 2020: D+6.8 2016: D+4.2 2012: D+4.9 2008: D+3.0
Not yet ingested
- Civics
- —
Market trends
- HPI YoY
- ▼ -62.11%
- Current HPI
- 117.801
- Rent YoY
- —
- Metro
- Shreveport-Bossier City, LA
- State GDP YoY
- ▲ 3.29%
- F500 in state
- 10
Industry mix (Fortune 500 HQ in LA)
| Industry | F500 HQs | Revenue |
|---|---|---|
| Telecommunications | 2 | $23B |
|
||
| Utilities | 1 | $12B |
|
||
| Wholesale / Distribution | 1 | $5B |
|
||
| Advertising | 1 | $2B |
|
||
Price history
-10.0% since first listed3 events — show timeline
- 2026-05-16 Price Changed $27,000 NTREIS
- 2026-04-08 Listed $30,000 NTREIS
- 2002-11-25 Sold (Public Records) — Public Records
Property tax history
-1.7%/yrLatest (2025): $326 · +0.4% YoY. Source: county tax records.
Cash-flow waterfall
monthlySold comps — $/sqft
last 12 mo · ≤1 miLoading sold comps…