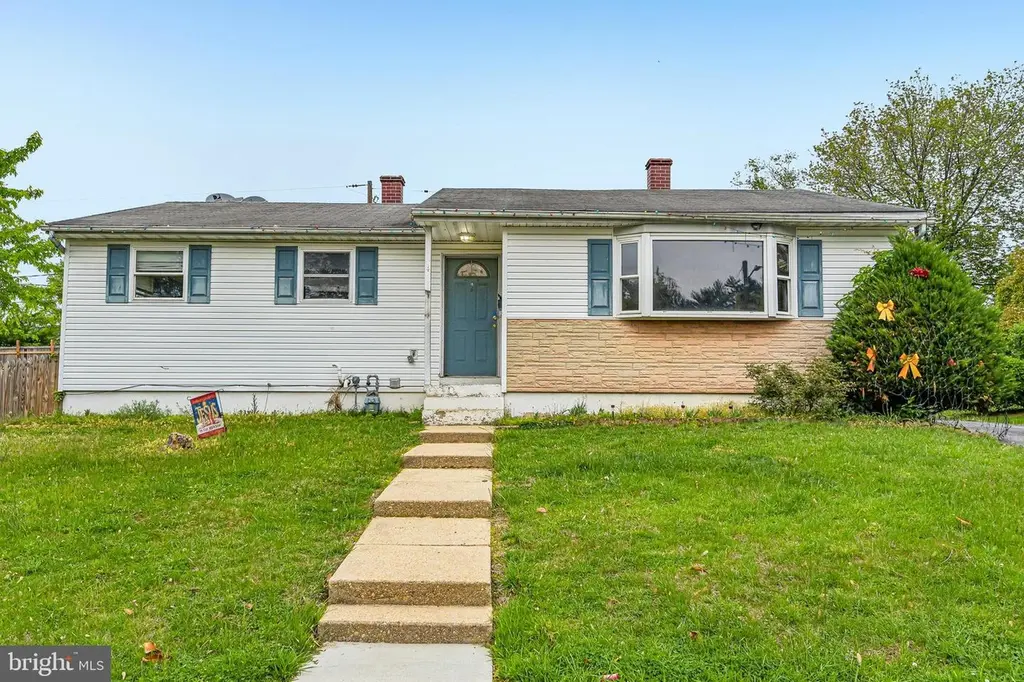
347 Marganza S · Maryland City, MD
Flood risk 1/10 · Minimal
- FEMA flood zone
- X (unshaded)
- Chance of flooding over 30 yrs
- 0.0%
- Est. flood insurance / yr
- $473 – $860
Fire risk 3/10 · Minor
- Est. fire insurance / yr
- $755 – $1,403
Heat risk 7/10 · Major
- Hot days now (above 104°F)
- 7 days/yr
- Hot days in 30 yrs
- 15 days/yr
Wind risk 4/10 · Minor
- Chance of severe wind over 30 yrs
- 17.0%
Air-quality risk 4/10 · Minor
- Unhealthy air days now
- 4 days/yr
- Unhealthy air days in 30 yrs
- 5 days/yr
Risk factors via First Street. Map © Google.
Why this score? — see what drove the C- grade
The composite is a weighted blend of 9 inputs, each scored 0–100. Each bar is that input's sub-score; the figure is the points it added to the 100-point composite (weight × sub-score).
- ARV discount +14.4/15.0
- Cash flow +14.0/30.0
- DSCR +4.3/10.0
- Rent growth +4.0/5.0
- Livability +3.8/5.0
- 1% rule +3.6/10.0
- Appreciation +3.5/10.0
- Schools +2.9/10.0
- Condition / age +2.5/5.0
$399,000
🖨 Deal sheet 📄 Offer letter ✓ Due diligence
Listing remarks
Spacious 5-bedroom, 3-bath home offering flexibility and strong potential in a convenient location. This property features a newer HVAC system and hot water heater, providing added comfort and efficiency. With generous living space and multiple bedrooms, the layout is well-suited for a variety of living arrangements, including guest space or home office needs. A great opportunity to personalize and make your own while building value. Conveniently located near shopping, dining, and commuter routes. Don’t miss this opportunity!
Key facts
- Hot water heater
- Newer hvac system
- 7,590 sq ft lot
Tags
Property features AI
Finance
- Other: Ownership: Fee simple; Pets allowed with no pet restrictions
Exterior
- Parking: Alley access; Driveway; On-street parking
- Utilities: Public water; Public sewer
- Home design: Detached property; Living area and additional finished lower level (finished below-grade area); Outside city limits
- Construction: Vinyl siding; Concrete perimeter foundation; Built year per assessor
- Exterior features: Enclosed patio(s)
Interior
- Kitchen: Dishwasher; Exhaust fan
- Bedrooms: Three bedrooms on main level; Two bedrooms on lower level
- Flooring: Carpet; Ceramic tile; Hardwood; Laminate
- Bathrooms: Three full bathrooms total (two full baths on main level; one full bath on lower level)
- Heating & cooling: Forced air heating; Heat pump(s); Programmable thermostat; Central air conditioning (electric); Natural gas heating and hot water
- Interior features: Attic; Breakfast area; Dining area; Traditional floor plan; Recessed lighting; Skylights; Walk-in closets; Drywall walls and ceilings
- Laundry & utility: Washer/dryer location not specified
Neighborhood map
What this means for you Summary
Snapshot
- This is a 5-bed/2.5-bath single-family listed at $399k.
Deal economics
- At list price, monthly cash flow is $53 ($632/yr) — positive.
- The deal already cash-flows at list — no discount required.
- To meet the 1% rule (rent ≥ 1% of price), the offer needs to be $342k (14.4% below list).
- Recommended offer: $342k (14.4% below list) — sets the bar for 1% rule.
- Cap rate 6.5% vs local median 3.4% in Maryland City — top-decile yield for the area; either an underpriced asset or a hidden risk that comps aren't pricing in. Stress-test before assuming the spread holds.
Location & tenants
- Location reads 75/100 on livability (#108 in MD, #4,306 nationally) — a middle-class / working-renter tenant base. Strengths: employment A+, housing A+, health & safety A+; Watch: crime C-, schools D-, commute F.
- Anne Arundel County Public Schools (suburban): math 20% / reading 37% proficiency, ranked #10 of 24 in MD (top 42%) — low school quality limits family demand, transient renter base, plan for 1-2y turnover.
- Market conditions: Rents rising fast (+5.8%/yr); 129 active listings in the ZIP; high-income renter base; 1,303 units permitted in Anne Arundel County in 2024 (299 in 5+ unit buildings).
- This rent runs 35% of the median local income ($118k/yr) — at the standard rent-burdened threshold; future hikes will face affordability resistance.
Forward outlook
- Local home prices are declining (-3.0%/yr); year-one equity from $3k of loan paydown is wiped out by about $12k of value loss. Plan a longer hold.
- Anne Arundel County population projected at +17% by 2050 — long-run rental-demand tailwind backs the buy-and-hold thesis.
Negotiation context
- Only 10 days on market — expect competitive offers; lowballing is unlikely to land.
- 4 sale attempts since 29y ago with the ask held roughly flat each time — persistent listings suggest the price (not the market) is what's stuck; bring a comps-based counter.
- Current owner paid $175k; list at $399k implies a 128% gain — meaningful room to come down on a strong offer.
Risks & watch-outs
- Climate carrying-cost: extreme-heat days projected 7→15/yr by 2055 (HVAC capex compounding) — expect insurance premiums to compound above CPI over the hold.
Questions for the listing agent
- Built in 1963 — when were the roof, HVAC, electrical panel, plumbing, and water heater last replaced?
- Is there a deadline driving the sale (1031 exchange, divorce, estate, relocation)? That informs how much negotiation room exists.
- Schools are D-rated, which usually means shorter tenancies and higher turnover. Who's the typical renter profile here, and what's been the actual vacancy rate?
- What's the average days-on-market for RENTAL listings here right now (not sales)? A rising rental-DOM trend means longer vacancies and softer asking-rent achievability than the comps imply.
- What's the recent tenant-quality profile in this submarket — average credit score on applications, eviction rate, late-payment / NSF rate, and stable-employment percentage? A property-management company in the area should have these aggregated.
- How much new for-sale + rental construction is in the pipeline within 1–3 miles? Heavy new supply typically softens prices + rents 12–24 months out; constrained supply supports both.
Investment metrics
- 1% rule
- 0.86% ✗
- Cap rate
- 6.45%
- Cash-on-cash
- 0.57%
- DSCR
- 1.03
- GRM
- 9.7
CMA / ARV
- ARV (median comp)
- $470,817
- List price
- $399,000
- Delta
- -15.25%
- Verdict
- UNDERPRICED
- Comps
- 20 within 1.0 mi
Show comp detail 12 sales within ~0.75 mi
| Address | Dist | Beds/Ba | Sqft | Sold | Price | $/sf | Match |
|---|---|---|---|---|---|---|---|
| 331 Old Line Ave | 0.07mi | 4/2.5 (-1) | 1,902 (+2%) | 7mo | $430,000 | $226 | 83 |
| 328 Vale Smt S | 0.24mi | 4/2.0 (-1) | 1,758 (-6%) | 1mo | $347,000 | $197 | 71 |
| 322 Old Line Ave | 0.13mi | 4/2.0 (-1) | 1,680 (-10%) | 2mo | $435,000 | $259 | 69 |
| 436 Old Line Ave | 0.56mi | 5/3.0 | 1,893 (+2%) | 4mo | $515,000 | $272 | 66 |
| 3362 Crumpton S | 0.52mi | 5/3.0 | 1,893 (+2%) | 9mo | $520,000 | $275 | 64 |
| 223 Old Line Ave | 0.53mi | 5/2.0 | 1,814 (-3%) | 7mo | $425,000 | $234 | 63 |
| 3369 Wye Mls S | 0.30mi | 5/2.0 | 2,013 (+8%) | 14mo | $418,000 | $208 | 59 |
| 3357 Old Line Ave | 0.55mi | 4/2.5 (-1) | 1,872 (+0%) | 12mo | $476,000 | $254 | 58 |
| 3339 Crumpton S | 0.61mi | 4/2.0 (-1) | 1,814 (-3%) | 3mo | $405,000 | $223 | 58 |
| 341 Dameron S | 0.53mi | 6/3.0 (+1) | 1,992 (+7%) | 2mo | $475,900 | $239 | 55 |
| 3341 Valley Lee S | 0.49mi | 4/2.0 (-1) | 2,016 (+8%) | 3mo | $430,000 | $213 | 54 |
| 258 Marganza South | 0.38mi | 6/3.0 (+1) | 1,994 (+7%) | 14mo | $475,000 | $238 | 51 |
Match score weights: distance 35% · size 25% · config 20% · recency 20%. Top-matched comps best support the ARV.
Projected returns pro-forma
-3.0% appreciation · 5.84% rent growth · sell at horizon
- IRR
- -12.4%
- Equity multiple
- 0.54×
- Total profit
- $-51,281
- Equity at exit
- $59,492
- IRR
- 0.4%
- Equity multiple
- 1.03×
- Total profit
- $3,254
- Equity at exit
- $34,498
Cash invested: $111,720 (down + closing). Projections, not guarantees.
Landlord ↔ Tenant lean methodology
- Overall (STATE)
- 27 Tenant-Leaning
- State Maryland
- 27 Tenant-Leaning · D+14
- County
- — inherits STATE
- City
- — inherits STATE
ZIP-level market 20724
- Home prices YoY
- -1.1%
- Rents YoY
- 5.8%
- Active inventory
- 129
- Price-to-rent
- 9.7×
Monthly cashflow live
- Estimated rent
- $3,415 medium interval (Pro) →
- Mortgage (P&I)
- −$2,092
- Tax from tax record
- −$387 /mo · $4,643/yr
- Insurance
- −$166
- HOA
- −$0
- Vacancy / Maint / Mgmt
- −$717
- Net cashflow
- $53
Break-even live
UW: 25.0% down · 7.5% · 30yr · 1.5% tax · 5.0% vac · 8.0% maint · 8.0% mgmt
Financing live
Cash to close
- Down payment
- $99,750
- Closing costs
- $11,970
- Reserves months
- —
- Total cash needed
- —
Loan-product check · same deal, 3 products live
Conventional
25% down · 7.5% · 30yr
- Down + closing
- —
- Monthly P&I
- —
- Monthly cashflow
- —
- DSCR
- —
- Eligible?
- —
Personal DTI + credit; lowest rate.
DSCR
20% down · 8.5% · 30yr
- Down + closing
- —
- Monthly P&I
- —
- Monthly cashflow
- —
- DSCR
- —
- Eligible?
- —
No personal income docs; deal must DSCR.
Hard money
10% down · 12.0% · 12mo
- Down + closing
- —
- Monthly P&I
- —
- Monthly cashflow
- —
- DSCR
- —
- Eligible?
- —
Short-term bridge; refi at stabilization.
Listing history 12 events
-
2026-05-10status Pending 537-char remark
-
2026-04-30$399,000 Active 537-char remark
-
2007-08-05historical
-
2007-08-05
-
2001-08-23soldstatus $175,000
-
2001-08-02soldstatus $175,000
-
2001-07-10historical
-
2001-07-06$172,900
-
1997-09-05soldstatus $136,500
-
1997-08-29soldstatus $136,500
-
1997-07-06historical
-
1997-06-09$139,900
ⓘ Source: listings_history table (triggers on properties + properties_extension) + one-shot
backfill from property_details.listing_events for pre-trigger history.
Tax reassessment forecast MD · Partial reset (capped growth)
- Current annual tax
- $4,643 · $387/mo
- Projected year-2 tax
- $4,643 · $387/mo
- Expected delta
- $0/yr ($0/mo · 0.0%)
ⓘ Screening estimate from a state-policy table — verify with the county assessor before closing.
Climate risk First Street
- Flood 1/10 Low FEMA zone X (unshaded) · 0% chance over 30 yrs
- Wildfire 3/10 Moderate
- Heat 7/10 Severe 7 d/yr ≥104°F today · 15 d/yr by 30 yrs out
- Wind 4/10 Moderate 17% chance of damaging wind over 30 yrs
- Air quality 4/10 Moderate 4 unhealthy d/yr today · 5 by 30 yrs out
Nearby sold comps map
Loading sold comps map…
Walkable amenities ~0.75 mi
Loading nearby amenities…
Taxation est. · year 1
- Rental income
- $40,986
- − Mortgage interest
- −$22,350
- − Property taxes
- −$4,643
- − Insurance
- −$1,995
- − Repairs & maintenance
- −$3,279
- − Management
- −$3,279
- − Depreciation
- −$11,607
- Taxable loss
- −$6,167
- Est. tax savings @ 24.0%
- +$1,480
- After-tax cash flow
- $2,112/yr
For passive investors: Depreciation is non-cash, so a rental often shows a tax loss while cash-flowing — sheltering income. Rental losses are passive: they offset passive income freely, and up to $25,000/yr can offset ordinary (W-2) income if you actively participate and your MAGI is under $100k (phasing out to $0 by $150k); unused losses carry forward. On sale, claimed depreciation is recaptured at up to 25%, and gains may owe capital-gains tax (a 1031 exchange can defer both). Figures are a year-1 estimate at your 24.0% rate — not tax advice; consult a CPA.
Schools (NCES district)
- District
- Anne Arundel County Public Schools
- NCES district ID
- 2400060
- Math proficiency
- 20% ▼ -21.00%
- Reading proficiency
- 37% ▼ -13.00%
- Median HH income
- $87,880
- Composite
- 28.52/100
- National rank
- #6733
- State rank
- #10 of 24 in MD
Livability — Maryland City
- Score
- 75/100
- State rank
- #108
- US rank
- #4306
Category grades
Schools grade is shown separately in the Schools card above.
Census & demographics
- Census place
- Maryland City, MD
- County
- Anne Arundel County · 535,653 people
- Metro
- Baltimore-Columbia-Towson, MD
- Population (ZIP)
- 19,369
- Household income
- $118,115
- Rent vs Own
- Severe rent burden
- 614.0
Population outlook (Anne Arundel County) Hauer SSP2
- Today (2025)
- 617,384 people
- By 2030
- 642,094 · +4.0%
- By 2040
- 686,621 · +11.2%
- By 2050
- 723,031 · +17.1%
- By 2075
- 809,346 · +31.1%
- By 2100
- 837,658 · +35.7%
Race, ethnicity, and origin ACS 2023
- Neighborhood character
- Diverse neighborhood (Simpson 0.69)
- Race & ethnicity
- Black 43% Hispanic / Latino 24% White 24% Native American 8% Asian 7% Two or more races 6%
- Hispanic origin (detail)
- Mexican 3% Puerto Rican 3%
- Common ancestry
- Romanian 2% Italian 1% Lithuanian 1%
- Foreign-born
- 24% · Canada, Jamaica, Philippines
- Languages at home
- 69% English-only · Spanish 20% Other Indo-European 2% Chinese 1%
Political lean MEDSL · Anne Arundel
- 2024 margin
- D (+13.9) · D 55.7% · R 41.7% · Other 2.6%
- 2008→2024 swing
- +15.7pp toward D · 2008: -1.8pp · 2024: 13.9pp
- All cycles
- 2024: D+13.9 2020: D+14.5 2016: D+0.7 2012: R+0.9 2008: R+1.8
Not yet ingested
- Civics
- —
Market trends
- HPI YoY
- ▼ -3.04%
- Current HPI
- 269.7445
- Rent YoY
- ▲ 5.84%
- Metro
- Baltimore-Columbia-Towson, MD
- State GDP YoY
- ▲ 2.97%
- F500 in state
- 12
Industry mix (Fortune 500 HQ in MD)
| Industry | F500 HQs | Revenue |
|---|---|---|
| Aerospace / Defense | 1 | $71B |
|
||
| Utilities | 1 | $25B |
|
||
| Hotels | 1 | $24B |
|
||
| Consumer Goods | 1 | $7B |
|
||
| Real Estate | 1 | $6B |
|
||
| Chemicals | 1 | $2B |
|
||
Price history
+185.2% since first listed12 events — show timeline
- 2026-05-10 Pending — BRIGHT MLS
- 2026-04-30 Listed $399,000 BRIGHT MLS
- 2007-08-05 Delisted — MRIS
- 2007-08-05 Listed — MRIS
- 2001-08-23 Sold (Public Records) $175,000 Public Records
- 2001-08-02 Sold (MLS) $175,000 MRIS
- 2001-07-10 Delisted — MRIS
- 2001-07-06 Listed $172,900 MRIS
- 1997-09-05 Sold (Public Records) $136,500 Public Records
- 1997-08-29 Sold (MLS) $136,500 MRIS
- 1997-07-06 Delisted — MRIS
- 1997-06-09 Listed $139,900 MRIS
Property tax history
+3.2%/yrLatest (2025): $4,643 · +5.1% YoY. Source: county tax records.
Cash-flow waterfall
monthlySold comps — $/sqft
last 12 mo · ≤1 miLoading sold comps…