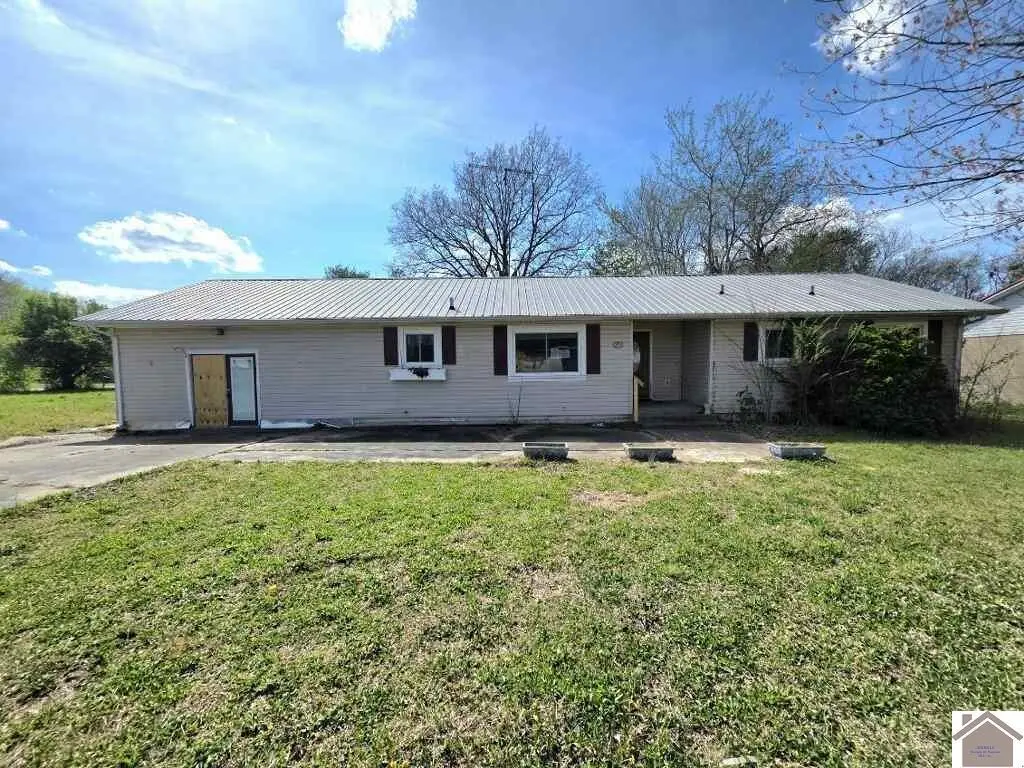
300 4th St · Hazel, KY
Flood risk 1/10 · Minimal
- FEMA flood zone
- X (unshaded)
- Chance of flooding over 30 yrs
- 0.0%
- Est. flood insurance / yr
- $507 – $1,088
Fire risk 3/10 · Minor
- Est. fire insurance / yr
- $839 – $1,559
Heat risk 6/10 · Moderate
- Hot days now (above 108°F)
- 7 days/yr
- Hot days in 30 yrs
- 21 days/yr
Wind risk 4/10 · Minor
- Chance of severe wind over 30 yrs
- 10.0%
Air-quality risk 1/10 · Minimal
- Unhealthy air days now
- 0 days/yr
- Unhealthy air days in 30 yrs
- 0 days/yr
Risk factors via First Street. Map © Google.
Why this score? — see what drove the B+ grade
The composite is a weighted blend of 9 inputs, each scored 0–100. Each bar is that input's sub-score; the figure is the points it added to the 100-point composite (weight × sub-score).
- Cash flow +26.2/30.0
- ARV discount +15.0/15.0
- DSCR +8.8/10.0
- Appreciation +7.2/10.0
- 1% rule +6.3/10.0
- Schools +3.8/10.0
- Livability +3.0/5.0
- Rent growth +2.5/5.0
- Condition / age +2.5/5.0
$94,900
🖨 Deal sheet 📄 Offer letter ✓ Due diligence
Listing remarks MLS
Completely remodeled home. High end gallery series appliances, fresh paint, updated flooring, spacious rooms, above ground heated pool with huge wrap around deck! Corner lot with beautiful yard and 2 outbuildings for wonderful storage! Floor plans on the virtual tour.
Key facts
- 0.36 acre lot
- Listed 78 days
Property features AI
Exterior
- Home design: Single family residence; Residential property
- Exterior features: Level lot; Corner lot; Private maintained road
Interior
- Bathrooms: 1 full bathroom; 1 half bathroom
- Interior features: Corner lot setting
Neighborhood map
What this means for you Summary
Snapshot
- This is a 2-bed/2.0-bath single-family listed at $95k.
Deal economics
- At list price, monthly cash flow is $241 ($3k/yr) — positive.
- The deal already cash-flows at list — no discount required.
- Meets the 1% rule at list price ($1k rent vs $95k).
- Recommended offer: $89k (6.0% below list) — sets the bar for market timing.
Location & tenants
- Location reads 59/100 on livability (#422 in KY) — a working-class tenant base; expect higher turnover. Strengths: cost of living A+, housing A+; Watch: schools F, amenities F, commute F.
- Calloway County (town): math 44% / reading 48% proficiency, ranked #19 of 165 in KY (top 12%) — families likely to look elsewhere, expect single-tenant / working-renter base with shorter leases.
- Market conditions: 11 active listings in the ZIP; 81 units permitted in Calloway County in 2024 (66 in 5+ unit buildings).
Forward outlook
- In year one you build about $5k of equity ($656 loan paydown + $4k appreciation (4.4% local appreciation)).
- Calloway County population projected at +18% by 2050 — long-run rental-demand tailwind backs the buy-and-hold thesis.
- At projected returns (4.4% appreciation + 3.0% rent growth), your $27k cash investment doubles in ~4 years — after that, you're playing with house money.
- By year 7, paydown + projected appreciation supports a ~$31k cash-out refi (75% LTV) — recoverable capital for the next deal without selling this one.
Negotiation context
- It's been on market 79 days — a 6% lower offer ($89k) is reasonable based on typical stale-listing flexibility.
- 2 sale attempts since 12y ago; this cycle's ask has dropped $30k (24%) from the opening price — seller is motivated, your offer sets the floor, not the list.
Risks & watch-outs
- Climate carrying-cost: extreme-heat days projected 7→21/yr by 2055 (HVAC capex compounding) — expect insurance premiums to compound above CPI over the hold.
Questions for the listing agent
- It's been on market 79 days. Have you received any prior offers? Is the seller open to a 6% concession, seller financing, or rate buy-down credit?
- Built in 1971 — when were the roof, HVAC, electrical panel, plumbing, and water heater last replaced?
- Why hasn't it sold? Are there any deal-killer items the seller is aware of (foundation, flood, title, zoning, code violations)?
- Is there a deadline driving the sale (1031 exchange, divorce, estate, relocation)? That informs how much negotiation room exists.
- Schools are F-rated, which usually means shorter tenancies and higher turnover. Who's the typical renter profile here, and what's been the actual vacancy rate?
- What's the average days-on-market for RENTAL listings here right now (not sales)? A rising rental-DOM trend means longer vacancies and softer asking-rent achievability than the comps imply.
- What's the recent tenant-quality profile in this submarket — average credit score on applications, eviction rate, late-payment / NSF rate, and stable-employment percentage? A property-management company in the area should have these aggregated.
- How much new for-sale + rental construction is in the pipeline within 1–3 miles? Heavy new supply typically softens prices + rents 12–24 months out; constrained supply supports both.
Investment metrics
- 1% rule
- 1.13% ✓
- Cap rate
- 9.34%
- Cash-on-cash
- 10.88%
- DSCR
- 1.48
- GRM
- 7.4
CMA / ARV
- ARV (on-the-fly)
- $121,830
- Comps found
- 4
Show comp detail 4 sales within ~0.75 mi
| Address | Dist | Beds/Ba | Sqft | Sold | Price | $/sf | Match |
|---|---|---|---|---|---|---|---|
| 600 3rd St | 0.25mi | 3/2.0 (+1) | 1,239 (-5%) | 3mo | $115,000 | $93 | 72 |
| 310 Calloway St | 0.20mi | 2/1.0 | 1,454 (+11%) | 8mo | $75,000 | $52 | 62 |
| 812 3rd St | 0.58mi | 2/1.0 | 1,289 (-2%) | 10mo | $105,000 | $81 | 58 |
| 624 Main St | 0.32mi | 3/1.0 (+1) | 1,457 (+11%) | 13mo | $145,000 | $100 | 46 |
Match score weights: distance 35% · size 25% · config 20% · recency 20%. Top-matched comps best support the ARV.
Projected returns pro-forma
4.4% appreciation · 3.0% rent growth · sell at horizon
- IRR
- 20.9%
- Equity multiple
- 2.28×
- Total profit
- $33,983
- Equity at exit
- $50,350
- IRR
- 20.9%
- Equity multiple
- 4.43×
- Total profit
- $91,086
- Equity at exit
- $84,186
Cash invested: $26,572 (down + closing). Projections, not guarantees.
Landlord ↔ Tenant lean methodology
- Overall (STATE)
- 83 Strongly Landlord-Friendly
- State Kentucky
- 83 Strongly Landlord-Friendly · R+16
- County
- — inherits STATE
- City
- — inherits STATE
ZIP-level market 42049
- Home prices YoY
- 1.6%
- Active inventory
- 11
- Price-to-rent
- 7.4×
Monthly cashflow live
- Estimated rent
- $1,072 medium interval (Pro) →
- Mortgage (P&I)
- −$498
- Tax from tax record
- −$69 /mo · $823/yr
- Insurance
- −$40
- HOA
- −$0
- Vacancy / Maint / Mgmt
- −$225
- Net cashflow
- $241
Break-even live
UW: 25.0% down · 7.5% · 30yr · 1.5% tax · 5.0% vac · 8.0% maint · 8.0% mgmt
Financing live
Cash to close
- Down payment
- $23,725
- Closing costs
- $2,847
- Reserves months
- —
- Total cash needed
- —
Loan-product check · same deal, 3 products live
Conventional
25% down · 7.5% · 30yr
- Down + closing
- —
- Monthly P&I
- —
- Monthly cashflow
- —
- DSCR
- —
- Eligible?
- —
Personal DTI + credit; lowest rate.
DSCR
20% down · 8.5% · 30yr
- Down + closing
- —
- Monthly P&I
- —
- Monthly cashflow
- —
- DSCR
- —
- Eligible?
- —
No personal income docs; deal must DSCR.
Hard money
10% down · 12.0% · 12mo
- Down + closing
- —
- Monthly P&I
- —
- Monthly cashflow
- —
- DSCR
- —
- Eligible?
- —
Short-term bridge; refi at stabilization.
Listing history 20 events
-
2026-06-19days on market $94,900 Active 79 DOM
-
2026-06-18days on market $94,900 Active 78 DOM
-
2026-06-17days on market $94,900 Active 77 DOM
-
2026-06-16days on market $94,900 Active 76 DOM
-
2026-06-15days on market $94,900 Active 75 DOM
-
2026-06-14days on market $94,900 Active 73 DOM
-
2026-06-12remarks 543-char remark
-
2026-06-12days on market $94,900 Active 72 DOM
-
2026-06-09days on market $94,900 Active 69 DOM
-
2026-06-08days on market $94,900 Active 68 DOM
-
2026-06-07pricedays on market $94,900 Active 67 DOM
-
2026-06-02days on market $114,900 Active 62 DOM
-
2026-06-01days on market $114,900 Active 61 DOM
-
2026-05-31days on market $114,900 Active 60 DOM
-
2026-05-30days on market $114,900 Active 59 DOM
-
2026-04-28price $114,900
-
2026-03-31$124,900 Active
-
2015-06-05soldstatus $89,900 268-char remark
Show marketing remark (268 chars)
Completely remodeled home. High end gallery series appliances, fresh paint, updated flooring, spacious rooms, above ground heated pool with huge wrap around deck! Corner lot with beautiful yard and 2 outbuildings for wonderful storage! Floor plans on the virtual tour.
-
2014-09-01$94,900 268-char remark
Show marketing remark (268 chars)
Completely remodeled home. High end gallery series appliances, fresh paint, updated flooring, spacious rooms, above ground heated pool with huge wrap around deck! Corner lot with beautiful yard and 2 outbuildings for wonderful storage! Floor plans on the virtual tour.
-
1995-07-01soldstatus $37,500
ⓘ Source: listings_history table (triggers on properties + properties_extension) + one-shot
backfill from property_details.listing_events for pre-trigger history.
Tax reassessment forecast KY · Resets to sale price
- Current annual tax
- $823 · $69/mo
- Projected year-2 tax
- $823 · $69/mo
- Expected delta
- $0/yr ($0/mo · -0.0%)
ⓘ Screening estimate from a state-policy table — verify with the county assessor before closing.
Climate risk First Street
- Flood 1/10 Low FEMA zone X (unshaded) · 0% chance over 30 yrs
- Wildfire 3/10 Moderate
- Heat 6/10 Major 7 d/yr ≥108°F today · 21 d/yr by 30 yrs out
- Wind 4/10 Moderate 10% chance of damaging wind over 30 yrs
- Air quality 1/10 Low 0 unhealthy d/yr today · 0 by 30 yrs out
Nearby sold comps map
Loading sold comps map…
Walkable amenities ~0.75 mi
Loading nearby amenities…
Taxation est. · year 1
- Rental income
- $12,862
- − Mortgage interest
- −$5,316
- − Property taxes
- −$823
- − Insurance
- −$474
- − Repairs & maintenance
- −$1,029
- − Management
- −$1,029
- − Depreciation
- −$2,761
- Taxable income
- $1,430
- Est. tax owed @ 24.0%
- −$343
- After-tax cash flow
- $2,548/yr
For passive investors: Depreciation is non-cash, so a rental often shows a tax loss while cash-flowing — sheltering income. Rental losses are passive: they offset passive income freely, and up to $25,000/yr can offset ordinary (W-2) income if you actively participate and your MAGI is under $100k (phasing out to $0 by $150k); unused losses carry forward. On sale, claimed depreciation is recaptured at up to 25%, and gains may owe capital-gains tax (a 1031 exchange can defer both). Figures are a year-1 estimate at your 24.0% rate — not tax advice; consult a CPA.
Schools (NCES district)
- District
- Calloway County
- NCES district ID
- 2100870
- Math proficiency
- 44% ▼ -12.00%
- Reading proficiency
- 48% ▼ -13.00%
- Median HH income
- $38,849
- Composite
- 38.39/100
- National rank
- #4208
- State rank
- #19 of 165 in KY
Livability — Hazel
- Score
- 59/100
- State rank
- #422
- US rank
- #20326
Category grades
Schools grade is shown separately in the Schools card above.
Census & demographics
- Census place
- Hazel, KY
- Population (ZIP)
- 1,386
Population outlook (Calloway County) Hauer SSP2
- Today (2025)
- 41,071 people
- By 2030
- 42,608 · +3.7%
- By 2040
- 45,435 · +10.6%
- By 2050
- 48,501 · +18.1%
- By 2075
- 56,481 · +37.5%
- By 2100
- 63,271 · +54.1%
Race, ethnicity, and origin ACS 2023
- Neighborhood character
- Predominantly White (83%)
- Race & ethnicity
- White 83% Two or more races 12% Black 4% Hispanic / Latino 1% Asian 1%
- Common ancestry
- Italian 9% Slovak 8% Romanian 3%
- Foreign-born
- 2% · China, Canada
- Languages at home
- 97% English-only · Spanish 2% Russian/Polish/Slavic 1%
Political lean MEDSL · Calloway
- 2024 margin
- Solid R (+38.0) · D 30.2% · R 68.1% · Other 1.7%
- 2008→2024 swing
- -19.6pp toward R · 2008: -18.4pp · 2024: -38.0pp
- All cycles
- 2024: R+38.0 2020: R+31.8 2016: R+35.0 2012: R+27.4 2008: R+18.4
Not yet ingested
- Civics
- —
Market trends
- HPI YoY
- ▲ 4.40%
- Current HPI
- 272.1254
- Rent YoY
- —
- Metro
- —
- State GDP YoY
- ▲ 1.81%
- F500 in state
- 4
Industry mix (Fortune 500 HQ in KY)
| Industry | F500 HQs | Revenue |
|---|---|---|
| Healthcare | 1 | $118B |
|
||
| Food / Beverage | 1 | $7B |
|
||
Price history
+206.4% since first listed5 events — show timeline
- 2026-04-28 Price Changed $114,900 WKRMLS
- 2026-03-31 Listed $124,900 WKRMLS
- 2015-06-05 Sold (MLS) $89,900 WKRMLS
- 2014-09-01 Listed $94,900 WKRMLS
- 1995-07-01 Sold (Public Records) $37,500 Public Records
Property tax history
+3.2%/yrLatest (2025): $823 · +1.2% YoY. Source: county tax records.
Cash-flow waterfall
monthlySold comps — $/sqft
last 12 mo · ≤1 miLoading sold comps…