 Triplex
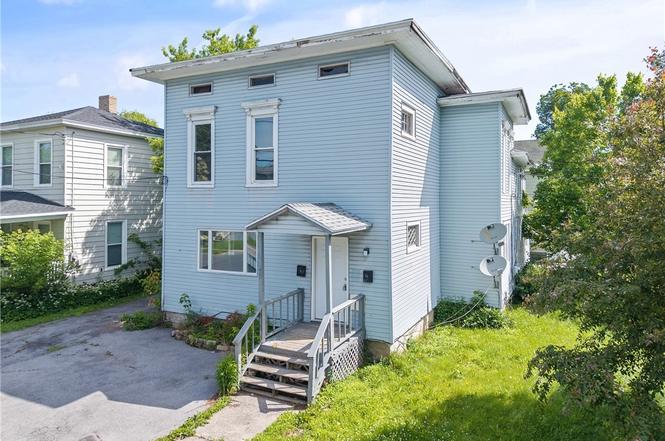
723 Franklin St · Watertown, NY
Flood risk 1/10 · Minimal
- FEMA flood zone
- X
- Chance of flooding over 30 yrs
- 0.0%
- Est. flood insurance / yr
- $473 – $860
Fire risk 1/10 · Minimal
- Est. fire insurance / yr
- $691 – $1,283
Heat risk 2/10 · Minimal
- Hot days now (above 91°F)
- 7 days/yr
- Hot days in 30 yrs
- 15 days/yr
Wind risk 1/10 · Minimal
- Chance of severe wind over 30 yrs
- 0.0%
Air-quality risk 2/10 · Minimal
- Unhealthy air days now
- 1 days/yr
- Unhealthy air days in 30 yrs
- 1 days/yr
Risk factors via First Street. Map © Google.
Why this score? — see what drove the B grade
The composite is a weighted blend of 9 inputs, each scored 0–100. Each bar is that input's sub-score; the figure is the points it added to the 100-point composite (weight × sub-score).
- Cash flow +30.0/30.0
- 1% rule +10.0/10.0
- DSCR +10.0/10.0
- ARV discount +5.9/15.0
- Rent growth +5.0/5.0
- Schools +3.7/10.0
- Livability +3.4/5.0
- Condition / age +2.5/5.0
- Appreciation +0.0/10.0
$174,900
🖨 Deal sheet (PDF) 📄 Offer letter ✓ Due diligence
Multi-family units
County records classify this as Multi-Family (2-4 Unit). Listing-text estimate: 3 units. confirmed
Listing remarks MLS
Three unit investment that generates a good income with separate utilities. Live in one while the others pay your mortgage along with extra income coming in. Two apts are rented and one is vacant. Needs some TLC located on a corner lot. Call for more info.
Key facts
- Separate utilities
- Modern kitchens
- Renovated bathrooms
Tags
Property features AI
Finance
- Other: Three separate electric meters; Three separate gas meters; Three total units (all in community)
- Financial info: Operating expense details: see remarks; Owner pays: other/see remarks; Rent includes: see remarks
Exterior
- Parking: Two or more parking spaces
- Utilities: Public water connected; Sewer connected
- Home design: Two-story building; Resale property; Vinyl siding exterior
- Construction: Vinyl siding construction
- Exterior features: Rectangular residential lot; City street frontage; Lot dimensions approximately 63 x 84
Interior
- Kitchen: No specific kitchen appliance details provided
- Bedrooms: Multi-unit property with 3 total units
- Flooring: Carpet; Vinyl; Varies
- Bathrooms: Three full bathrooms (across units)
- Heating & cooling: Gas forced-air heating
- Interior features: Full basement
- Laundry & utility: Gas water heater
Neighborhood map
What this means for you Summary
Snapshot
- This is a 3 × 3-bed/1.5-bath units multifamily listed at $175k.
Deal economics
- At list price, monthly cash flow is $2k ($26k/yr) — positive. Per door: $716/mo.
- The deal already cash-flows at list — no discount required.
- Meets the 1% rule at list price ($4k rent vs $175k).
- Cap rate 21.0% vs local median 6.3% in Watertown — top-decile yield for the area; either an underpriced asset or a hidden risk that comps aren't pricing in. Stress-test before assuming the spread holds.
Location & tenants
- Location reads 68/100 on livability (#540 in NY) — a middle-class / working-renter tenant base. Strengths: health & safety A+, cost of living A-, housing A-; Watch: amenities C-, crime F, commute F.
- Watertown City School District (urban): math 34% / reading 54% proficiency, ranked #481 of 590 in NY (top 82%) — families likely to look elsewhere, expect single-tenant / working-renter base with shorter leases.
- Zoned schools: Knickerbocker School (math 32% / reading 47%, grade F, #1,444 of 2,108 statewide, top 71%, 364 students, 71% FRL); Case Middle School (math 17% / reading 41%, grade F, #566 of 729 statewide, top 78%, 626 students, 70% FRL); Watertown Senior High School (math 89% / reading 92%, grade A+, #231 of 1,100 statewide, top 21%, 1,083 students, 65% FRL) — zoned schools average 69% FRL vs 49% district-wide (20 pts higher); higher-poverty schools than district average — tighter screening recommended.
- Market conditions: Rents rising fast (+10.0%/yr); 224 active listings in the ZIP; 8 comparable units currently listed for rent nearby; rentals lingering (median 45d on market — plan ~5-8 weeks vacancy on turnover, expect pricing pressure); 100% of comp listings sitting > 30 days — soft ceiling on asking rent; 196 units permitted in Jefferson County in 2024 (0 in 5+ unit buildings).
- At $4,189/mo this rent would consume 86% of the median local household income ($59k/yr) (locally 1634% of renters already pay >50% of income on rent) — very limited rent-growth headroom before tenants either downsize or default.
Forward outlook
- Local home prices are declining (-3.0%/yr); year-one equity from $1k of loan paydown is wiped out by about $5k of value loss. Plan a longer hold.
- Jefferson County population projected at -12% by 2050 — secular population decline; favor cash flow + early exit over multi-decade hold.
- At projected returns (-3.0% appreciation + 8.0% rent growth), your $49k cash investment doubles in ~3 years — after that, you're playing with house money.
Negotiation context
- Only 3 days on market — expect competitive offers; lowballing is unlikely to land.
- 8 sale attempts since 19y ago with the ask held roughly flat each time — persistent listings suggest the price (not the market) is what's stuck; bring a comps-based counter.
- Current owner paid $76k; list at $175k implies a 130% gain — meaningful room to come down on a strong offer.
Risks & watch-outs
- Watch-outs: built in 1870 — expect roof / HVAC / electrical / plumbing capex.
Questions for the listing agent
- Can we see the unit-by-unit rent roll, current vacancy, and any below-market leases? What's the average tenancy length?
- What capital expenditures (roof, boiler, parking lot, exteriors) have been made in the last 5 years, and what's planned in the next 2?
- Built in 1870 — when were the roof, HVAC, electrical panel, plumbing, and water heater last replaced?
- Is there a deadline driving the sale (1031 exchange, divorce, estate, relocation)? That informs how much negotiation room exists.
- Schools are D-rated, which usually means shorter tenancies and higher turnover. Who's the typical renter profile here, and what's been the actual vacancy rate?
- Crime grade is F in this area — have there been break-ins, vandalism, or insurance claims at this property in the last 3 years? What carrier currently insures it and at what premium?
- What's the average days-on-market for RENTAL listings here right now (not sales)? A rising rental-DOM trend means longer vacancies and softer asking-rent achievability than the comps imply.
- What's the recent tenant-quality profile in this submarket — average credit score on applications, eviction rate, late-payment / NSF rate, and stable-employment percentage? A property-management company in the area should have these aggregated.
- How much new apartment / multifamily construction is in the pipeline within 1–3 miles? Heavy new supply (>2% of stock underway) typically softens rents 12–24 months out; light construction supports rent growth.
Investment metrics
- 1% rule
- 2.40% ✓
- Cap rate
- 21.03%
- Cash-on-cash
- 52.62%
- DSCR
- 3.34
- GRM
- 3.5
CMA / ARV
- ARV (on-the-fly)
- $168,838
- Comps found
- 10
Show comp detail 10 sales within ~0.75 mi
| Address | Dist | Beds/Ba | Sqft | Sold | Price | $/sf | Match |
|---|---|---|---|---|---|---|---|
| 301 Keyes Ave | 0.34mi | 4/2.0 | 2,450 (+3%) | 8mo | $30,000 | $12 | 68 |
| 512 Hamlin St | 0.25mi | 5/2.5 (+1) | 2,220 (-7%) | 3mo | $236,000 | $106 | 67 |
| 112 S Pleasant St | 0.39mi | 4/2.0 | 2,182 (-8%) | 10mo | $152,000 | $70 | 56 |
| 133 Central St | 0.41mi | 4/2.0 | 2,353 (-1%) | 23mo | $177,000 | $75 | 56 |
| 502 Academy St | 0.22mi | 4/2.5 | 2,112 (-11%) | 16mo | $180,000 | $85 | 56 |
| 359 Franklin St #2 | 0.32mi | 5/3.0 (+1) | 2,644 (+11%) | 7mo | $70,000 | $26 | 56 |
| 114 High St | 0.36mi | 5/3.0 (+1) | 2,500 (+5%) | 18mo | $178,500 | $71 | 54 |
| 712 Cadwell St | 0.10mi | 5/2.0 (+1) | 2,108 (-11%) | 22mo | $82,500 | $39 | 49 |
| 116 S Hamilton St | 0.33mi | 5/2.0 (+1) | 2,520 (+6%) | 21mo | $190,000 | $75 | 48 |
| 159 Winslow St | 0.41mi | 4/3.0 | 2,073 (-13%) | 21mo | $98,000 | $47 | 42 |
Match score weights: distance 35% · size 25% · config 20% · recency 20%. Top-matched comps best support the ARV.
Projected returns pro-forma
-3.0% appreciation · 8.0% rent growth · sell at horizon
- IRR
- 56.1%
- Equity multiple
- 3.67×
- Total profit
- $130,598
- Equity at exit
- $26,078
- IRR
- 63.0%
- Equity multiple
- 8.98×
- Total profit
- $390,731
- Equity at exit
- $15,122
Cash invested: $48,972 (down + closing). Projections, not guarantees.
Landlord ↔ Tenant lean methodology
- Overall (STATE)
- 15 Strongly Tenant-Friendly
- State New York
- 15 Strongly Tenant-Friendly · D+10
- County
- — inherits STATE
- City
- — inherits STATE
ZIP-level market 13601
- Home prices YoY
- -5.6%
- Rents YoY
- 10.0%
- Active inventory
- 224
- Price-to-rent
- 10.4×
Monthly cashflow live
- Estimated rent
- $4,189 high interval (Pro) →
- Mortgage (P&I)
- −$917
- Tax from tax record
- −$172 /mo · $2,062/yr
- Insurance
- −$73
- HOA
- −$0
- Vacancy / Maint / Mgmt
- −$880
- Net cashflow
- $2,147
Break-even live
Sensitivity live
| Price | -10% $2,246 | -5% $2,197 | +0% $2,147 | +5% $2,098 | +10% $2,048 |
|---|---|---|---|---|---|
| Rent | -10% $1,816 | -5% $1,982 | +0% $2,147 | +5% $2,313 | +10% $2,478 |
| Rate | -1.0pp $2,235 | -0.5pp $2,192 | base $2,147 | +0.5pp $2,102 | +1.0pp $2,056 |
3-unit breakdown (identical units grouped — click to expand)
| Units | Beds | Baths | Est. rent |
|---|---|---|---|
| 3× units | 3 | 1.5 | $4,188 |
| #1 | 3 | 1.5 | $1,396 |
| #2 | 3 | 1.5 | $1,396 |
| #3 | 3 | 1.5 | $1,396 |
| Total (3 units) | $4,189 | ||
UW: 25.0% down · 7.5% · 30yr · 1.5% tax · 5.0% vac · 8.0% maint · 8.0% mgmt
Financing live
Cash to close
- Down payment
- $43,725
- Closing costs
- $5,247
- Reserves months
- —
- Total cash needed
- —
Loan-product check · same deal, 3 products live
Conventional
25% down · 7.5% · 30yr
- Down + closing
- —
- Monthly P&I
- —
- Monthly cashflow
- —
- DSCR
- —
- Eligible?
- —
Personal DTI + credit; lowest rate.
DSCR
20% down · 8.5% · 30yr
- Down + closing
- —
- Monthly P&I
- —
- Monthly cashflow
- —
- DSCR
- —
- Eligible?
- —
No personal income docs; deal must DSCR.
Hard money
10% down · 12.0% · 12mo
- Down + closing
- —
- Monthly P&I
- —
- Monthly cashflow
- —
- DSCR
- —
- Eligible?
- —
Short-term bridge; refi at stabilization.
Rent comps 8 comps
| Address | Beds | Baths | Sqft | Rent | $/sqft | DOM | Units | Dist |
|---|---|---|---|---|---|---|---|---|
| 621 Academy St Watertown, NY | 3.0 | 2.0 | 1652 | $1,600 | $0.97 | 45d | 1 | 0.17mi |
| 417 Franklin St Watertown, NY | 3.0 | 2.5 | 3000 | $1,750 | $0.58 | 45d | 1 | 0.22mi |
| 128 Park Ave Watertown, NY | 3.0 | 2.0 | 2300 | $2,400 | $1.04 | 45d | 1 | 0.54mi |
| 256 Michigan Ave Watertown, NY | 2.0–4.0 | 1.0–2.5 | 1435 | $1,626 | $1.13 | 45d | 9 | 0.89mi |
| 377 W Main St Unit 1 Watertown, NY | 3.0 | 1.0 | 1991 | $1,350 | $0.68 | 45d | 1 | 1.06mi |
| 156 N Meadow St Watertown, NY | 4.0 | 1.0 | 2535 | $1,500 | $0.59 | 45d | 1 | 1.15mi |
| 1815 Olmstead Dr Watertown, NY | 2.0–4.0 | 1.0–2.0 | 1380 | $1,676 | $1.21 | 45d | 6 | 1.20mi |
| 702 Leray St Watertown, NY | 3.0 | 1.0 | 2700 | $1,300 | $0.48 | 45d | 1 | 1.29mi |
Listing history 3 events
-
2026-06-21days on market $174,900 Active 3 DOM
-
2026-06-19remarks 699-char remark
-
2026-06-19$174,900 Active 1 DOM
ⓘ Source: listings_history table (triggers on properties + properties_extension) + one-shot
backfill from property_details.listing_events for pre-trigger history.
Tax reassessment forecast NY · Partial reset (capped growth)
- Current annual tax
- $2,062 · $172/mo
- Projected year-2 tax
- $2,509 · $209/mo
- Expected delta
- +$447/yr (+$37/mo · 21.7%)
ⓘ Screening estimate from a state-policy table — verify with the county assessor before closing.
Climate risk First Street
- Flood 1/10 Low FEMA zone X · 0% chance over 30 yrs
- Wildfire 1/10 Low
- Heat 2/10 Low 7 d/yr ≥91°F today · 15 d/yr by 30 yrs out
- Wind 1/10 Low 0% chance of damaging wind over 30 yrs
- Air quality 2/10 Low 1 unhealthy d/yr today · 1 by 30 yrs out
Nearby sold comps map
Loading sold comps map…
Walkable amenities ~0.75 mi
Loading nearby amenities…
Taxation est. · year 1
- Rental income
- $50,268
- − Mortgage interest
- −$9,797
- − Property taxes
- −$2,062
- − Insurance
- −$874
- − Repairs & maintenance
- −$4,021
- − Management
- −$4,021
- − Depreciation
- −$5,088
- Taxable income
- $24,403
- Est. tax owed @ 24.0%
- −$5,857
- After-tax cash flow
- $19,912/yr
For passive investors: Depreciation is non-cash, so a rental often shows a tax loss while cash-flowing — sheltering income. Rental losses are passive: they offset passive income freely, and up to $25,000/yr can offset ordinary (W-2) income if you actively participate and your MAGI is under $100k (phasing out to $0 by $150k); unused losses carry forward. On sale, claimed depreciation is recaptured at up to 25%, and gains may owe capital-gains tax (a 1031 exchange can defer both). Figures are a year-1 estimate at your 24.0% rate — not tax advice; consult a CPA.
Schools (NCES district)
- District
- Watertown City School District
- NCES district ID
- 3630120
- Math proficiency
- 34% ▼ -10.00%
- Reading proficiency
- 54% ▲ 12.00%
- Median HH income
- $40,919
- Composite
- 36.86/100
- National rank
- #4551
- State rank
- #481 of 590 in NY
Livability — Watertown
- Score
- 68/100
- State rank
- #540
- US rank
- #9700
Category grades
Schools grade is shown separately in the Schools card above.
Census & demographics
- Census place
- Watertown, NY
- County
- Jefferson County · 47,417 people
- City population
- 36,839
- Metro
- Watertown-Fort Drum, NY
- Population (ZIP)
- 36,839
- Household income
- $58,791
- Rent vs Own
- Severe rent burden
- 1634.0
Population outlook (Jefferson County) Hauer SSP2
- Today (2025)
- 111,748 people
- By 2030
- 109,370 · -2.1%
- By 2040
- 103,828 · -7.1%
- By 2050
- 98,523 · -11.8%
- By 2075
- 91,422 · -18.2%
- By 2100
- 78,214 · -30.0%
Race, ethnicity, and origin ACS 2023
- Neighborhood character
- Predominantly White (82%)
- Race & ethnicity
- White 82% Two or more races 7% Hispanic / Latino 6% Black 4% Asian 2%
- Hispanic origin (detail)
- Mexican 2% Puerto Rican 2%
- Common ancestry
- Lithuanian 7% Romanian 3% Slovak 2%
- Foreign-born
- 4% · Canada
- Languages at home
- 94% English-only · Spanish 3% Other Indo-European 1% German/W. Germanic 1%
Political lean MEDSL · Jefferson
- 2024 margin
- Strong R (+23.6) · D 38.2% · R 61.8%
- 2008→2024 swing
- -18.3pp toward R · 2008: -5.3pp · 2024: -23.6pp
- All cycles
- 2024: R+23.6 2020: R+19.0 2016: R+22.4 2012: R+2.9 2008: R+5.3
Not yet ingested
- Civics
- —
Market trends
- HPI YoY
- ▼ -18.86%
- Current HPI
- 316.636
- Rent YoY
- ▲ 9.96%
- Metro
- Watertown-Fort Drum, NY
- State GDP YoY
- ▲ 2.60%
- F500 in state
- 92
Industry mix (Fortune 500 HQ in NY)
| Industry | F500 HQs | Revenue |
|---|---|---|
| Financial Services | 10 | $950B |
|
||
| Consumer Goods | 9 | $162B |
|
||
| Insurance | 4 | $225B |
|
||
| Telecommunications | 2 | $144B |
|
||
| Pharmaceuticals | 2 | $112B |
|
||
| Media / Entertainment | 2 | $69B |
|
||
Price history
+134.8% since first listed22 events — show timeline
- 2026-06-18 Listed $174,900 CNYIS
- 2026-05-01 Listing Removed — CNYIS
- 2026-04-23 Relisted — CNYIS
- 2026-01-18 Contingent — CNYIS
- 2025-12-02 Price Changed $175,000 CNYIS
- 2025-11-14 Price Changed $165,000 CNYIS
- 2025-10-10 Relisted — CNYIS
- 2025-10-02 Contingent — CNYIS
- 2025-08-07 Listed $225,000 CNYIS
- 2024-03-22 Sold (Public Records) $76,000 Public Records
- 2024-03-21 Sold (MLS) $86,000 CNYIS
- 2024-01-18 Contingent — CNYIS
- 2024-01-16 Listed $115,000 CNYIS
- 2024-01-12 Listing Removed — CNYIS
- 2023-10-03 Listed $115,000 CNYIS
- 2012-11-15 Sold (MLS) $95,000 CNYIS
- 2012-11-09 Sold (Public Records) $95,000 Public Records
- 2012-01-18 Listed $114,000 CNYIS
- 2008-08-15 Sold (Public Records) $52,000 Public Records
- 2008-08-15 Sold (MLS) $52,000 CNYIS
- 2007-06-28 Listed $89,900 CNYIS
- 2003-11-12 Sold (Public Records) $74,500 Public Records
Property tax history
+18.7%/yrLatest (2025): $2,062 · +3.9% YoY. Source: county tax records.
Cash-flow waterfall
monthlySold comps — $/sqft
last 12 mo · ≤1 miLoading sold comps…