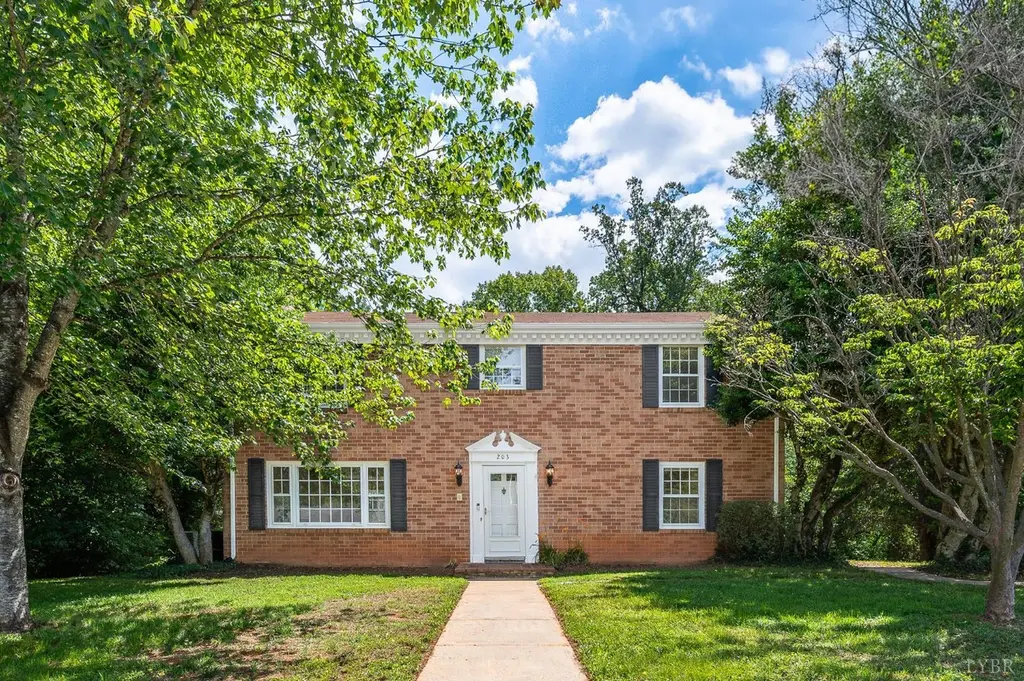
203 Nottingham Cir · Lynchburg, VA
Flood risk 1/10 · Minimal
- FEMA flood zone
- X (unshaded)
- Chance of flooding over 30 yrs
- 0.0%
- Est. flood insurance / yr
- $473 – $860
Fire risk 2/10 · Minimal
- Est. fire insurance / yr
- $666 – $1,236
Heat risk 5/10 · Moderate
- Hot days now (above 101°F)
- 7 days/yr
- Hot days in 30 yrs
- 18 days/yr
Wind risk 2/10 · Minimal
- Chance of severe wind over 30 yrs
- 2.0%
Air-quality risk 2/10 · Minimal
- Unhealthy air days now
- 1 days/yr
- Unhealthy air days in 30 yrs
- 1 days/yr
Risk factors via First Street. Map © Google.
Why this score? — see what drove the D+ grade
The composite is a weighted blend of 9 inputs, each scored 0–100. Each bar is that input's sub-score; the figure is the points it added to the 100-point composite (weight × sub-score).
- ARV discount +15.0/15.0
- Cash flow +12.4/30.0
- Livability +4.5/5.0
- Schools +4.0/10.0
- Rent growth +3.8/5.0
- DSCR +3.7/10.0
- 1% rule +2.9/10.0
- Condition / age +2.5/5.0
- Appreciation +0.0/10.0
$299,900
🖨 Deal sheet 📄 Offer letter ✓ Due diligence
Listing remarks
Conveniently located in the Windsor Hills neighborhood with a backyard that is private and serene, this move-in ready classic two-story brick home offers plenty of space and timeless character. The main level features a generous living room with a gas fireplace, formal dining room, kitchen, and a den/home office with a convenient half bath. Hardwood floors run throughout much of the home. Upstairs, you'll find four bedrooms and two updated full bathrooms. The home also offers a third full bathroom in the basement plus built-in cabinetry and another gas log fireplace, providing added convenience for family and guests. Additional highlights include an attached garage, laundry room, screened p
Key facts
- Formal dining room
- Private backyard
- Gas fireplace
Tags
Property features AI
Exterior
- Parking: Off-street parking
- Security: Smoke detector(s)
- Utilities: Public water; Septic tank
- Home design: Single family residence; 2 stories
- Construction: Brick construction; Shingle roof
- Exterior features: Screened patio/porch; Storm door(s)
Interior
- Kitchen: Dishwasher; Electric range; Refrigerator; Electric water heater
- Flooring: Ceramic tile; Hardwood; Laminate; Wood
- Bathrooms: 3 full bathrooms; 1 half bathroom
- Heating & cooling: Heat pump; Zoned heating; Zoned cooling; Attic fan
- Interior features: Storm windows; Finished walk-out basement; Smoke detector(s)
- Laundry & utility: Laundry room with washer hookup; Washer; Dryer; Laundry in basement
Neighborhood map
What this means for you Summary
Snapshot
- This is a 4-bed/3.5-bath single-family listed at $300k.
Deal economics
- At list price, monthly cash flow is $-49 ($-583/yr) — negative.
- To cash-flow at today's rent, offer at most $291k (2.9% below list).
- To meet the 1% rule (rent ≥ 1% of price), the offer needs to be $236k (21.4% below list).
- Recommended offer: $236k (21.4% below list) — sets the bar for 1% rule.
- Cap rate 6.1% vs local median 4.0% in Lynchburg — top-decile yield for the area; either an underpriced asset or a hidden risk that comps aren't pricing in. Stress-test before assuming the spread holds.
Location & tenants
- Location reads 91/100 on livability (#1 in VA, #58 nationally) — a professional / high-income tenant draw. Strengths: amenities A+, commute A+, cost of living A+; Watch: crime C-, employment D+.
- Lynchburg City Public School District (urban): math 36% / reading 61% proficiency, ranked #104 of 131 in VA (top 79%) — families likely to look elsewhere, expect single-tenant / working-renter base with shorter leases; 61% free/reduced lunch — lower-income household profile, screen leases tightly.
- Zoned schools: Heritage Elementary (math 22% / reading 47%, grade F, #966 of 1,108 statewide, top 89%, 475 students, 90% FRL); Sandusky Middle (math 29% / reading 52%, grade F, #303 of 342 statewide, top 89%, 568 students, 96% FRL); Heritage High (math 32% / reading 77%, grade C-, #281 of 319 statewide, top 90%, 1,073 students, 94% FRL) — zoned schools average 93% FRL vs 61% district-wide (32 pts higher); higher-poverty schools than district average — tighter screening recommended.
- Market conditions: Rents rising fast (+5.1%/yr); 318 active listings in the ZIP; 8 comparable units currently listed for rent nearby; rentals at typical pace (median 21d on market — plan ~3-4 weeks tenant-placement turnaround); 472 units permitted in Lynchburg city in 2024 (240 in 5+ unit buildings).
- This rent runs 41% of the median local income ($69k/yr) — at the standard rent-burdened threshold; future hikes will face affordability resistance.
Forward outlook
- Local home prices are declining (-3.0%/yr); year-one equity from $2k of loan paydown is wiped out by about $9k of value loss. Plan a longer hold.
- Lynchburg County population projected at +37% by 2050 — long-run rental-demand tailwind backs the buy-and-hold thesis.
Negotiation context
- Only 4 days on market — expect competitive offers; lowballing is unlikely to land.
- Current owner paid $160k; list at $300k implies a 88% gain — meaningful room to come down on a strong offer.
Risks & watch-outs
- Climate carrying-cost: extreme-heat days projected 7→18/yr by 2055 (HVAC capex compounding) — expect insurance premiums to compound above CPI over the hold.
Questions for the listing agent
- What do current leases actually rent for vs. the listed asking? Can we see a recent rent roll and the last 12 months of T-12 income?
- Built in 1965 — when were the roof, HVAC, electrical panel, plumbing, and water heater last replaced?
- Is there a deadline driving the sale (1031 exchange, divorce, estate, relocation)? That informs how much negotiation room exists.
- Schools are A-rated — typically a magnet for longer-tenancy family renters. What's the average tenant stay here, and is there a school-zone premium baked into asking?
- The area grade is low — what's the realistic commute time and amenity access for the typical tenant pool here? Any planned neighborhood developments (good or bad) we should know about?
- What's the average days-on-market for RENTAL listings here right now (not sales)? A rising rental-DOM trend means longer vacancies and softer asking-rent achievability than the comps imply.
- What's the recent tenant-quality profile in this submarket — average credit score on applications, eviction rate, late-payment / NSF rate, and stable-employment percentage? A property-management company in the area should have these aggregated.
- How much new for-sale + rental construction is in the pipeline within 1–3 miles? Heavy new supply typically softens prices + rents 12–24 months out; constrained supply supports both.
Investment metrics
- 1% rule
- 0.79% ✗
- Cap rate
- 6.10%
- Cash-on-cash
- -0.69%
- DSCR
- 0.97
- GRM
- 10.6
CMA / ARV
- ARV (on-the-fly)
- $376,134
- Comps found
- 12
Show comp detail 12 sales within ~0.75 mi
| Address | Dist | Beds/Ba | Sqft | Sold | Price | $/sf | Match |
|---|---|---|---|---|---|---|---|
| 230 Chesterfield Pl | 0.14mi | 4/3.0 | 2,902 (+7%) | 7mo | $395,000 | $136 | 74 |
| 103 Chesterfield Rd | 0.29mi | 3/3.0 (-1) | 2,748 (+2%) | 5mo | $381,250 | $139 | 73 |
| 121 Gatlin St | 0.14mi | 4/2.0 | 2,478 (-8%) | 2mo | $306,000 | $123 | 72 |
| 1218 Lakeview Dr | 0.28mi | 4/2.0 | 2,496 (-8%) | 6mo | $299,900 | $120 | 63 |
| 1008 Grand View Circle Cir | 0.64mi | 5/3.0 (+1) | 2,710 (+0%) | 1mo | $391,400 | $144 | 62 |
| 574 Leesville Rd | 0.55mi | 4/3.5 | 2,742 (+1%) | 13mo | $435,000 | $159 | 62 |
| 1002 Grand View Cir | 0.59mi | 3/3.0 (-1) | 2,741 (+1%) | 8mo | $310,000 | $113 | 57 |
| 1043 Moreview Dr | 0.70mi | 3/3.0 (-1) | 2,724 (+1%) | 8mo | $330,000 | $121 | 53 |
| 3000 Roundelay Rd | 0.72mi | 3/1.0 (-1) | 2,614 (-3%) | 6mo | $240,000 | $92 | 40 |
| 205 Bentley Grove Way | 0.74mi | 5/3.0 (+1) | 2,492 (-8%) | 12mo | $540,000 | $217 | 35 |
| 403 Cornerstone Street St | 0.72mi | 4/2.5 | 2,337 (-14%) | 8mo | $412,500 | $177 | 33 |
| 212 Roundelay Cir | 0.66mi | 3/2.0 (-1) | 2,398 (-11%) | 10mo | $370,000 | $154 | 31 |
Match score weights: distance 35% · size 25% · config 20% · recency 20%. Top-matched comps best support the ARV.
Projected returns pro-forma
-3.0% appreciation · 5.11% rent growth · sell at horizon
- IRR
- -15.3%
- Equity multiple
- 0.44×
- Total profit
- $-46,645
- Equity at exit
- $44,716
- IRR
- -3.8%
- Equity multiple
- 0.73×
- Total profit
- $-22,976
- Equity at exit
- $25,930
Cash invested: $83,972 (down + closing). Projections, not guarantees.
Landlord ↔ Tenant lean methodology
- Overall (STATE)
- 55 Moderately Landlord-Leaning
- State Virginia
- 55 Moderately Landlord-Leaning · D+2
- County
- — inherits STATE
- City
- — inherits STATE
ZIP-level market 24502
- Rents YoY
- 5.1%
- Active inventory
- 318
- Price-to-rent
- 10.6×
Monthly cashflow live
- Estimated rent
- $2,356 high interval (Pro) →
- Mortgage (P&I)
- −$1,573
- Tax from tax record
- −$212 /mo · $2,549/yr
- Insurance
- −$125
- HOA
- −$0
- Vacancy / Maint / Mgmt
- −$495
- Net cashflow
- $-49
Break-even live
UW: 25.0% down · 7.5% · 30yr · 1.5% tax · 5.0% vac · 8.0% maint · 8.0% mgmt
Financing live
Cash to close
- Down payment
- $74,975
- Closing costs
- $8,997
- Reserves months
- —
- Total cash needed
- —
Loan-product check · same deal, 3 products live
Conventional
25% down · 7.5% · 30yr
- Down + closing
- —
- Monthly P&I
- —
- Monthly cashflow
- —
- DSCR
- —
- Eligible?
- —
Personal DTI + credit; lowest rate.
DSCR
20% down · 8.5% · 30yr
- Down + closing
- —
- Monthly P&I
- —
- Monthly cashflow
- —
- DSCR
- —
- Eligible?
- —
No personal income docs; deal must DSCR.
Hard money
10% down · 12.0% · 12mo
- Down + closing
- —
- Monthly P&I
- —
- Monthly cashflow
- —
- DSCR
- —
- Eligible?
- —
Short-term bridge; refi at stabilization.
Rent comps 8 comps
| Address | Beds | Baths | Sqft | Rent | $/sqft | DOM | Units | Dist |
|---|---|---|---|---|---|---|---|---|
| 304 Hunterdale Dr Lynchburg, VA | 3.0 | 2.5 | 2100 | $2,400 | $1.14 | 13d | 1 | 0.69mi |
| 217 Bentley Grove Way Lynchburg, VA | 5.0 | 3.0 | 2536 | $3,495 | $1.38 | 21d | 1 | 0.73mi |
| 7222 Richland Dr Lynchburg, VA | 4.0 | 2.0 | 2164 | $1,950 | $0.90 | 43d | 1 | 0.79mi |
| 211 Meridian St Lynchburg, VA | 3.0 | 3.0 | 1815 | $2,300 | $1.27 | 13d | 1 | 0.87mi |
| 151 Kitty Hawk Sq Lynchburg, VA | 3.0 | 2.5 | 1800 | $1,450 | $0.81 | 21d | 1 | 1.18mi |
| 518 Northwynd Cir Lynchburg, VA | 3.0 | 2.5 | 2224 | $1,900 | $0.85 | 43d | 1 | 1.33mi |
| 104 Tulane St Lynchburg, VA | 5.0 | 3.0 | 2764 | $2,400 | $0.87 | 13d | 1 | 1.33mi |
| 639 Wyndhurst Dr Unit 639 Lynchburg, VA | 3.0 | 3.0 | 1940 | $700 | $0.36 | 13d | 1 | 1.45mi |
Listing history 4 events
-
2026-06-09status $299,900 Pending 4 DOM
-
2026-06-08days on market $299,900 Active 4 DOM
-
2026-06-07remarks 699-char remark
-
2026-06-07$299,900 Active 3 DOM
ⓘ Source: listings_history table (triggers on properties + properties_extension) + one-shot
backfill from property_details.listing_events for pre-trigger history.
Tax reassessment forecast VA · Resets to sale price
- Current annual tax
- $2,549 · $212/mo
- Projected year-2 tax
- $2,549 · $212/mo
- Expected delta
- $0/yr ($0/mo · 0.0%)
ⓘ Screening estimate from a state-policy table — verify with the county assessor before closing.
Climate risk First Street
- Flood 1/10 Low FEMA zone X (unshaded) · 0% chance over 30 yrs
- Wildfire 2/10 Low
- Heat 5/10 Major 7 d/yr ≥101°F today · 18 d/yr by 30 yrs out
- Wind 2/10 Low 2% chance of damaging wind over 30 yrs
- Air quality 2/10 Low 1 unhealthy d/yr today · 1 by 30 yrs out
Nearby sold comps map
Loading sold comps map…
Walkable amenities ~0.75 mi
Loading nearby amenities…
Taxation est. · year 1
- Rental income
- $28,276
- − Mortgage interest
- −$16,799
- − Property taxes
- −$2,549
- − Insurance
- −$1,500
- − Repairs & maintenance
- −$2,262
- − Management
- −$2,262
- − Depreciation
- −$8,724
- Taxable loss
- −$5,820
- Est. tax savings @ 24.0%
- +$1,397
- After-tax cash flow
- $814/yr
For passive investors: Depreciation is non-cash, so a rental often shows a tax loss while cash-flowing — sheltering income. Rental losses are passive: they offset passive income freely, and up to $25,000/yr can offset ordinary (W-2) income if you actively participate and your MAGI is under $100k (phasing out to $0 by $150k); unused losses carry forward. On sale, claimed depreciation is recaptured at up to 25%, and gains may owe capital-gains tax (a 1031 exchange can defer both). Figures are a year-1 estimate at your 24.0% rate — not tax advice; consult a CPA.
Schools (NCES district)
- District
- Lynchburg City Public School District
- NCES district ID
- 5102340
- Math proficiency
- 36% ▼ -38.00%
- Reading proficiency
- 61% ▼ -8.00%
- Median HH income
- $39,097
- Composite
- 40.4/100
- National rank
- #3730
- State rank
- #104 of 131 in VA
Livability — Lynchburg
- Score
- 91/100
- State rank
- #1
- US rank
- #58
Category grades
Schools grade is shown separately in the Schools card above.
Census & demographics
- Census place
- Lynchburg, VA
- County
- Lynchburg City · 97,036 people
- City population
- 97,036
- Metro
- Lynchburg, VA
- Population (ZIP)
- 41,979
- Household income
- $68,872
- Rent vs Own
- Severe rent burden
- 1774.0
Population outlook (Lynchburg County) Hauer SSP2
- Today (2025)
- 87,977 people
- By 2030
- 93,626 · +6.4%
- By 2040
- 106,145 · +20.7%
- By 2050
- 120,783 · +37.3%
- By 2075
- 162,249 · +84.4%
- By 2100
- 191,358 · +117.5%
Race, ethnicity, and origin ACS 2023
- Neighborhood character
- Predominantly White (68%)
- Race & ethnicity
- White 68% Black 19% Two or more races 6% Hispanic / Latino 6% Asian 2%
- Hispanic origin (detail)
- Mexican 2%
- Common ancestry
- Slovak 3% Italian 2% Lithuanian 2%
- Foreign-born
- 6% · Canada, South Korea, United Kingdom
- Languages at home
- 91% English-only · Spanish 4% Other Indo-European 1% Other Asian/Pacific 1%
Political lean MEDSL · Lynchburg
- 2024 margin
- Lean R (+7.9) · D 45.4% · R 53.3% · Other 1.3%
- 2008→2024 swing
- -3.9pp toward R · 2008: -4.0pp · 2024: -7.9pp
- All cycles
- 2024: R+7.9 2020: D+2.6 2016: R+9.0 2012: R+10.6 2008: R+4.0
Not yet ingested
- Civics
- —
Market trends
- HPI YoY
- ▼ -222.79%
- Current HPI
- 241.9041
- Rent YoY
- ▲ 5.11%
- Metro
- Lynchburg, VA
- State GDP YoY
- ▲ 2.40%
- F500 in state
- 50
Industry mix (Fortune 500 HQ in VA)
| Industry | F500 HQs | Revenue |
|---|---|---|
| Aerospace / Defense | 4 | $236B |
|
||
| Technology / Defense | 3 | $32B |
|
||
| Financial Services | 2 | $176B |
|
||
| Utilities | 2 | $27B |
|
||
| Insurance | 2 | $25B |
|
||
| Technology | 2 | $15B |
|
||
Price history
+334.6% since first listed4 events — show timeline
- 2026-06-03 Listed $299,900 LMLS
- 2005-07-27 Sold (Public Records) $159,900 Public Records
- 2004-06-01 Sold (Public Records) $131,000 Public Records
- 1985-03-01 Sold (Public Records) $69,000 Public Records
Property tax history
+2.4%/yrLatest (2025): $2,549 · +3.5% YoY. Source: county tax records.
Cash-flow waterfall
monthlySold comps — $/sqft
last 12 mo · ≤1 miLoading sold comps…