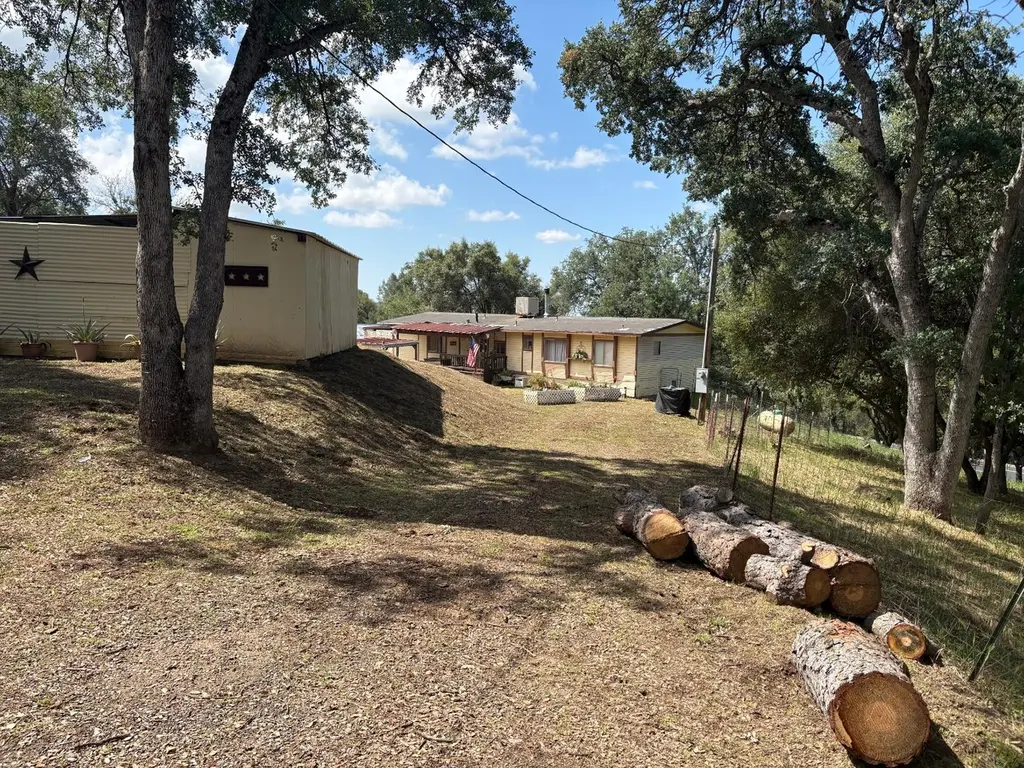
46174 Skyline Ridge Rd · Coarsegold, CA
Flood risk 1/10 · Minimal
- FEMA flood zone
- X (unshaded)
- Chance of flooding over 30 yrs
- 0.0%
- Est. flood insurance / yr
- $507 – $1,088
Fire risk 10/10 · Severe
- Est. fire insurance / yr
- $659 – $1,223
Heat risk 6/10 · Moderate
- Hot days now (above 101°F)
- 7 days/yr
- Hot days in 30 yrs
- 17 days/yr
Wind risk 1/10 · Minimal
- Chance of severe wind over 30 yrs
- —
Air-quality risk 10/10 · Severe
- Unhealthy air days now
- 54 days/yr
- Unhealthy air days in 30 yrs
- 66 days/yr
Risk factors via First Street. Map © Google.
Why this score? — see what drove the B- grade
The composite is a weighted blend of 9 inputs, each scored 0–100. Each bar is that input's sub-score; the figure is the points it added to the 100-point composite (weight × sub-score).
- Cash flow +30.0/30.0
- DSCR +10.0/10.0
- 1% rule +9.2/10.0
- ARV discount +7.5/15.0
- Livability +3.1/5.0
- Schools +2.7/10.0
- Rent growth +2.5/5.0
- Condition / age +2.5/5.0
- Appreciation +0.0/10.0
$180,000
🖨 Deal sheet 📄 Offer letter ✓ Due diligence
Listing remarks
Great value opportunity on 2.86 acres in the beautiful foothills! This 1,449 sq ft home offers privacy and plenty of potential for the right buyer. The property features a private well (good production with holding tank) and septic system. The home does need some work and is best suited for a cash buyer, making it a great option for investors or anyone looking to build equity. Whether you choose to renovate the existing home or build your dream home, this property offers flexibility and space to make it your own. Bring your animals and enjoy peaceful country living, all while being conveniently located just 20 minutes from Fresno and Madera.
Key facts
- Private well
- Septic system
- 2.86 acre lot
Tags
Property features AI
Exterior
- Parking: RV access/parking; Potential RV parking
- Utilities: Electric on; Septic tank; Public utilities available
- Home design: Manufactured home
- Construction: Metal siding; Wood subfloor foundation; Other roof
- Exterior features: One level; Corner lot; Foothill setting; Pasture; Horses allowed; Shed(s)
Interior
- Flooring: Carpet; Laminate
- Bathrooms: 2 bathrooms; Shower
- Heating & cooling: Wall/window unit(s) cooling; No central air
- Interior features: Wheelchair access; Fireplace (1)
- Laundry & utility: Laundry inside
Neighborhood map
What this means for you Summary
Snapshot
- This is a 3-bed/2.0-bath single-family listed at $180k.
Deal economics
- At list price, monthly cash flow is $956 ($11k/yr) — positive.
- The deal already cash-flows at list — no discount required.
- Meets the 1% rule at list price ($3k rent vs $180k).
- Cap rate 12.7% vs local median 3.8% in Coarsegold — top-decile yield for the area; either an underpriced asset or a hidden risk that comps aren't pricing in. Stress-test before assuming the spread holds.
Location & tenants
- Location reads 62/100 on livability (#474 in CA) — a middle-class / working-renter tenant base. Strengths: housing A+, employment A-; Watch: crime C-, amenities F, cost of living F.
- Yosemite Unified (rural): math 23% / reading 38% proficiency, ranked #321 of 517 in CA (top 62%) — families likely to look elsewhere, expect single-tenant / working-renter base with shorter leases.
- Zoned schools: Coarsegold Elementary (math 8% / reading 22%, grade F, #1,420 of 1,571 statewide, top 91%, 271 students, 70% FRL); Yosemite High (math 57% / reading 72%, grade B-, #165 of 1,170 statewide, top 15%, 553 students, 53% FRL) — zoned schools average 62% FRL vs 38% district-wide (24 pts higher); higher-poverty schools than district average — tighter screening recommended.
- Market conditions: 246 active listings in the ZIP; 1,346 units permitted in Madera County in 2024 (8 in 5+ unit buildings).
Forward outlook
- Local home prices are declining (-3.0%/yr); year-one equity from $1k of loan paydown is wiped out by about $5k of value loss. Plan a longer hold.
- Madera County population projected at +6% by 2050 — modest demand growth; plan on rents tracking national, not racing it.
- At projected returns (-3.0% appreciation + 3.0% rent growth), your $50k cash investment doubles in ~6 years — after that, you're playing with house money.
Negotiation context
- Only 5 days on market — expect competitive offers; lowballing is unlikely to land.
Risks & watch-outs
- Climate carrying-cost: severe wildfire risk; extreme-heat days projected 7→17/yr by 2055 (HVAC capex compounding) — expect insurance premiums to compound above CPI over the hold.
Questions for the listing agent
- Is there a deadline driving the sale (1031 exchange, divorce, estate, relocation)? That informs how much negotiation room exists.
- Schools are D-rated, which usually means shorter tenancies and higher turnover. Who's the typical renter profile here, and what's been the actual vacancy rate?
- What's the average days-on-market for RENTAL listings here right now (not sales)? A rising rental-DOM trend means longer vacancies and softer asking-rent achievability than the comps imply.
- What's the recent tenant-quality profile in this submarket — average credit score on applications, eviction rate, late-payment / NSF rate, and stable-employment percentage? A property-management company in the area should have these aggregated.
- How much new for-sale + rental construction is in the pipeline within 1–3 miles? Heavy new supply typically softens prices + rents 12–24 months out; constrained supply supports both.
Investment metrics
- 1% rule
- 1.42% ✓
- Cap rate
- 12.67%
- Cash-on-cash
- 22.77%
- DSCR
- 2.01
- GRM
- 5.9
CMA / ARV
- ARV (median comp)
- $388,406
- List price
- $180,000
- Delta
- -53.66%
- Verdict
- UNDERPRICED
- Comps
- 12 within 1.0 mi
Show comp detail 2 sales within ~0.75 mi
| Address | Dist | Beds/Ba | Sqft | Sold | Price | $/sf | Match |
|---|---|---|---|---|---|---|---|
| 46300 Oonay Nation Rd | 0.31mi | 3/2.0 | 1,624 (+13%) | 2mo | $230,500 | $142 | 62 |
| 33067 Blue Vista Ct | 0.72mi | 4/2.0 (+1) | 1,628 (+13%) | 4mo | $404,000 | $248 | 36 |
Match score weights: distance 35% · size 25% · config 20% · recency 20%. Top-matched comps best support the ARV.
Projected returns pro-forma
-3.0% appreciation · 3.0% rent growth · sell at horizon
- IRR
- 15.6%
- Equity multiple
- 1.63×
- Total profit
- $31,669
- Equity at exit
- $26,839
- IRR
- 24.3%
- Equity multiple
- 3.10×
- Total profit
- $105,708
- Equity at exit
- $15,563
Cash invested: $50,400 (down + closing). Projections, not guarantees.
Landlord ↔ Tenant lean methodology
- Overall (STATE)
- 18 Strongly Tenant-Friendly
- State California
- 18 Strongly Tenant-Friendly · D+13
- County
- — inherits STATE
- City
- — inherits STATE
ZIP-level market 93614
- Home prices YoY
- -32.1%
- Active inventory
- 246
- Price-to-rent
- 5.9×
Monthly cashflow live
- Estimated rent
- $2,553 medium interval (Pro) →
- Mortgage (P&I)
- −$944
- Tax from tax record
- −$41 /mo · $496/yr
- Insurance
- −$75
- HOA
- −$0
- Vacancy / Maint / Mgmt
- −$536
- Net cashflow
- $956
Break-even live
UW: 25.0% down · 7.5% · 30yr · 1.5% tax · 5.0% vac · 8.0% maint · 8.0% mgmt
Financing live
Cash to close
- Down payment
- $45,000
- Closing costs
- $5,400
- Reserves months
- —
- Total cash needed
- —
Loan-product check · same deal, 3 products live
Conventional
25% down · 7.5% · 30yr
- Down + closing
- —
- Monthly P&I
- —
- Monthly cashflow
- —
- DSCR
- —
- Eligible?
- —
Personal DTI + credit; lowest rate.
DSCR
20% down · 8.5% · 30yr
- Down + closing
- —
- Monthly P&I
- —
- Monthly cashflow
- —
- DSCR
- —
- Eligible?
- —
No personal income docs; deal must DSCR.
Hard money
10% down · 12.0% · 12mo
- Down + closing
- —
- Monthly P&I
- —
- Monthly cashflow
- —
- DSCR
- —
- Eligible?
- —
Short-term bridge; refi at stabilization.
Listing history 4 events
-
2026-05-04status Pending 420-char remark
-
2026-04-28$180,000 Active 420-char remark
-
2015-09-03soldstatus $48,000
-
2002-10-25soldstatus $90,000
ⓘ Source: listings_history table (triggers on properties + properties_extension) + one-shot
backfill from property_details.listing_events for pre-trigger history.
Tax reassessment forecast CA · Resets to sale price
- Current annual tax
- $496 · $41/mo
- Projected year-2 tax
- $1,368 · $114/mo
- Expected delta
- +$872/yr (+$73/mo · 176.0%)
ⓘ Screening estimate from a state-policy table — verify with the county assessor before closing.
Climate risk First Street
- Flood 1/10 Low FEMA zone X (unshaded) · 0% chance over 30 yrs
- Wildfire 10/10 Extreme
- Heat 6/10 Major 7 d/yr ≥101°F today · 17 d/yr by 30 yrs out
- Wind 1/10 Low
- Air quality 10/10 Extreme 54 unhealthy d/yr today · 66 by 30 yrs out
Nearby sold comps map
Loading sold comps map…
Walkable amenities ~0.75 mi
Loading nearby amenities…
Taxation est. · year 1
- Rental income
- $30,632
- − Mortgage interest
- −$10,083
- − Property taxes
- −$496
- − Insurance
- −$900
- − Repairs & maintenance
- −$2,451
- − Management
- −$2,451
- − Depreciation
- −$5,236
- Taxable income
- $9,016
- Est. tax owed @ 24.0%
- −$2,164
- After-tax cash flow
- $9,312/yr
For passive investors: Depreciation is non-cash, so a rental often shows a tax loss while cash-flowing — sheltering income. Rental losses are passive: they offset passive income freely, and up to $25,000/yr can offset ordinary (W-2) income if you actively participate and your MAGI is under $100k (phasing out to $0 by $150k); unused losses carry forward. On sale, claimed depreciation is recaptured at up to 25%, and gains may owe capital-gains tax (a 1031 exchange can defer both). Figures are a year-1 estimate at your 24.0% rate — not tax advice; consult a CPA.
Schools (NCES district)
- District
- Yosemite Unified
- NCES district ID
- 0600160
- Math proficiency
- 23% ▼ -12.00%
- Reading proficiency
- 38% ▼ -15.00%
- Median HH income
- $53,950
- Composite
- 26.94/100
- National rank
- #7079
- State rank
- #321 of 517 in CA
Livability — Coarsegold
- Score
- 62/100
- State rank
- #474
- US rank
- #16129
Category grades
Schools grade is shown separately in the Schools card above.
Census & demographics
- Census place
- Coarsegold, CA
- City population
- 11,144
- Population (ZIP)
- 11,144
Population outlook (Madera County) Hauer SSP2
- Today (2025)
- 157,915 people
- By 2030
- 159,604 · +1.1%
- By 2040
- 163,454 · +3.5%
- By 2050
- 167,071 · +5.8%
- By 2075
- 171,182 · +8.4%
- By 2100
- 162,781 · +3.1%
Race, ethnicity, and origin ACS 2023
- Neighborhood character
- Predominantly White (74%)
- Race & ethnicity
- White 74% Hispanic / Latino 14% Two or more races 13% Black 2% Native American 1%
- Hispanic origin (detail)
- Mexican 13%
- Common ancestry
- Slovak 4% Italian 2% Portuguese 2%
- Foreign-born
- 3% · Canada, Vietnam, Jamaica
- Languages at home
- 94% English-only · Spanish 5% Other Indo-European 1%
Political lean MEDSL · Madera
- 2024 margin
- Strong R (+20.8) · D 38.4% · R 59.2% · Other 2.4%
- 2008→2024 swing
- -7.5pp toward R · 2008: -13.3pp · 2024: -20.8pp
- All cycles
- 2024: R+20.8 2020: R+11.6 2016: R+17.3 2012: R+19.4 2008: R+13.3
Not yet ingested
- Civics
- —
Market trends
- HPI YoY
- ▼ -100.85%
- Current HPI
- 212.7962
- Rent YoY
- —
- Metro
- —
- State GDP YoY
- ▲ 3.21%
- F500 in state
- 116
Industry mix (Fortune 500 HQ in CA)
| Industry | F500 HQs | Revenue |
|---|---|---|
| Technology | 27 | $1,492B |
|
||
| Financial Services | 3 | $174B |
|
||
| Retail | 3 | $44B |
|
||
| Insurance | 3 | $26B |
|
||
| Media / Entertainment | 2 | $115B |
|
||
| Pharmaceuticals / Biotech | 2 | $62B |
|
||
Price history
+100.0% since first listed6 events — show timeline
- 2026-05-29 Sold (Public Records) $180,000 Public Records
- 2026-05-29 Sold (MLS) $180,000 FRESNOMLS
- 2026-05-04 Pending — FRESNOMLS
- 2026-04-28 Listed $180,000 FRESNOMLS
- 2015-09-03 Sold (Public Records) $48,000 Public Records
- 2002-10-25 Sold (Public Records) $90,000 Public Records
Property tax history
-8.5%/yrLatest (2023): $496 · +2.7% YoY. Source: county tax records.
Cash-flow waterfall
monthlySold comps — $/sqft
last 12 mo · ≤1 miLoading sold comps…