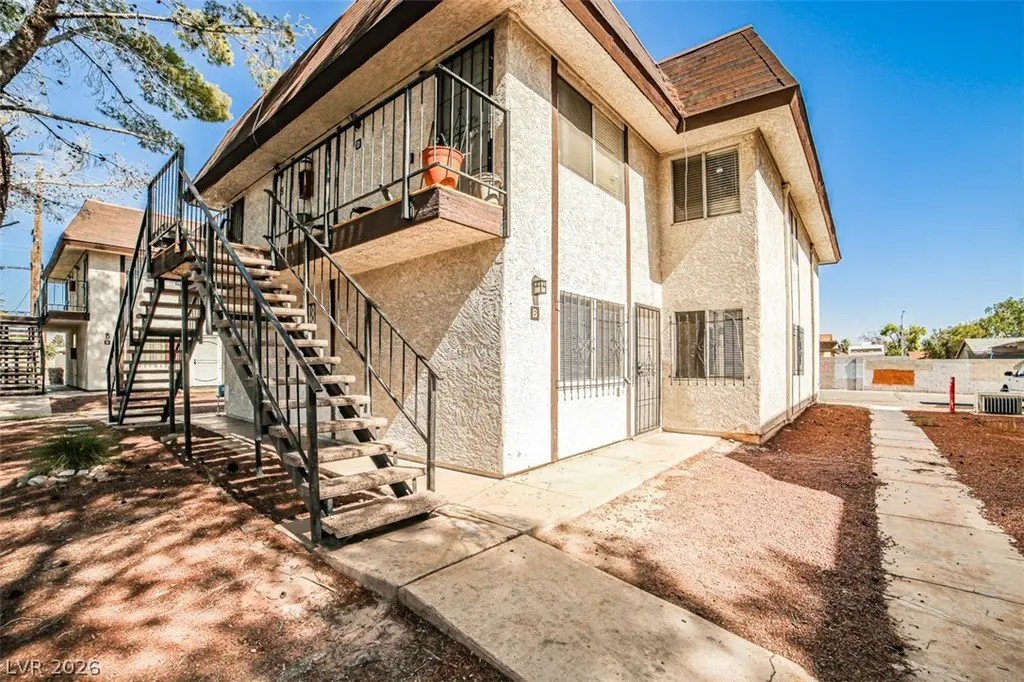
4348 Tara Ave #2 · Las Vegas, NV
Flood risk 1/10 · Minimal
- FEMA flood zone
- X (unshaded)
- Chance of flooding over 30 yrs
- 0.0%
- Est. flood insurance / yr
- $507 – $1,088
Fire risk 1/10 · Minimal
- Est. fire insurance / yr
- $490 – $910
Heat risk 8/10 · Major
- Hot days now (above 106°F)
- 7 days/yr
- Hot days in 30 yrs
- 18 days/yr
Wind risk 1/10 · Minimal
- Chance of severe wind over 30 yrs
- —
Air-quality risk 3/10 · Minor
- Unhealthy air days now
- 2 days/yr
- Unhealthy air days in 30 yrs
- 3 days/yr
Risk factors via First Street. Map © Google.
Why this score? — see what drove the C- grade
The composite is a weighted blend of 9 inputs, each scored 0–100. Each bar is that input's sub-score; the figure is the points it added to the 100-point composite (weight × sub-score).
- Cash flow +20.7/30.0
- ARV discount +7.5/15.0
- 1% rule +6.6/10.0
- DSCR +6.6/10.0
- Livability +4.0/5.0
- Schools +2.6/10.0
- Condition / age +2.5/5.0
- Rent growth +2.0/5.0
- Appreciation +0.0/10.0
$129,000
🖨 Deal sheet 📄 Offer letter ✓ Due diligence
Listing remarks MLS
MOTIVATED SELLER - PRICED TO SELL!!! DON'T MISS THE OPPORTUNITY * * Convenient central SW location near Chinatown, just minutes from the Strip. Perfect downstairs condo, newly renovated—ideal for investment or owner-occupancy. This 2-bedroom, 1-bath unit features wood-like flooring throughout, stylish two-tone custom paint, a modern kitchen with newly installed quartz countertops and stainless steel appliances next to a formal dining room. The front spacious living room is great for gathering and entertaining. Beautiful bathroom with tub and shower, plus a large laundry room offering ample storage.
Key facts
- Formal dining room
- Large laundry room
- Modern kitchen
Tags
Neighborhood map
What this means for you Summary
Snapshot
- This is a 2-bed/1.0-bath condo listed at $129k.
Deal economics
- At list price, monthly cash flow is $174 ($2k/yr) — positive.
- The deal already cash-flows at list — no discount required.
- Meets the 1% rule at list price ($2k rent vs $129k).
- Recommended offer: $125k (3.0% below list) — sets the bar for market timing.
Location & tenants
- Location reads 80/100 on livability (#2 in NV, #1,723 nationally) — a professional / high-income tenant draw. Strengths: amenities A+, commute A+, housing A+; Watch: crime F.
- Clark County School District (urban): math 21% / reading 39% proficiency, ranked #11 of 17 in NV (top 65%) — families likely to look elsewhere, expect single-tenant / working-renter base with shorter leases.
- Market conditions: Rents soft (-2.1%/yr); 140 active listings in the ZIP; 30 comparable units currently listed for rent nearby; rentals lingering (median 44d on market — plan ~5-8 weeks vacancy on turnover, expect pricing pressure); 90% of comp listings sitting > 30 days — soft ceiling on asking rent; 14,754 units permitted in Clark County in 2024 (2,301 in 5+ unit buildings).
- This rent runs 36% of the median local income ($50k/yr) — at the standard rent-burdened threshold; future hikes will face affordability resistance.
Forward outlook
- Local home prices are declining (-3.0%/yr); year-one equity from $892 of loan paydown is wiped out by about $4k of value loss. Plan a longer hold.
- Clark County population projected at +36% by 2050 — long-run rental-demand tailwind backs the buy-and-hold thesis.
Negotiation context
- It's been on market 53 days — a 3% lower offer ($125k) is reasonable based on typical stale-listing flexibility.
- 10 sale attempts since 8y ago; this cycle's ask has dropped $20k (13%) from the opening price — seller is motivated, your offer sets the floor, not the list.
Risks & watch-outs
- Climate carrying-cost: extreme-heat days projected 7→18/yr by 2055 (HVAC capex compounding) — expect insurance premiums to compound above CPI over the hold.
Questions for the listing agent
- It's been on market 53 days. Have you received any prior offers? Is the seller open to a 3% concession, seller financing, or rate buy-down credit?
- What does the HOA fee cover, when was the last increase, and are there any pending special assessments or reserve-fund shortfalls?
- Any open or pending special assessments — roof, HVAC, plumbing, elevator, façade? What's the per-unit balance and payoff schedule, and is the seller paying it off at close or rolling it to the buyer?
- Is there a deadline driving the sale (1031 exchange, divorce, estate, relocation)? That informs how much negotiation room exists.
- Crime grade is F in this area — have there been break-ins, vandalism, or insurance claims at this property in the last 3 years? What carrier currently insures it and at what premium?
- What's the average days-on-market for RENTAL listings here right now (not sales)? A rising rental-DOM trend means longer vacancies and softer asking-rent achievability than the comps imply.
- What's the recent tenant-quality profile in this submarket — average credit score on applications, eviction rate, late-payment / NSF rate, and stable-employment percentage? A property-management company in the area should have these aggregated.
- How much new apartment / multifamily construction is in the pipeline within 1–3 miles? Heavy new supply (>2% of stock underway) typically softens rents 12–24 months out; light construction supports rent growth.
Investment metrics
- 1% rule
- 1.16% ✓
- Cap rate
- 7.91%
- Cash-on-cash
- 5.77%
- DSCR
- 1.26
- GRM
- 7.2
CMA / ARV
No comps found within radius.
Projected returns pro-forma
-3.0% appreciation · 0.0% rent growth · sell at horizon
- IRR
- -11.1%
- Equity multiple
- 0.61×
- Total profit
- $-14,143
- Equity at exit
- $19,234
- IRR
- -7.6%
- Equity multiple
- 0.59×
- Total profit
- $-14,671
- Equity at exit
- $11,154
Cash invested: $36,120 (down + closing). Projections, not guarantees.
Landlord ↔ Tenant lean methodology
- Overall (STATE)
- 71 Landlord-Friendly
- State Nevada
- 71 Landlord-Friendly · R+1
- County
- — inherits STATE
- City
- — inherits STATE
ZIP-level market 89102
- Rents YoY
- -2.1%
- Active inventory
- 140
- Price-to-rent
- 7.2×
Monthly cashflow live
- Estimated rent
- $1,500 high interval (Pro) →
- Mortgage (P&I)
- −$676
- Tax from tax record
- −$41 /mo · $493/yr
- Insurance
- −$54
- HOA
- −$240
- Vacancy / Maint / Mgmt
- −$315
- Net cashflow
- $174
Break-even live
UW: 25.0% down · 7.5% · 30yr · 1.5% tax · 5.0% vac · 8.0% maint · 8.0% mgmt
Financing live
Cash to close
- Down payment
- $32,250
- Closing costs
- $3,870
- Reserves months
- —
- Total cash needed
- —
Loan-product check · same deal, 3 products live
Conventional
25% down · 7.5% · 30yr
- Down + closing
- —
- Monthly P&I
- —
- Monthly cashflow
- —
- DSCR
- —
- Eligible?
- —
Personal DTI + credit; lowest rate.
DSCR
20% down · 8.5% · 30yr
- Down + closing
- —
- Monthly P&I
- —
- Monthly cashflow
- —
- DSCR
- —
- Eligible?
- —
No personal income docs; deal must DSCR.
Hard money
10% down · 12.0% · 12mo
- Down + closing
- —
- Monthly P&I
- —
- Monthly cashflow
- —
- DSCR
- —
- Eligible?
- —
Short-term bridge; refi at stabilization.
Rent comps 30 comps
| Address | Beds | Baths | Sqft | Rent | $/sqft | DOM | Units | Dist |
|---|---|---|---|---|---|---|---|---|
| 4545 Pennwood Ave Las Vegas, NV | 1.0–2.0 | 1.0–2.0 | 725 | $1,225 | $1.69 | 44d | 6 | 0.32mi |
| 4747 Pennwood Ave Las Vegas, NV | 1.0–2.0 | 1.0–2.0 | 839 | $1,577 | $1.88 | 44d | 25 | 0.43mi |
| 2666 S Decatur Blvd Las Vegas, NV | 1.0–3.0 | 1.0–2.0 | 938 | $1,719 | $1.83 | 44d | 15 | 0.47mi |
| 2950 S Decatur Blvd Las Vegas, NV | 2.0 | 1.0–2.0 | 690 | $1,608 | $2.33 | 44d | 22 | 0.51mi |
| 2851 S Decatur Blvd Las Vegas, NV | 1.0–2.0 | 1.0–2.0 | 866 | $1,704 | $1.97 | 44d | 15 | 0.54mi |
| 4550 W Sahara Ave Las Vegas, NV | 1.0–2.0 | 1.0–2.0 | 867 | $1,475 | $1.70 | 44d | 15 | 0.57mi |
| 3221 Jericho St Unit D Las Vegas, NV | 2.0 | 2.0 | 922 | $1,700 | $1.84 | 44d | 1 | 0.57mi |
| 3221 Jericho St Unit C Las Vegas, NV | 2.0 | 2.0 | 922 | $1,175 | $1.27 | 44d | 1 | 0.57mi |
| 3240 Cameron St Unit A Las Vegas, NV | 2.0 | 2.0 | 922 | $1,300 | $1.41 | 44d | 1 | 0.60mi |
| 3355 Arville St Las Vegas, NV | 1.0–2.0 | 1.0 | 700 | $1,642 | $2.35 | 44d | 11 | 0.69mi |
| 2683 S Decatur Blvd Las Vegas, NV | 1.0–2.0 | 1.0–2.0 | 785 | $1,450 | $1.85 | 44d | 16 | 0.69mi |
| 2301 S Valley View Blvd Las Vegas, NV | 1.0 | 1.0 | 624 | $1,504 | $2.41 | 44d | 6 | 0.78mi |
| 3481 Myrtle Ave Las Vegas, NV | 2.0 | 1.0 | 864 | $1,700 | $1.97 | 44d | 1 | 0.89mi |
| 5100 Obannon Dr Las Vegas, NV | 2.0 | 1.0–2.0 | 845 | $1,338 | $1.58 | 44d | 5 | 0.96mi |
| 3475 W Desert Inn Rd Las Vegas, NV | 1.0–3.0 | 1.0–2.0 | 1105 | $2,550 | $2.31 | 4d | 100 | 0.97mi |
| 5101 Obannon Dr Las Vegas, NV | 2.0 | 2.0 | 935 | $1,470 | $1.57 | 44d | 6 | 0.97mi |
| 5001 El Parque Ave Las Vegas, NV | 2.0 | 2.0 | 920 | $1,394 | $1.52 | 44d | 9 | 0.99mi |
| 5061 Pioneer Ave #202 Las Vegas, NV | 2.0 | 2.0 | 1105 | $1,590 | $1.44 | 44d | 1 | 1.01mi |
| 3463 Procyon St Las Vegas, NV | 3.0 | 1.0–2.0 | 1043 | $2,281 | $2.19 | 2d | 29 | 1.02mi |
| 3335 Hauck St Las Vegas, NV | 1.0–2.0 | 1.0–2.0 | 867 | $1,450 | $1.67 | 44d | 10 | 1.05mi |
| 1600 S Valley View Blvd Las Vegas, NV | 1.0–2.0 | 1.0 | 620 | $1,583 | $2.55 | 44d | 21 | 1.08mi |
| 1800 Edmond St Las Vegas, NV | 2.0 | 2.0 | 926 | $1,425 | $1.54 | 44d | 2 | 1.09mi |
| 3649 Van Dyke Ave Las Vegas, NV | 2.0 | 2.0 | 922 | $1,200 | $1.30 | 44d | 1 | 1.11mi |
| 4650 W Oakey Blvd Las Vegas, NV | 1.0–2.0 | 1.0–2.0 | 900 | $1,350 | $1.50 | 44d | 1 | 1.12mi |
| 3639 Kolendo Ct Unit A Las Vegas, NV | 2.0 | 2.0 | 912 | $999 | $1.10 | 44d | 1 | 1.12mi |
| 4080 W Twain Ave Las Vegas, NV | 1.0–3.0 | 1.0–2.0 | 858 | $1,750 | $2.04 | 44d | 8 | 1.13mi |
| 5353 W Desert Inn Rd Las Vegas, NV | 1.0–3.0 | 1.0–2.0 | 995 | $1,748 | $1.76 | 44d | 18 | 1.15mi |
| 3625 S Decatur Blvd Las Vegas, NV | 1.0–3.0 | 1.0–2.0 | 957 | $1,699 | $1.77 | 2d | 28 | 1.16mi |
| 3800 S Decatur Blvd Las Vegas, NV | 3.0 | 2.0 | 960 | $1,900 | $1.98 | 44d | 1 | 1.32mi |
| 5409 Mountain View Dr Las Vegas, NV | 3.0 | 2.0 | 1115 | $1,935 | $1.74 | 44d | 1 | 1.41mi |
HOA detail condo
- Monthly dues
- $240 · $2,880/yr
- Assessments
- None detected in remarks — confirm with the listing agent.
Listing history 31 events
-
2026-05-08status Pending 613-char remark
Show marketing remark (613 chars)
MOTIVATED SELLER - PRICED TO SELL!!! DON'T MISS THE OPPORTUNITY * * Convenient central SW location near Chinatown, just minutes from the Strip. Perfect downstairs condo, newly renovated—ideal for investment or owner-occupancy. This 2-bedroom, 1-bath unit features wood-like flooring throughout, stylish two-tone custom paint, a modern kitchen with newly installed quartz countertops and stainless steel appliances next to a formal dining room. The front spacious living room is great for gathering and entertaining. Beautiful bathroom with tub and shower, plus a large laundry room offering ample storage.
-
2026-05-04price $129,000 613-char remark
Show marketing remark (613 chars)
MOTIVATED SELLER - PRICED TO SELL!!! DON'T MISS THE OPPORTUNITY * * Convenient central SW location near Chinatown, just minutes from the Strip. Perfect downstairs condo, newly renovated—ideal for investment or owner-occupancy. This 2-bedroom, 1-bath unit features wood-like flooring throughout, stylish two-tone custom paint, a modern kitchen with newly installed quartz countertops and stainless steel appliances next to a formal dining room. The front spacious living room is great for gathering and entertaining. Beautiful bathroom with tub and shower, plus a large laundry room offering ample storage.
-
2026-03-16$149,000 Active 613-char remark
Show marketing remark (613 chars)
MOTIVATED SELLER - PRICED TO SELL!!! DON'T MISS THE OPPORTUNITY * * Convenient central SW location near Chinatown, just minutes from the Strip. Perfect downstairs condo, newly renovated—ideal for investment or owner-occupancy. This 2-bedroom, 1-bath unit features wood-like flooring throughout, stylish two-tone custom paint, a modern kitchen with newly installed quartz countertops and stainless steel appliances next to a formal dining room. The front spacious living room is great for gathering and entertaining. Beautiful bathroom with tub and shower, plus a large laundry room offering ample storage.
-
2026-03-04historical
-
2026-01-14price $172,800
-
2025-09-23price $173,900
-
2025-08-14$178,900 Active
-
2025-08-11historical
-
2025-07-14$183,900 Active
-
2025-06-25historical
-
2025-01-08$179,000 Active
-
2024-11-30historical
-
2024-05-17$189,000 Active
-
2024-04-17historical
-
2023-12-14$193,000 Active
-
2023-12-13historical
-
2023-08-15$198,000 Active
-
2022-05-10soldstatus $168,000 Closed
-
2022-05-10soldstatus $168,000
-
2022-04-22status Pending
-
2022-04-18$165,000 Active
-
2018-09-19soldstatus $78,550 Sold
-
2018-09-19soldstatus $78,550
-
2018-09-18status Pending
-
2018-09-18status Active
-
2018-09-01status Pending
-
2018-08-28$74,900 Active
-
2012-10-15soldstatus $36,000
-
2005-01-03soldstatus $2,205,100
-
1988-06-09soldstatus $925,000
-
1984-11-20soldstatus $55,000
ⓘ Source: listings_history table (triggers on properties + properties_extension) + one-shot
backfill from property_details.listing_events for pre-trigger history.
Tax reassessment forecast NV · Resets to sale price
- Current annual tax
- $493 · $41/mo
- Projected year-2 tax
- $761 · $63/mo
- Expected delta
- +$268/yr (+$22/mo · 54.5%)
ⓘ Screening estimate from a state-policy table — verify with the county assessor before closing.
Climate risk First Street
- Flood 1/10 Low FEMA zone X (unshaded) · 0% chance over 30 yrs
- Wildfire 1/10 Low
- Heat 8/10 Severe 7 d/yr ≥106°F today · 18 d/yr by 30 yrs out
- Wind 1/10 Low
- Air quality 3/10 Moderate 2 unhealthy d/yr today · 3 by 30 yrs out
Nearby sold comps map
Loading sold comps map…
Walkable amenities ~0.75 mi
Loading nearby amenities…
Taxation est. · year 1
- Rental income
- $17,999
- − Mortgage interest
- −$7,226
- − Property taxes
- −$493
- − Insurance
- −$645
- − Repairs & maintenance
- −$1,440
- − Management
- −$1,440
- − HOA
- −$2,880
- − Depreciation
- −$3,753
- Taxable income
- $123
- Est. tax owed @ 24.0%
- −$29
- After-tax cash flow
- $2,054/yr
For passive investors: Depreciation is non-cash, so a rental often shows a tax loss while cash-flowing — sheltering income. Rental losses are passive: they offset passive income freely, and up to $25,000/yr can offset ordinary (W-2) income if you actively participate and your MAGI is under $100k (phasing out to $0 by $150k); unused losses carry forward. On sale, claimed depreciation is recaptured at up to 25%, and gains may owe capital-gains tax (a 1031 exchange can defer both). Figures are a year-1 estimate at your 24.0% rate — not tax advice; consult a CPA.
Schools (NCES district)
- District
- Clark County School District
- NCES district ID
- 3200060
- Math proficiency
- 21% ▼ -13.00%
- Reading proficiency
- 39% ▼ -8.00%
- Median HH income
- $53,611
- Composite
- 26.48/100
- National rank
- #7211
- State rank
- #11 of 17 in NV
Livability — Las Vegas
- Score
- 80/100
- State rank
- #2
- US rank
- #1723
Category grades
Schools grade is shown separately in the Schools card above.
Census & demographics
- Census place
- Las Vegas, NV
- County
- Clark County · 2,306,105 people
- City population
- 1,643,591
- Metro
- Las Vegas-Henderson-Paradise, NV
- Population (ZIP)
- 36,825
- Household income
- $49,843
- Rent vs Own
- Severe rent burden
- 3577.0
Population outlook (Clark County) Hauer SSP2
- Today (2025)
- 2,504,101 people
- By 2030
- 2,693,770 · +7.6%
- By 2040
- 3,061,208 · +22.2%
- By 2050
- 3,400,072 · +35.8%
- By 2075
- 4,139,522 · +65.3%
- By 2100
- 4,596,916 · +83.6%
Race, ethnicity, and origin ACS 2023
- Neighborhood character
- Diverse neighborhood (Simpson 0.69)
- Race & ethnicity
- Hispanic / Latino 48% White 24% Two or more races 21% Black 11% Asian 9% Native American 3%
- Hispanic origin (detail)
- Mexican 34% Cuban 3%
- Common ancestry
- Romanian 2% Scotch-Irish 1% Lithuanian 1%
- Foreign-born
- 31% · Canada, China, Vietnam
- Languages at home
- 53% English-only · Spanish 36% Tagalog/Filipino 3% Chinese 2%
Political lean MEDSL · Clark
- 2024 margin
- Toss-up / Even · D 50.4% · R 47.8% · Other 1.7%
- 2008→2024 swing
- -16.5pp toward R · 2008: 19.1pp · 2024: 2.6pp
- All cycles
- 2024: D+2.6 2020: D+9.3 2016: D+10.7 2012: D+14.5 2008: D+19.1
Not yet ingested
- Civics
- —
Market trends
- HPI YoY
- ▼ -244.81%
- Current HPI
- 260.2725
- Rent YoY
- ▼ -2.10%
- Metro
- Las Vegas-Henderson-Paradise, NV
- State GDP YoY
- ▲ 3.08%
- F500 in state
- 6
Industry mix (Fortune 500 HQ in NV)
| Industry | F500 HQs | Revenue |
|---|---|---|
| Hotels / Casinos | 3 | $36B |
|
||
Price history
+134.5% since first listed31 events — show timeline
- 2026-05-08 Pending — GLVAR
- 2026-05-04 Price Changed $129,000 GLVAR
- 2026-03-16 Listed $149,000 GLVAR
- 2026-03-04 Listing Removed — GLVAR
- 2026-01-14 Price Changed $172,800 GLVAR
- 2025-09-23 Price Changed $173,900 GLVAR
- 2025-08-14 Listed $178,900 GLVAR
- 2025-08-11 Listing Removed — GLVAR
- 2025-07-14 Listed $183,900 GLVAR
- 2025-06-25 Listing Removed — GLVAR
- 2025-01-08 Listed $179,000 GLVAR
- 2024-11-30 Listing Removed — GLVAR
- 2024-05-17 Listed $189,000 GLVAR
- 2024-04-17 Listing Removed — GLVAR
- 2023-12-14 Listed $193,000 GLVAR
- 2023-12-13 Listing Removed — GLVAR
- 2023-08-15 Listed $198,000 GLVAR
- 2022-05-10 Sold (Public Records) $168,000 Public Records
- 2022-05-10 Sold (MLS) $168,000 GLVAR
- 2022-04-22 Pending — GLVAR
- 2022-04-18 Listed $165,000 GLVAR
- 2018-09-19 Sold (Public Records) $78,550 Public Records
- 2018-09-19 Sold (MLS) $78,550 GLVAR
- 2018-09-18 Pending — GLVAR
- 2018-09-18 Relisted — GLVAR
- 2018-09-01 Pending — GLVAR
- 2018-08-28 Listed $74,900 GLVAR
- 2012-10-15 Sold (Public Records) $36,000 Public Records
- 2005-01-03 Sold (Public Records) $2,205,100 Public Records
- 1988-06-09 Sold (Public Records) $925,000 Public Records
- 1984-11-20 Sold (Public Records) $55,000 Public Records
Property tax history
-2.5%/yrLatest (2025): $493 · +7.4% YoY. Source: county tax records.
Cash-flow waterfall
monthlySold comps — $/sqft
last 12 mo · ≤1 miLoading sold comps…