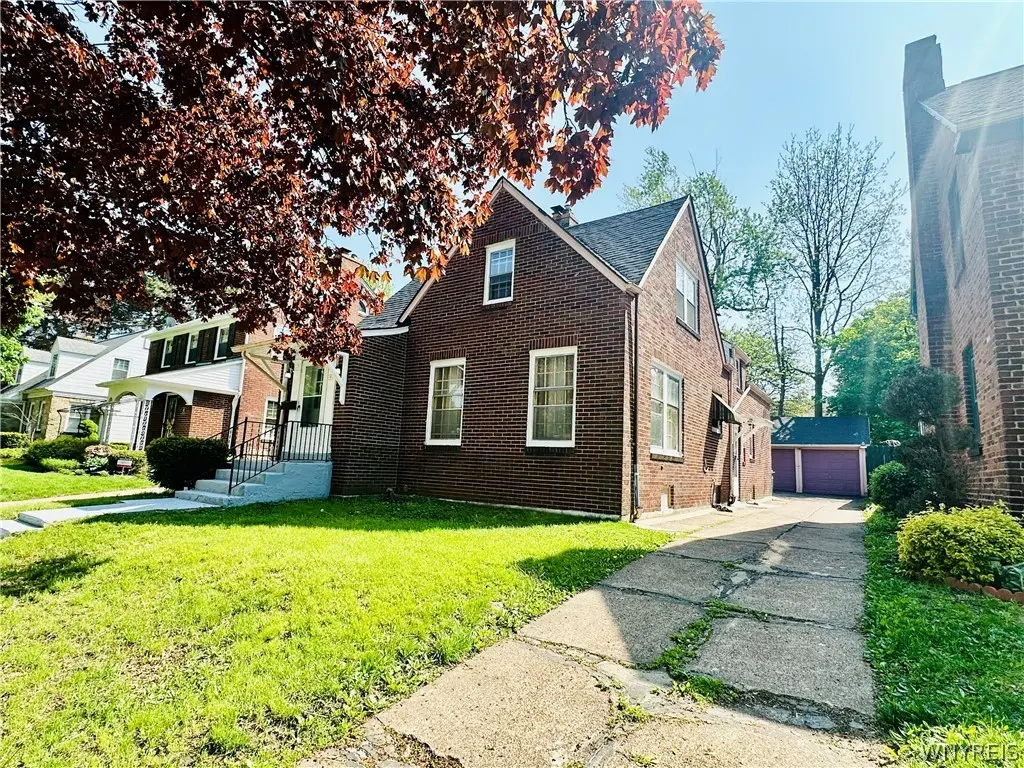
39 Benwood Ave · Buffalo, NY
Flood risk 1/10 · Minimal
- FEMA flood zone
- X (unshaded)
- Chance of flooding over 30 yrs
- 0.0%
- Est. flood insurance / yr
- $473 – $860
Fire risk 1/10 · Minimal
- Est. fire insurance / yr
- $691 – $1,283
Heat risk 3/10 · Minor
- Hot days now (above 93°F)
- 7 days/yr
- Hot days in 30 yrs
- 15 days/yr
Wind risk 1/10 · Minimal
- Chance of severe wind over 30 yrs
- —
Air-quality risk 3/10 · Minor
- Unhealthy air days now
- 2 days/yr
- Unhealthy air days in 30 yrs
- 3 days/yr
Risk factors via First Street. Map © Google.
Why this score? — see what drove the D+ grade
The composite is a weighted blend of 9 inputs, each scored 0–100. Each bar is that input's sub-score; the figure is the points it added to the 100-point composite (weight × sub-score).
- ARV discount +15.0/15.0
- Cash flow +14.2/30.0
- DSCR +4.3/10.0
- Rent growth +4.0/5.0
- Livability +3.9/5.0
- Schools +3.3/10.0
- 1% rule +2.6/10.0
- Condition / age +2.5/5.0
- Appreciation +0.0/10.0
$344,900
🖨 Deal sheet (PDF) 📄 Offer letter ✓ Due diligence
Listing remarks
“Discover this beautiful updated ready to move single family home with 5 bedroom, 2 bathroom along with 1 bonus store room on upstairs. It’s close to Main Street, Clinic, Metro Station and in between two university campus. The entire property was remodeled, renovated and you will feel the ambient touch of that. The kitchen remodeled two years back. both the bathroom remodeled and updated along with new roof of last year. Seller will give refrigerator, microwave, stove, and two storage deep fridge in the basement. The place is very calm and quiet. The location and exquisite interiors design make you feel at home with comfort, peace and tranquility. It’s a good investment to
Key facts
- Bonus store room
- Remodeled kitchen
- New roof
Tags
Property features AI
Exterior
- Parking: Attached garage; Second (additional) garage; 2 garage spaces
- Utilities: Public water connected; Sewer connected
- Home design: 2-story property; Resale condition
- Construction: Brick, block and concrete construction; Block foundation; Existing (previously built) structure
- Exterior features: Concrete driveway; Rectangular residential lot; City street frontage
Interior
- Kitchen: Gas oven; Gas range; Refrigerator
- Bedrooms: 2 main-level bedrooms
- Flooring: Carpet; Vinyl; Varied flooring
- Bathrooms: 2 full bathrooms total; 1 bathroom on the main level
- Heating & cooling: Gas forced-air heating
- Interior features: Eat-in kitchen; Full basement
- Laundry & utility: Laundry in basement; Gas water heater
Neighborhood map
What this means for you Summary
Snapshot
- This is a 5-bed/2.0-bath single-family listed at $345k.
Deal economics
- At list price, monthly cash flow is $54 ($652/yr) — positive.
- The deal already cash-flows at list — no discount required.
- To meet the 1% rule (rent ≥ 1% of price), the offer needs to be $262k (24.1% below list).
- Recommended offer: $262k (24.1% below list) — sets the bar for 1% rule.
Location & tenants
- Location reads 77/100 on livability (#195 in NY, #3,011 nationally) — a middle-class / working-renter tenant base. Strengths: commute A+, housing A+, health & safety A+; Watch: crime F, employment D-.
- Buffalo City School District (urban): math 41% / reading 40% proficiency, ranked #535 of 590 in NY (top 91%) — families likely to look elsewhere, expect single-tenant / working-renter base with shorter leases; 75% free/reduced lunch — lower-income household profile, screen leases tightly.
- Zoned schools: International School (math 8% / reading 17%, grade F, #2,048 of 2,108 statewide, top 97%, 981 students, 92% FRL); Hutchinson Central Technical High School (math 96% / reading 32%, grade B-, #807 of 1,100 statewide, top 73%, 1,175 students, 78% FRL).
- Market conditions: Rents rising fast (+5.8%/yr); 92 active listings in the ZIP; 11 comparable units currently listed for rent nearby; rentals leasing fast (median 4d on market — plan ~1-2 weeks tenant-placement turnaround); 1,244 units permitted in Erie County in 2024 (563 in 5+ unit buildings).
- At $2,618/mo this rent would consume 54% of the median local household income ($58k/yr) (locally 1820% of renters already pay >50% of income on rent) — very limited rent-growth headroom before tenants either downsize or default.
Forward outlook
- Local home prices are declining (-3.0%/yr); year-one equity from $2k of loan paydown is wiped out by about $10k of value loss. Plan a longer hold.
Negotiation context
- It's been on market 32 days — a 3% lower offer ($335k) is reasonable based on typical stale-listing flexibility.
- Current owner paid $78k; list at $345k implies a 340% gain — meaningful room to come down on a strong offer.
Risks & watch-outs
- Watch-outs: built in 1937 — expect roof / HVAC / electrical / plumbing capex.
Questions for the listing agent
- It's been on market 32 days. Have you received any prior offers? Is the seller open to a 24% concession, seller financing, or rate buy-down credit?
- Built in 1937 — when were the roof, HVAC, electrical panel, plumbing, and water heater last replaced?
- Is there a deadline driving the sale (1031 exchange, divorce, estate, relocation)? That informs how much negotiation room exists.
- Crime grade is F in this area — have there been break-ins, vandalism, or insurance claims at this property in the last 3 years? What carrier currently insures it and at what premium?
- The area grade is low — what's the realistic commute time and amenity access for the typical tenant pool here? Any planned neighborhood developments (good or bad) we should know about?
- What's the average days-on-market for RENTAL listings here right now (not sales)? A rising rental-DOM trend means longer vacancies and softer asking-rent achievability than the comps imply.
- What's the recent tenant-quality profile in this submarket — average credit score on applications, eviction rate, late-payment / NSF rate, and stable-employment percentage? A property-management company in the area should have these aggregated.
- How much new for-sale + rental construction is in the pipeline within 1–3 miles? Heavy new supply typically softens prices + rents 12–24 months out; constrained supply supports both.
Investment metrics
- 1% rule
- 0.76% ✗
- Cap rate
- 6.48%
- Cash-on-cash
- 0.68%
- DSCR
- 1.03
- GRM
- 11.0
CMA / ARV
- ARV (on-the-fly)
- $433,257
- Comps found
- 12
Show comp detail 12 sales within ~0.75 mi
| Address | Dist | Beds/Ba | Sqft | Sold | Price | $/sf | Match |
|---|---|---|---|---|---|---|---|
| 161 Beard Ave | 0.19mi | 4/2.0 (-1) | 2,272 (+10%) | 10mo | $545,000 | $240 | 62 |
| 66 E Morris Ave Unit N | 0.04mi | 4/2.0 (-1) | 2,354 (+14%) | 15mo | $333,000 | $141 | 58 |
| 110 Beard Ave | 0.27mi | 4/2.0 (-1) | 2,170 (+5%) | 22mo | $651,000 | $300 | 56 |
| 1714 Amherst St | 0.33mi | 4/1.5 (-1) | 1,981 (-4%) | 20mo | $347,000 | $175 | 54 |
| 305 Voorhees | 0.62mi | 4/2.0 (-1) | 2,077 (+0%) | 18mo | $460,000 | $221 | 51 |
| 39 Winston Rd | 0.57mi | 4/1.5 (-1) | 1,877 (-10%) | 1mo | $461,000 | $246 | 50 |
| 106 Winston Rd | 0.69mi | 4/1.5 (-1) | 1,934 (-7%) | 3mo | $450,000 | $233 | 47 |
| 377 Huntington Ave | 0.69mi | 4/1.5 (-1) | 2,154 (+4%) | 22mo | $277,000 | $129 | 36 |
| 104 Fairfield St | 0.46mi | 4/1.5 (-1) | 2,353 (+14%) | 19mo | $350,000 | $149 | 33 |
| 298 Jewett Ave | 0.54mi | 4/1.0 (-1) | 1,765 (-15%) | 11mo | $85,000 | $48 | 32 |
| 425 Parker Ave | 0.69mi | 4/1.5 (-1) | 2,311 (+12%) | 19mo | $350,000 | $151 | 26 |
| 111 Winston Rd | 0.69mi | 4/1.5 (-1) | 1,803 (-13%) | 19mo | $377,500 | $209 | 23 |
Match score weights: distance 35% · size 25% · config 20% · recency 20%. Top-matched comps best support the ARV.
Projected returns pro-forma
-3.0% appreciation · 5.81% rent growth · sell at horizon
- IRR
- -12.6%
- Equity multiple
- 0.53×
- Total profit
- $-45,006
- Equity at exit
- $51,426
- IRR
- -0.3%
- Equity multiple
- 0.98×
- Total profit
- $-2,414
- Equity at exit
- $29,821
Cash invested: $96,572 (down + closing). Projections, not guarantees.
Landlord ↔ Tenant lean methodology
- Overall (STATE)
- 15 Strongly Tenant-Friendly
- State New York
- 15 Strongly Tenant-Friendly · D+10
- County
- — inherits STATE
- City
- — inherits STATE
ZIP-level market 14214
- Rents YoY
- 5.8%
- Active inventory
- 92
- Price-to-rent
- 11.0×
Monthly cashflow live
- Estimated rent
- $2,618 high interval (Pro) →
- Mortgage (P&I)
- −$1,809
- Tax from tax record
- −$62 /mo · $740/yr
- Insurance
- −$144
- HOA
- −$0
- Vacancy / Maint / Mgmt
- −$550
- Net cashflow
- $54
Break-even live
Sensitivity live
| Price | -10% $250 | -5% $152 | +0% $54 | +5% $-43 | +10% $-554 |
|---|---|---|---|---|---|
| Rent | -10% $-153 | -5% $-49 | +0% $54 | +5% $158 | +10% $261 |
| Rate | -1.0pp $228 | -0.5pp $142 | base $54 | +0.5pp $-35 | +1.0pp $-126 |
UW: 25.0% down · 7.5% · 30yr · 1.5% tax · 5.0% vac · 8.0% maint · 8.0% mgmt
Financing live
Cash to close
- Down payment
- $86,225
- Closing costs
- $10,347
- Reserves months
- —
- Total cash needed
- —
Loan-product check · same deal, 3 products live
Conventional
25% down · 7.5% · 30yr
- Down + closing
- —
- Monthly P&I
- —
- Monthly cashflow
- —
- DSCR
- —
- Eligible?
- —
Personal DTI + credit; lowest rate.
DSCR
20% down · 8.5% · 30yr
- Down + closing
- —
- Monthly P&I
- —
- Monthly cashflow
- —
- DSCR
- —
- Eligible?
- —
No personal income docs; deal must DSCR.
Hard money
10% down · 12.0% · 12mo
- Down + closing
- —
- Monthly P&I
- —
- Monthly cashflow
- —
- DSCR
- —
- Eligible?
- —
Short-term bridge; refi at stabilization.
Rent comps 11 comps
| Address | Beds | Baths | Sqft | Rent | $/sqft | DOM | Units | Dist |
|---|---|---|---|---|---|---|---|---|
| 89 Lasalle Ave Buffalo, NY | 1.0–4.0 | 1.0–4.0 | 1024 | $2,997 | $2.93 | 3d | 10 | 0.39mi |
| 24 Custer St Buffalo, NY | 5.0 | 2.0 | 2500 | $3,000 | $1.20 | 16d | 1 | 0.63mi |
| 85 Highgate Ave Buffalo, NY | 5.0 | 2.0 | 2193 | $3,750 | $1.71 | 16d | 1 | 0.67mi |
| 175 Lisbon Ave Buffalo, NY | 5.0 | 2.0 | 2000 | $2,500 | $1.25 | 16d | 1 | 0.71mi |
| 65 Northrup Pl Buffalo, NY | 5.0 | 2.0 | 1467 | $2,500 | $1.70 | 16d | 1 | 0.73mi |
| 60 Englewood Ave Buffalo, NY | 4.0 | 1.0 | 1400 | $1,650 | $1.18 | 3d | 1 | 0.91mi |
| 102 Englewood Ave Buffalo, NY | 4.0 | 1.0 | 2426 | $2,750 | $1.13 | 3d | 1 | 0.92mi |
| 91 Englewood Ave Buffalo, NY | 4.0 | 1.0 | 2500 | $2,000 | $0.80 | 3d | 1 | 0.95mi |
| 196 Englewood Ave Buffalo, NY | 5.0 | 1.5 | 2560 | $2,000 | $0.78 | 3d | 1 | 0.97mi |
| 63 Montrose Ave Buffalo, NY | 4.0 | 1.0 | 2240 | $2,000 | $0.89 | 3d | 1 | 1.03mi |
| 80 Capen Blvd Buffalo, NY | 5.0 | 2.5 | 2591 | $2,800 | $1.08 | 3d | 1 | 1.31mi |
Listing history 18 events
-
2026-06-21days on market $344,900 Active 32 DOM
-
2026-06-18days on market $344,900 Active 29 DOM
-
2026-06-17days on market $344,900 Active 28 DOM
-
2026-06-16days on market $344,900 Active 27 DOM
-
2026-06-15days on market $344,900 Active 26 DOM
-
2026-06-13days on market $344,900 Active 24 DOM
-
2026-06-13pricedays on market $344,900 Active 23 DOM
-
2026-06-10days on market $350,000 Active 21 DOM
-
2026-06-09days on market $350,000 Active 20 DOM
-
2026-06-08days on market $350,000 Active 19 DOM
-
2026-06-07days on market $350,000 Active 18 DOM
-
2026-06-03days on market $350,000 Active 14 DOM
-
2026-06-02days on market $350,000 Active 13 DOM
-
2026-06-01days on market $350,000 Active 12 DOM
-
2026-05-31days on market $350,000 Active 11 DOM
-
2026-05-20$350,000 Active
-
2008-07-07soldstatus $78,400
-
2003-12-29soldstatus $95,400
ⓘ Source: listings_history table (triggers on properties + properties_extension) + one-shot
backfill from property_details.listing_events for pre-trigger history.
Tax reassessment forecast NY · Partial reset (capped growth)
- Current annual tax
- $740 · $62/mo
- Projected year-2 tax
- $3,284 · $274/mo
- Expected delta
- +$2,544/yr (+$212/mo · 343.9%)
ⓘ Screening estimate from a state-policy table — verify with the county assessor before closing.
Climate risk First Street
- Flood 1/10 Low FEMA zone X (unshaded) · 0% chance over 30 yrs
- Wildfire 1/10 Low
- Heat 3/10 Moderate 7 d/yr ≥93°F today · 15 d/yr by 30 yrs out
- Wind 1/10 Low
- Air quality 3/10 Moderate 2 unhealthy d/yr today · 3 by 30 yrs out
Nearby sold comps map
Loading sold comps map…
Walkable amenities ~0.75 mi
Loading nearby amenities…
Taxation est. · year 1
- Rental income
- $31,418
- − Mortgage interest
- −$19,320
- − Property taxes
- −$740
- − Insurance
- −$1,724
- − Repairs & maintenance
- −$2,513
- − Management
- −$2,513
- − Depreciation
- −$10,033
- Taxable loss
- −$5,426
- Est. tax savings @ 24.0%
- +$1,302
- After-tax cash flow
- $1,954/yr
For passive investors: Depreciation is non-cash, so a rental often shows a tax loss while cash-flowing — sheltering income. Rental losses are passive: they offset passive income freely, and up to $25,000/yr can offset ordinary (W-2) income if you actively participate and your MAGI is under $100k (phasing out to $0 by $150k); unused losses carry forward. On sale, claimed depreciation is recaptured at up to 25%, and gains may owe capital-gains tax (a 1031 exchange can defer both). Figures are a year-1 estimate at your 24.0% rate — not tax advice; consult a CPA.
Schools (NCES district)
- District
- Buffalo City School District
- NCES district ID
- 3605850
- Math proficiency
- 41% ▲ 11.00%
- Reading proficiency
- 40% ▲ 7.00%
- Median HH income
- $31,665
- Composite
- 33.17/100
- National rank
- #5544
- State rank
- #535 of 590 in NY
Livability — Buffalo
- Score
- 77/100
- State rank
- #195
- US rank
- #3011
Category grades
Schools grade is shown separately in the Schools card above.
Census & demographics
- Census place
- Buffalo, NY
- County
- Erie County · 714,559 people
- City population
- 440,021
- Metro
- Buffalo-Cheektowaga, NY
- Population (ZIP)
- 21,314
- Household income
- $58,228
- Rent vs Own
- Severe rent burden
- 1820.0
Population outlook (Erie County) Hauer SSP2
- Today (2025)
- 933,037 people
- By 2030
- 935,181 · +0.2%
- By 2040
- 928,531 · -0.5%
- By 2050
- 905,725 · -2.9%
- By 2075
- 834,037 · -10.6%
- By 2100
- 708,033 · -24.1%
Race, ethnicity, and origin ACS 2023
- Neighborhood character
- Diverse neighborhood (Simpson 0.67)
- Race & ethnicity
- White 47% Black 31% Asian 11% Hispanic / Latino 7% Two or more races 6%
- Hispanic origin (detail)
- Puerto Rican 3%
- Common ancestry
- Romanian 5% Lithuanian 2% Scotch-Irish 1%
- Foreign-born
- 14% · Canada, China
- Languages at home
- 81% English-only · Other Indo-European 7% Spanish 4% Other Asian/Pacific 1%
Political lean MEDSL · Erie
- 2024 margin
- Lean D (+9.7) · D 54.8% · R 45.2%
- 2008→2024 swing
- -7.9pp toward R · 2008: 17.5pp · 2024: 9.7pp
- All cycles
- 2024: D+9.7 2020: D+14.7 2016: D+4.8 2012: D+15.6 2008: D+17.5
Not yet ingested
- Civics
- —
Market trends
- HPI YoY
- ▼ -282.52%
- Current HPI
- 373.377
- Rent YoY
- ▲ 5.81%
- Metro
- Buffalo-Cheektowaga, NY
- State GDP YoY
- ▲ 2.60%
- F500 in state
- 92
Industry mix (Fortune 500 HQ in NY)
| Industry | F500 HQs | Revenue |
|---|---|---|
| Financial Services | 10 | $950B |
|
||
| Consumer Goods | 9 | $162B |
|
||
| Insurance | 4 | $225B |
|
||
| Telecommunications | 2 | $144B |
|
||
| Pharmaceuticals | 2 | $112B |
|
||
| Media / Entertainment | 2 | $69B |
|
||
Price history
+266.9% since first listed3 events — show timeline
- 2026-05-20 Listed $350,000 WNYREIS
- 2008-07-07 Sold (Public Records) $78,400 Public Records
- 2003-12-29 Sold (Public Records) $95,400 Public Records
Property tax history
+3.9%/yrLatest (2025): $740 · +0.0% YoY. Source: county tax records.
Cash-flow waterfall
monthlySold comps — $/sqft
last 12 mo · ≤1 miLoading sold comps…