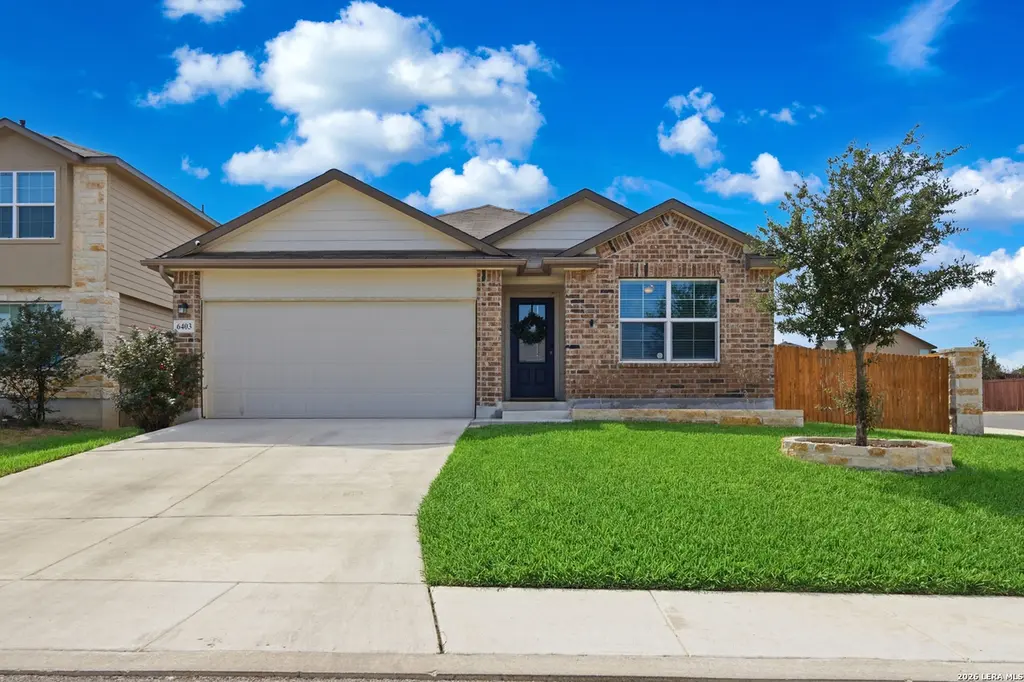
6403 Encore Oaks · San Antonio, TX
Flood risk 1/10 · Minimal
- FEMA flood zone
- X (unshaded)
- Chance of flooding over 30 yrs
- 0.0%
- Est. flood insurance / yr
- $507 – $1,088
Fire risk 5/10 · Moderate
- Est. fire insurance / yr
- $1,222 – $2,270
Heat risk 8/10 · Major
- Hot days now (above 109°F)
- 7 days/yr
- Hot days in 30 yrs
- 23 days/yr
Wind risk 8/10 · Major
- Chance of severe wind over 30 yrs
- 80.0%
Air-quality risk 2/10 · Minimal
- Unhealthy air days now
- 0 days/yr
- Unhealthy air days in 30 yrs
- 1 days/yr
Risk factors via First Street. Map © Google.
Why this score? — see what drove the D- grade
The composite is a weighted blend of 9 inputs, each scored 0–100. Each bar is that input's sub-score; the figure is the points it added to the 100-point composite (weight × sub-score).
- ARV discount +10.1/15.0
- Cash flow +7.4/30.0
- Appreciation +5.0/10.0
- Schools +4.4/10.0
- Livability +4.0/5.0
- Condition / age +2.5/5.0
- Rent growth +2.1/5.0
- 1% rule +2.0/10.0
- DSCR +1.5/10.0
$275,000
🖨 Deal sheet (PDF) 📄 Offer letter ✓ Due diligence
Listing remarks MLS
Welcome to this well-maintained single-story home situated on a desirable corner lot. Offering 1,703 square feet, this 4-bedroom, 2-bathroom home features a functional open-concept layout ideal for everyday living and entertaining. The spacious eat-in kitchen includes granite countertops, a large island, ample cabinet storage, and a generously sized pantry. The open floor plan provides a seamless flow between the kitchen, dining, and living areas. The oversized backyard offers plenty of space for outdoor living, entertaining, or future improvements, and includes a storage shed for additional storage. The 2-car garage features epoxy-coated floors, providing a clean and finished look. Additional highlights include: corner lot, open floor plan, oversized yard, granite countertops, pantry, and move-in ready condition.
Key facts
- 8,712 sq ft lot
- 2 garage spots
- Community pool
Neighborhood map
What this means for you Summary
Snapshot
- This is a 4-bed/2.0-bath single-family listed at $275k.
Deal economics
- At list price, monthly cash flow is $-353 ($-4k/yr) — negative.
- To cash-flow at today's rent, offer at most $213k (22.7% below list).
- To meet the 1% rule (rent ≥ 1% of price), the offer needs to be $193k (29.9% below list).
- Recommended offer: $193k (29.9% below list) — sets the bar for 1% rule.
- Cap rate 4.8% vs local median 3.8% in San Antonio — meaningfully above typical; check what's discounted (condition, days-on-market, listing class) to confirm the premium yield is real.
Location & tenants
- Location reads 80/100 on livability (#31 in TX, #1,616 nationally) — a professional / high-income tenant draw. Strengths: amenities A+, commute A+, cost of living A+; Watch: schools C-, crime F.
- Medina Valley ISD (rural): math 48% / reading 53% proficiency, ranked #148 of 826 in TX (top 18%) — acceptable for families but not a draw, mixed tenant base, ~2y average lease.
- Market conditions: Rents soft (-1.7%/yr); 558 active listings in the ZIP; 40 comparable units currently listed for rent nearby; rentals at typical pace (median 25d on market — plan ~3-4 weeks tenant-placement turnaround); solid renter incomes; 8,308 units permitted in Bexar County in 2024 (2,506 in 5+ unit buildings).
Forward outlook
- In year one you build about $2k of equity ($2k loan paydown + $-5 appreciation (-0.0% local appreciation)).
- Bexar County population projected at +50% by 2050 — long-run rental-demand tailwind backs the buy-and-hold thesis.
Negotiation context
- It's been on market 40 days — a 3% lower offer ($267k) is reasonable based on typical stale-listing flexibility.
Risks & watch-outs
- Climate carrying-cost: severe wind risk, 80% chance of damaging wind over 30y; moderate wildfire risk; extreme-heat days projected 7→23/yr by 2055 (HVAC capex compounding) — expect insurance premiums to compound above CPI over the hold.
Questions for the listing agent
- What do current leases actually rent for vs. the listed asking? Can we see a recent rent roll and the last 12 months of T-12 income?
- It's been on market 40 days. Have you received any prior offers? Is the seller open to a 30% concession, seller financing, or rate buy-down credit?
- What does the HOA fee cover, when was the last increase, and are there any pending special assessments or reserve-fund shortfalls?
- Is there a deadline driving the sale (1031 exchange, divorce, estate, relocation)? That informs how much negotiation room exists.
- Crime grade is F in this area — have there been break-ins, vandalism, or insurance claims at this property in the last 3 years? What carrier currently insures it and at what premium?
- The area grade is low — what's the realistic commute time and amenity access for the typical tenant pool here? Any planned neighborhood developments (good or bad) we should know about?
- What's the average days-on-market for RENTAL listings here right now (not sales)? A rising rental-DOM trend means longer vacancies and softer asking-rent achievability than the comps imply.
- What's the recent tenant-quality profile in this submarket — average credit score on applications, eviction rate, late-payment / NSF rate, and stable-employment percentage? A property-management company in the area should have these aggregated.
- How much new for-sale + rental construction is in the pipeline within 1–3 miles? Heavy new supply typically softens prices + rents 12–24 months out; constrained supply supports both.
Investment metrics
- 1% rule
- 0.70% ✗
- Cap rate
- 4.75%
- Cash-on-cash
- -5.51%
- DSCR
- 0.75
- GRM
- 11.9
CMA / ARV
- ARV (median comp)
- $291,609
- List price
- $275,000
- Delta
- -5.70%
- Verdict
- FAIR
- Comps
- 20 within 1.0 mi
Show comp detail 12 sales within ~0.75 mi
| Address | Dist | Beds/Ba | Sqft | Sold | Price | $/sf | Match |
|---|---|---|---|---|---|---|---|
| 6403 Encore Oaks | 0.00mi | 4/2.0 | 1,703 (0%) | 1mo | $275,000 | $161 | 99 |
| 13007 Minuet Sway | 0.29mi | 4/2.0 | 1,703 (0%) | 1mo | $285,500 | $168 | 85 |
| 6429 Hoffman Pln | 0.07mi | 3/2.0 (-1) | 1,662 (-2%) | 3mo | $289,900 | $174 | 85 |
| 6824 Kingsley Edge | 0.35mi | 4/2.0 | 1,703 (0%) | 6mo | $275,000 | $161 | 78 |
| 6419 Tempo Switch | 0.23mi | 3/2.5 (-1) | 1,631 (-4%) | 2mo | $244,900 | $150 | 74 |
| 6551 Legato | 0.28mi | 4/2.5 | 1,839 (+8%) | 2mo | $249,900 | $136 | 70 |
| 13032 Minuet Sway | 0.30mi | 3/2.0 (-1) | 1,662 (-2%) | 9mo | $283,999 | $171 | 70 |
| 6602 Kingsley Edge | 0.19mi | 4/2.0 | 1,906 (+12%) | 9mo | $275,000 | $144 | 64 |
| 13516 Waxman Spark | 0.44mi | 4/2.5 | 1,866 (+10%) | 1mo | $214,000 | $115 | 61 |
| 6545 Legato Curv | 0.27mi | 4/2.5 | 1,919 (+13%) | 6mo | $250,000 | $130 | 59 |
| 13419 Homestead | 0.73mi | 4/2.0 | 1,616 (-5%) | 4mo | $289,900 | $179 | 54 |
| 6910 Pail Pl | 0.75mi | 3/2.0 (-1) | 1,700 (-0%) | 10mo | $268,000 | $158 | 52 |
Match score weights: distance 35% · size 25% · config 20% · recency 20%. Top-matched comps best support the ARV.
Projected returns pro-forma
-0.0% appreciation · 0.0% rent growth · sell at horizon
- IRR
- -10.3%
- Equity multiple
- 0.53×
- Total profit
- $-36,214
- Equity at exit
- $79,827
- IRR
- -6.0%
- Equity multiple
- 0.40×
- Total profit
- $-46,246
- Equity at exit
- $95,936
Cash invested: $77,000 (down + closing). Projections, not guarantees.
Landlord ↔ Tenant lean methodology
- Overall (STATE)
- 87 Strongly Landlord-Friendly
- State Texas
- 87 Strongly Landlord-Friendly · R+5
- County
- — inherits STATE
- City
- — inherits STATE
ZIP-level market 78252
- Home prices YoY
- -0.0%
- Rents YoY
- -1.7%
- Active inventory
- 558
- Price-to-rent
- 11.9×
Monthly cashflow live
- Estimated rent
- $1,928 high interval (Pro) →
- Mortgage (P&I)
- −$1,442
- Tax from tax record
- −$195 /mo · $2,337/yr
- Insurance
- −$115
- HOA
- −$125
- Vacancy / Maint / Mgmt
- −$405
- Net cashflow
- $-353
Break-even live
Sensitivity live
| Price | -10% $-198 | -5% $-276 | +0% $-353 | +5% $-431 | +10% $-509 |
|---|---|---|---|---|---|
| Rent | -10% $-506 | -5% $-430 | +0% $-353 | +5% $-277 | +10% $-201 |
| Rate | -1.0pp $-215 | -0.5pp $-283 | base $-353 | +0.5pp $-425 | +1.0pp $-497 |
UW: 25.0% down · 7.5% · 30yr · 1.5% tax · 5.0% vac · 8.0% maint · 8.0% mgmt
Financing live
Cash to close
- Down payment
- $68,750
- Closing costs
- $8,250
- Reserves months
- —
- Total cash needed
- —
Loan-product check · same deal, 3 products live
Conventional
25% down · 7.5% · 30yr
- Down + closing
- —
- Monthly P&I
- —
- Monthly cashflow
- —
- DSCR
- —
- Eligible?
- —
Personal DTI + credit; lowest rate.
DSCR
20% down · 8.5% · 30yr
- Down + closing
- —
- Monthly P&I
- —
- Monthly cashflow
- —
- DSCR
- —
- Eligible?
- —
No personal income docs; deal must DSCR.
Hard money
10% down · 12.0% · 12mo
- Down + closing
- —
- Monthly P&I
- —
- Monthly cashflow
- —
- DSCR
- —
- Eligible?
- —
Short-term bridge; refi at stabilization.
Rent comps 40 comps
| Address | Beds | Baths | Sqft | Rent | $/sqft | DOM | Units | Dist |
|---|---|---|---|---|---|---|---|---|
| 6436 Kingsley Edge San Antonio, TX | 4.0 | 2.0 | 1703 | $1,800 | $1.06 | 45d | 1 | 0.18mi |
| 6518 Hoffman Pln San Antonio, TX | 3.0 | 2.5 | 2237 | $1,795 | $0.80 | 25d | 1 | 0.18mi |
| 6518 Hoffman Pln San Antonio, TX | 3.0 | 2.5 | 2237 | $1,795 | $0.80 | 19d | 1 | 0.18mi |
| 6441 Staccato Staff San Antonio, TX | 4.0 | 2.0 | 1906 | $1,950 | $1.02 | 5d | 1 | 0.19mi |
| 6621 Kingsley Edge San Antonio, TX | 4.0 | 2.0 | 1906 | $1,850 | $0.97 | 45d | 1 | 0.20mi |
| 6519 Dynamic Sound San Antonio, TX | 3.0 | 2.0 | 1156 | $1,700 | $1.47 | 0d | 1 | 0.23mi |
| 6519 Dynamic Sound San Antonio, TX | 3.0 | 2.0 | 1156 | $1,700 | $1.47 | 25d | 1 | 0.23mi |
| 6528 Dynamic Sound San Antonio, TX | 3.0 | 2.0 | 1192 | $1,475 | $1.24 | 16d | 1 | 0.24mi |
| 6548 Dynamic Sound San Antonio, TX | 3.0 | 2.0 | 1323 | $1,495 | $1.13 | 25d | 1 | 0.28mi |
| 6638 Hoffman Pln San Antonio, TX | 3.0 | 2.0 | 1662 | $1,850 | $1.11 | 25d | 1 | 0.31mi |
| 6614 Dynamic Sound San Antonio, TX | 3.0 | 2.0 | 1192 | $1,500 | $1.26 | 45d | 1 | 0.33mi |
| 6614 Dynamic Sound San Antonio, TX | 3.0 | 2.0 | 1192 | $1,500 | $1.26 | 5d | 1 | 0.33mi |
| 13107 Minuet Sway San Antonio, TX | 4.0 | 2.0 | 1703 | $1,800 | $1.06 | 12d | 1 | 0.36mi |
| 13067 Whisper Bnd San Antonio, TX | 3.0 | 2.0 | 1442 | $1,750 | $1.21 | 25d | 1 | 0.37mi |
| 6304 Masterson Rd Unit 3294 San Antonio, TX | 3.0 | 2.0 | 1463 | $2,201 | $1.50 | 0d | 1 | 0.37mi |
| 13123 Minuet Sway San Antonio, TX | 3.0 | 2.5 | 2241 | $2,050 | $0.91 | 45d | 1 | 0.40mi |
| 13080 Whisper Bnd San Antonio, TX | 4.0 | 2.0 | 1703 | $1,850 | $1.09 | 45d | 1 | 0.41mi |
| 13080 Whisper Bnd San Antonio, TX | 4.0 | 2.0 | 1703 | $1,850 | $1.09 | 25d | 1 | 0.41mi |
| 13518 Hummel Loop San Antonio, TX | 3.0 | 2.5 | 1625 | $1,650 | $1.02 | 0d | 1 | 0.43mi |
| 6522 Vivaldi Isle San Antonio, TX | 3.0 | 2.0 | 1325 | $1,500 | $1.13 | 45d | 1 | 0.44mi |
| 6830 Whisper Grv San Antonio, TX | 4.0 | 2.0 | 1901 | $1,900 | $1.00 | 5d | 1 | 0.44mi |
| 6830 Whisper Grv San Antonio, TX | 4.0 | 2.0 | 1884 | $1,900 | $1.01 | 17d | 1 | 0.44mi |
| 6023 Macdona Rdg San Antonio, TX | 4.0 | 2.0 | 1474 | $1,695 | $1.15 | 45d | 1 | 0.45mi |
| 13310 Whisper Bnd San Antonio, TX | 4.0 | 2.0 | 1900 | $1,795 | $0.94 | 23d | 1 | 0.46mi |
| 12906 Olson Pt San Antonio, TX | 3.0 | 2.0 | 1554 | $1,780 | $1.15 | 19d | 1 | 0.47mi |
| 13422 Whisper Bnd San Antonio, TX | 3.0 | 2.0 | 1662 | $2,000 | $1.20 | 25d | 1 | 0.48mi |
| 6835 Capriccio Spirit San Antonio, TX | 3.0 | 2.5 | 1512 | $1,700 | $1.12 | 23d | 1 | 0.53mi |
| 6623 Whisper Pond San Antonio, TX | 4.0 | 2.5 | 2243 | $1,950 | $0.87 | 19d | 1 | 0.53mi |
| 5565 Mansions Blfs San Antonio, TX | 1.0–4.0 | 1.0–3.0 | 1326 | $2,440 | $1.84 | 0d | 39 | 0.65mi |
| 6515 Scarecrow Way San Antonio, TX | 4.0 | 2.0 | 1627 | $1,565 | $0.96 | 25d | 1 | 0.73mi |
| 6512 Arid Way San Antonio, TX | 4.0 | 2.0 | 1687 | $1,671 | $0.99 | 25d | 1 | 0.74mi |
| 13727 Barn Door San Antonio, TX | 3.0 | 2.0 | 1474 | $1,800 | $1.22 | 25d | 1 | 0.74mi |
| 6524 Arid Way San Antonio, TX | 4.0 | 2.0 | 1657 | $1,556 | $0.94 | 25d | 1 | 0.76mi |
| 6511 Arid Way San Antonio, TX | 4.0 | 2.5 | 1687 | $1,650 | $0.98 | 0d | 1 | 0.76mi |
| 6612 Arid Way San Antonio, TX | 4.0 | 2.0 | 1627 | $1,895 | $1.16 | 0d | 1 | 0.80mi |
| 6603 Arid Way San Antonio, TX | 3.0 | 2.0 | 1440 | $1,506 | $1.05 | 45d | 1 | 0.81mi |
| 5525 Mansions Blfs San Antonio, TX | 3.0 | 1.0–2.0 | 869 | $1,613 | $1.86 | 3d | 48 | 0.81mi |
| 6743 Arid Way San Antonio, TX | 3.0 | 2.0 | 1910 | $1,921 | $1.01 | 45d | 1 | 0.84mi |
| 6638 Arid Way San Antonio, TX | 4.0 | 2.0 | 1627 | $1,479 | $0.91 | 5d | 1 | 0.84mi |
| 6683 Arid Way San Antonio, TX | 3.0 | 2.0 | 1440 | $1,475 | $1.02 | 0d | 1 | 0.88mi |
HOA detail
- Monthly dues
- $125 · $1,500/yr
Listing history 2 events
-
2026-05-04historical Active Option 834-char remark
Show marketing remark (834 chars)
Welcome to this well-maintained single-story home situated on a desirable corner lot. Offering 1,703 square feet, this 4-bedroom, 2-bathroom home features a functional open-concept layout ideal for everyday living and entertaining. The spacious eat-in kitchen includes granite countertops, a large island, ample cabinet storage, and a generously sized pantry. The open floor plan provides a seamless flow between the kitchen, dining, and living areas. The oversized backyard offers plenty of space for outdoor living, entertaining, or future improvements, and includes a storage shed for additional storage. The 2-car garage features epoxy-coated floors, providing a clean and finished look. Additional highlights include: corner lot, open floor plan, oversized yard, granite countertops, pantry, and move-in ready condition.
-
2026-04-10$275,000 New 834-char remark
Show marketing remark (834 chars)
Welcome to this well-maintained single-story home situated on a desirable corner lot. Offering 1,703 square feet, this 4-bedroom, 2-bathroom home features a functional open-concept layout ideal for everyday living and entertaining. The spacious eat-in kitchen includes granite countertops, a large island, ample cabinet storage, and a generously sized pantry. The open floor plan provides a seamless flow between the kitchen, dining, and living areas. The oversized backyard offers plenty of space for outdoor living, entertaining, or future improvements, and includes a storage shed for additional storage. The 2-car garage features epoxy-coated floors, providing a clean and finished look. Additional highlights include: corner lot, open floor plan, oversized yard, granite countertops, pantry, and move-in ready condition.
ⓘ Source: listings_history table (triggers on properties + properties_extension) + one-shot
backfill from property_details.listing_events for pre-trigger history.
Tax reassessment forecast TX · Resets to sale price
- Current annual tax
- $2,337 · $195/mo
- Projected year-2 tax
- $5,032 · $419/mo
- Expected delta
- +$2,696/yr (+$225/mo · 115.3%)
ⓘ Screening estimate from a state-policy table — verify with the county assessor before closing.
Climate risk First Street
- Flood 1/10 Low FEMA zone X (unshaded) · 0% chance over 30 yrs
- Wildfire 5/10 Major
- Heat 8/10 Severe 7 d/yr ≥109°F today · 23 d/yr by 30 yrs out
- Wind 8/10 Severe 80% chance of damaging wind over 30 yrs
- Air quality 2/10 Low 0 unhealthy d/yr today · 1 by 30 yrs out
Nearby sold comps map
Loading sold comps map…
Walkable amenities ~0.75 mi
Loading nearby amenities…
Taxation est. · year 1
- Rental income
- $23,135
- − Mortgage interest
- −$15,404
- − Property taxes
- −$2,337
- − Insurance
- −$1,375
- − Repairs & maintenance
- −$1,851
- − Management
- −$1,851
- − HOA
- −$1,500
- − Depreciation
- −$8,000
- Taxable loss
- −$9,183
- Est. tax savings @ 24.0%
- +$2,204
- After-tax cash flow
- $-2,037/yr
For passive investors: Depreciation is non-cash, so a rental often shows a tax loss while cash-flowing — sheltering income. Rental losses are passive: they offset passive income freely, and up to $25,000/yr can offset ordinary (W-2) income if you actively participate and your MAGI is under $100k (phasing out to $0 by $150k); unused losses carry forward. On sale, claimed depreciation is recaptured at up to 25%, and gains may owe capital-gains tax (a 1031 exchange can defer both). Figures are a year-1 estimate at your 24.0% rate — not tax advice; consult a CPA.
Schools (NCES district)
- District
- Medina Valley ISD
- NCES district ID
- 4830060
- Math proficiency
- 48% ▼ -9.00%
- Reading proficiency
- 53% ▼ -2.00%
- Median HH income
- $60,596
- Composite
- 44.2/100
- National rank
- #2851
- State rank
- #148 of 826 in TX
Livability — San Antonio
- Score
- 80/100
- State rank
- #31
- US rank
- #1616
Category grades
Schools grade is shown separately in the Schools card above.
Census & demographics
- County
- Bexar County · 1,990,555 people
- City population
- 1,806,925
- Metro
- San Antonio-New Braunfels, TX
- Population (ZIP)
- 21,790
- Household income
- $85,518
- Rent vs Own
- Severe rent burden
- 152.0
Population outlook (Bexar County) Hauer SSP2
- Today (2025)
- 2,336,851 people
- By 2030
- 2,560,728 · +9.6%
- By 2040
- 3,020,569 · +29.3%
- By 2050
- 3,493,522 · +49.5%
- By 2075
- 4,668,459 · +99.8%
- By 2100
- 5,533,242 · +136.8%
Race, ethnicity, and origin ACS 2023
- Neighborhood character
- Predominantly Hispanic (68%)
- Race & ethnicity
- Hispanic / Latino 68% Two or more races 29% White 17% Black 8% Asian 3% Native American 1%
- Hispanic origin (detail)
- Mexican 61% Puerto Rican 1%
- Common ancestry
- Hispanic 2% Lithuanian 1% German 1%
- Foreign-born
- 12% · Canada, South Korea
- Languages at home
- 58% English-only · Spanish 38% Tagalog/Filipino 2% Other Indo-European 1%
Political lean MEDSL · Bexar
- 2024 margin
- Lean D (+9.8) · D 54.3% · R 44.6% · Other 1.1%
- 2008→2024 swing
- +4.2pp toward D · 2008: 5.6pp · 2024: 9.8pp
- All cycles
- 2024: D+9.8 2020: D+18.2 2016: D+13.5 2012: D+4.6 2008: D+5.6
Not yet ingested
- Civics
- —
Market trends
- HPI YoY
- ▬ -0.00%
- Current HPI
- 183.6413
- Rent YoY
- ▼ -1.67%
- Metro
- San Antonio-New Braunfels, TX
- State GDP YoY
- ▲ 3.95%
- F500 in state
- 110
Industry mix (Fortune 500 HQ in TX)
| Industry | F500 HQs | Revenue |
|---|---|---|
| Energy | 16 | $1,198B |
|
||
| Technology | 5 | $198B |
|
||
| Engineering / Construction | 4 | $72B |
|
||
| Energy Services | 3 | $60B |
|
||
| Utilities | 3 | $41B |
|
||
| Healthcare | 2 | $330B |
|
||
Price history
2 events — show timeline
- 2026-05-04 Contingent — LERA
- 2026-04-10 Listed $275,000 LERA
Property tax history
-10.2%/yrLatest (2025): $2,337 · -61.0% YoY. Source: county tax records.
Cash-flow waterfall
monthlySold comps — $/sqft
last 12 mo · ≤1 miLoading sold comps…