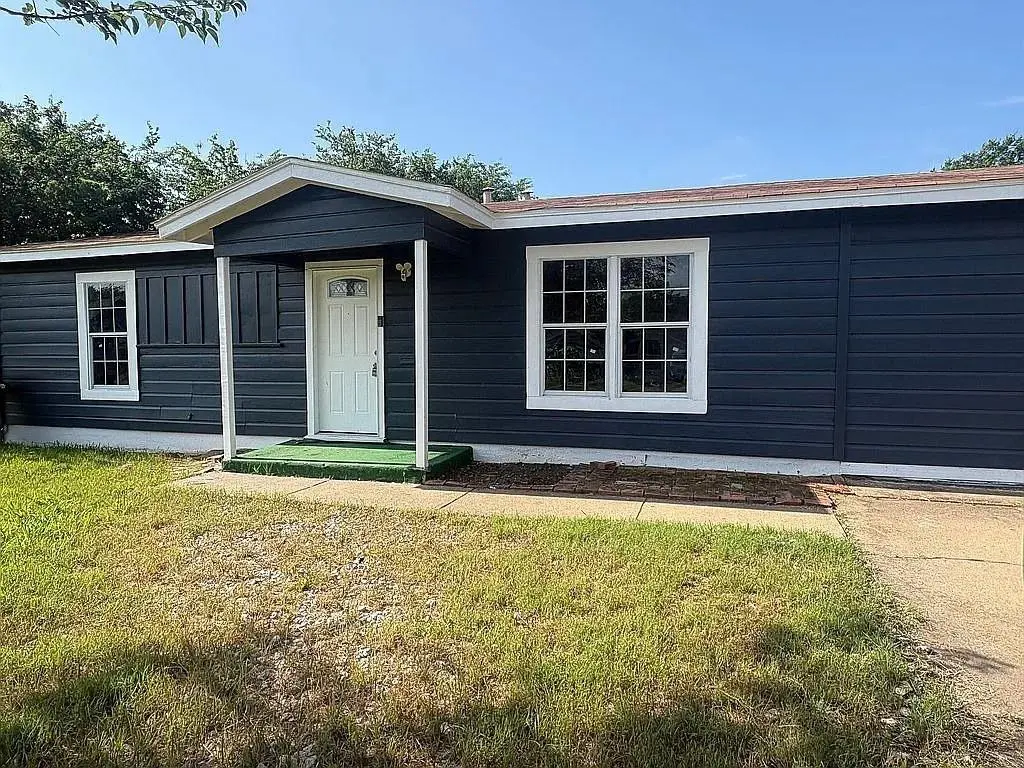
5586 Pinson St · Fort Worth, TX
Flood risk 1/10 · Minimal
- FEMA flood zone
- X (unshaded)
- Chance of flooding over 30 yrs
- 0.0%
- Est. flood insurance / yr
- $507 – $1,088
Fire risk 1/10 · Minimal
- Est. fire insurance / yr
- $1,222 – $2,270
Heat risk 8/10 · Major
- Hot days now (above 110°F)
- 7 days/yr
- Hot days in 30 yrs
- 24 days/yr
Wind risk 5/10 · Moderate
- Chance of severe wind over 30 yrs
- 26.0%
Air-quality risk 3/10 · Minor
- Unhealthy air days now
- 2 days/yr
- Unhealthy air days in 30 yrs
- 4 days/yr
Risk factors via First Street. Map © Google.
Why this score? — see what drove the D grade
The composite is a weighted blend of 9 inputs, each scored 0–100. Each bar is that input's sub-score; the figure is the points it added to the 100-point composite (weight × sub-score).
- Cash flow +12.1/30.0
- ARV discount +10.8/15.0
- Livability +4.0/5.0
- 1% rule +3.8/10.0
- DSCR +3.6/10.0
- Condition / age +2.5/5.0
- Rent growth +2.1/5.0
- Schools +2.0/10.0
- Appreciation +0.0/10.0
$189,000
🖨 Deal sheet 📄 Offer letter ✓ Due diligence
Listing remarks
4 bedroom 1 bath single family home located at 5586 Pinson St in Ft Worth 76119.
Key facts
- 7,318 sq ft lot
- Built 1959
- Listed 11 days
Property features AI
Finance
- Other: Listing is active with an exclusive right to sell agreement; Possession at closing/funding
- Financial info: Listing accepts Cash, Conventional, FHA, and VA financing
- HOA & community: No homeowners association
Exterior
- Parking: Driveway
- Utilities: City water; City sewer; No municipal utility district
- Home design: Single-family residence; One story; Residential property
- Construction: Built in 1959
- Exterior features: Lot less than 0.5 acre (approximately 0.168 acres); Subdivision: Parkside Add; Directions available
Interior
- Kitchen: Electric oven; Electric range; Microwave
- Bedrooms: 4 bedrooms (all on the main level)
- Bathrooms: 1 full bathroom
- Interior features: Eat-in kitchen; One living area; One dining area; 5 total rooms
Neighborhood map
What this means for you Summary
Snapshot
- This is a 3-bed/1.0-bath single-family listed at $189k.
Deal economics
- At list price, monthly cash flow is $-42 ($-508/yr) — negative.
- To cash-flow at today's rent, offer at most $182k (4.0% below list).
- To meet the 1% rule (rent ≥ 1% of price), the offer needs to be $166k (11.9% below list).
- Recommended offer: $166k (11.9% below list) — sets the bar for 1% rule.
- Cap rate 6.0% vs local median 3.9% in Fort Worth — top-decile yield for the area; either an underpriced asset or a hidden risk that comps aren't pricing in. Stress-test before assuming the spread holds.
Location & tenants
- Location reads 80/100 on livability (#49 in TX, #1,954 nationally) — a professional / high-income tenant draw. Strengths: amenities A+, cost of living A+, housing A+; Watch: crime F.
- Fort Worth ISD (urban): math 18% / reading 28% proficiency, ranked #742 of 826 in TX (top 90%) — low school quality limits family demand, transient renter base, plan for 1-2y turnover; 73% free/reduced lunch — lower-income household profile, screen leases tightly.
- Zoned schools: W M Green El (math 10% / reading 23%, grade F, #3,946 of 4,322 statewide, top 92%, 564 students, 96% FRL) — zoned schools average 96% FRL vs 73% district-wide (23 pts higher); higher-poverty schools than district average — tighter screening recommended.
- Market conditions: Rents soft (-1.6%/yr); 186 active listings in the ZIP; 24 comparable units currently listed for rent nearby; rentals at typical pace (median 18d on market — plan ~3-4 weeks tenant-placement turnaround); 18,938 units permitted in Tarrant County in 2024 (8,336 in 5+ unit buildings).
- This rent runs 39% of the median local income ($51k/yr) — at the standard rent-burdened threshold; future hikes will face affordability resistance.
Forward outlook
- Local home prices are declining (-3.0%/yr); year-one equity from $1k of loan paydown is wiped out by about $6k of value loss. Plan a longer hold.
- Tarrant County population projected at +41% by 2050 — long-run rental-demand tailwind backs the buy-and-hold thesis.
Negotiation context
- Only 12 days on market — expect competitive offers; lowballing is unlikely to land.
- 3 sale attempts since 9y ago with the ask held roughly flat each time — persistent listings suggest the price (not the market) is what's stuck; bring a comps-based counter.
Risks & watch-outs
- Watch-outs: built in 1959 — expect roof / HVAC / electrical / plumbing capex.
- Climate carrying-cost: moderate wind risk, 26% chance of damaging wind over 30y; extreme-heat days projected 7→24/yr by 2055 (HVAC capex compounding) — expect insurance premiums to compound above CPI over the hold.
Questions for the listing agent
- What do current leases actually rent for vs. the listed asking? Can we see a recent rent roll and the last 12 months of T-12 income?
- Built in 1959 — when were the roof, HVAC, electrical panel, plumbing, and water heater last replaced?
- Is there a deadline driving the sale (1031 exchange, divorce, estate, relocation)? That informs how much negotiation room exists.
- Schools are D-rated, which usually means shorter tenancies and higher turnover. Who's the typical renter profile here, and what's been the actual vacancy rate?
- Crime grade is F in this area — have there been break-ins, vandalism, or insurance claims at this property in the last 3 years? What carrier currently insures it and at what premium?
- The area grade is low — what's the realistic commute time and amenity access for the typical tenant pool here? Any planned neighborhood developments (good or bad) we should know about?
- What's the average days-on-market for RENTAL listings here right now (not sales)? A rising rental-DOM trend means longer vacancies and softer asking-rent achievability than the comps imply.
- What's the recent tenant-quality profile in this submarket — average credit score on applications, eviction rate, late-payment / NSF rate, and stable-employment percentage? A property-management company in the area should have these aggregated.
- How much new for-sale + rental construction is in the pipeline within 1–3 miles? Heavy new supply typically softens prices + rents 12–24 months out; constrained supply supports both.
Investment metrics
- 1% rule
- 0.88% ✗
- Cap rate
- 6.02%
- Cash-on-cash
- -0.96%
- DSCR
- 0.96
- GRM
- 9.5
CMA / ARV
- ARV (on-the-fly)
- $203,904
- Comps found
- 12
Show comp detail 12 sales within ~0.75 mi
| Address | Dist | Beds/Ba | Sqft | Sold | Price | $/sf | Match |
|---|---|---|---|---|---|---|---|
| 5608 Burton Ave | 0.09mi | 3/2.0 | 1,156 (+0%) | 2mo | $205,000 | $177 | 90 |
| 5616 Burton Ave | 0.11mi | 3/2.0 | 1,161 (+1%) | 8mo | $234,900 | $202 | 83 |
| 5716 Burton Ave | 0.18mi | 3/2.0 | 1,159 (+1%) | 5mo | $226,000 | $195 | 82 |
| 3501 Richardson Ct W | 0.13mi | 3/2.0 | 1,204 (+4%) | 5mo | $189,000 | $157 | 78 |
| 5536 Alter Dr | 0.20mi | 4/2.0 (+1) | 1,037 (-10%) | 7mo | $220,000 | $212 | 59 |
| 5234 Velma Dr | 0.54mi | 3/1.0 | 1,209 (+5%) | 9mo | $92,500 | $77 | 59 |
| 3716 Clotell Dr | 0.61mi | 3/2.0 | 1,218 (+6%) | 1mo | $220,000 | $181 | 57 |
| 3712 Preston Dr | 0.67mi | 3/2.0 | 1,222 (+6%) | 4mo | $199,000 | $163 | 51 |
| 5636 Lester Granger Dr | 0.52mi | 2/1.0 (-1) | 1,052 (-9%) | 8mo | $170,000 | $162 | 50 |
| 2917 Dillard St | 0.53mi | 4/2.0 (+1) | 1,230 (+7%) | 8mo | $225,000 | $183 | 48 |
| 3720 Carey St | 0.66mi | 3/1.0 | 998 (-13%) | 6mo | $168,000 | $168 | 42 |
| 5241 Carol Ave | 0.51mi | 4/2.0 (+1) | 1,289 (+12%) | 8mo | $199,500 | $155 | 40 |
Match score weights: distance 35% · size 25% · config 20% · recency 20%. Top-matched comps best support the ARV.
Projected returns pro-forma
-3.0% appreciation · 0.0% rent growth · sell at horizon
- IRR
- -21.4%
- Equity multiple
- 0.28×
- Total profit
- $-38,143
- Equity at exit
- $28,181
- IRR
- -24.8%
- Equity multiple
- -0.05×
- Total profit
- $-55,306
- Equity at exit
- $16,341
Cash invested: $52,920 (down + closing). Projections, not guarantees.
Landlord ↔ Tenant lean methodology
- Overall (STATE)
- 87 Strongly Landlord-Friendly
- State Texas
- 87 Strongly Landlord-Friendly · R+5
- County
- — inherits STATE
- City
- — inherits STATE
ZIP-level market 76119
- Home prices YoY
- -6.4%
- Rents YoY
- -1.6%
- Active inventory
- 186
- Price-to-rent
- 9.5×
Monthly cashflow live
- Estimated rent
- $1,664 high interval (Pro) →
- Mortgage (P&I)
- −$991
- Tax from tax record
- −$287 /mo · $3,447/yr
- Insurance
- −$79
- HOA
- −$0
- Vacancy / Maint / Mgmt
- −$350
- Net cashflow
- $-42
Break-even live
UW: 25.0% down · 7.5% · 30yr · 1.5% tax · 5.0% vac · 8.0% maint · 8.0% mgmt
Financing live
Cash to close
- Down payment
- $47,250
- Closing costs
- $5,670
- Reserves months
- —
- Total cash needed
- —
Loan-product check · same deal, 3 products live
Conventional
25% down · 7.5% · 30yr
- Down + closing
- —
- Monthly P&I
- —
- Monthly cashflow
- —
- DSCR
- —
- Eligible?
- —
Personal DTI + credit; lowest rate.
DSCR
20% down · 8.5% · 30yr
- Down + closing
- —
- Monthly P&I
- —
- Monthly cashflow
- —
- DSCR
- —
- Eligible?
- —
No personal income docs; deal must DSCR.
Hard money
10% down · 12.0% · 12mo
- Down + closing
- —
- Monthly P&I
- —
- Monthly cashflow
- —
- DSCR
- —
- Eligible?
- —
Short-term bridge; refi at stabilization.
Rent comps 24 comps
| Address | Beds | Baths | Sqft | Rent | $/sqft | DOM | Units | Dist |
|---|---|---|---|---|---|---|---|---|
| 3700 Radford Rd Fort Worth, TX | 3.0 | 2.0 | 1124 | $1,650 | $1.47 | 24d | 1 | 0.19mi |
| 3700 Radford Rd Fort Worth, TX | 3.0 | 2.0 | 1124 | $1,650 | $1.47 | 12d | 1 | 0.19mi |
| 3201 Mount Horum Way Fort Worth, TX | 3.0 | 2.0 | 1045 | $1,699 | $1.63 | 6d | 1 | 0.35mi |
| 5336 Cottey St Fort Worth, TX | 3.0 | 2.0 | 1045 | $1,699 | $1.63 | 43d | 1 | 0.43mi |
| 5328 Carol Ave Fort Worth, TX | 4.0 | 2.0 | 1230 | $2,100 | $1.71 | 43d | 1 | 0.46mi |
| 5636 Lester Granger Dr Fort Worth, TX | 3.0 | 2.0 | 1300 | $1,495 | $1.15 | 24d | 1 | 0.49mi |
| 3848 Waldorf St Fort Worth, TX | 2.0 | 1.0 | 734 | $1,195 | $1.63 | 5d | 1 | 0.52mi |
| 3865 Stalcup Rd Fort Worth, TX | 3.0 | 2.0 | 1090 | $1,814 | $1.66 | 6d | 1 | 0.58mi |
| 5818 Grayson St Unit 5818 Fort Worth, TX | 3.0 | 2.5 | 1400 | $2,000 | $1.43 | 18d | 1 | 0.67mi |
| 5820 Grayson St Fort Worth, TX | 3.0 | 2.5 | 1417 | $1,895 | $1.34 | 43d | 1 | 0.68mi |
| 5913 Montague St Fort Worth, TX | 3.0 | 2.0 | 1090 | $1,549 | $1.42 | 14d | 1 | 0.73mi |
| 2128 R. W. Bivens Ln Fort Worth, TX | 3.0 | 2.0 | 1045 | $1,615 | $1.55 | 14d | 1 | 0.80mi |
| 5055 Virgil St Fort Worth, TX | 3.0 | 2.0 | 1089 | $1,650 | $1.52 | 24d | 1 | 0.85mi |
| 5011 Sunshine Dr Fort Worth, TX | 2.0 | 1.0 | 813 | $1,515 | $1.86 | 24d | 1 | 0.86mi |
| 1810 Wiseman Ave Fort Worth, TX | 3.0 | 2.0 | 1000 | $1,500 | $1.50 | 43d | 1 | 0.88mi |
| 1804 Andrew Ave Fort Worth, TX | 2.0 | 1.0 | 764 | $1,395 | $1.83 | 17d | 1 | 0.92mi |
| 5908 Oakdale Dr Fort Worth, TX | 3.0 | 2.0 | 1090 | $1,475 | $1.35 | 6d | 1 | 0.92mi |
| 1736 Ransom Ter Fort Worth, TX | 3.0 | 2.0 | 1322 | $1,850 | $1.40 | 15d | 1 | 0.98mi |
| 5910 Wilkes Dr Fort Worth, TX | 3.0 | 2.0 | 872 | $1,445 | $1.66 | 6d | 1 | 1.01mi |
| 5912 Wilkes Dr Fort Worth, TX | 3.0 | 2.0 | 872 | $1,499 | $1.72 | 43d | 1 | 1.05mi |
| 4929 Willie St Fort Worth, TX | 3.0 | 2.0 | 1386 | $1,650 | $1.19 | 4d | 1 | 1.14mi |
| 2500 S Edgewood Ter Fort Worth, TX | 1.0–3.0 | 1.0–2.5 | 1123 | $1,895 | $1.69 | 1d | 34 | 1.38mi |
| 4508 Wiman Dr Fort Worth, TX | 3.0 | 2.0 | 1045 | $1,580 | $1.51 | 6d | 1 | 1.43mi |
| 4217 Wilhelm St Fort Worth, TX | 3.0 | 2.0 | 1380 | $1,650 | $1.20 | 43d | 1 | 1.45mi |
Listing history 9 events
-
2026-06-18days on market $189,000 Active 12 DOM
-
2026-06-17days on market $189,000 Active 11 DOM
-
2026-06-16days on market $189,000 Active 10 DOM
-
2026-06-15days on market $189,000 Active 9 DOM
-
2026-06-13days on market $189,000 Active 7 DOM
-
2026-06-09days on market $189,000 Active 3 DOM
-
2026-06-08days on market $189,000 Active 2 DOM
-
2026-06-07remarks 80-char remark
-
2026-06-07$189,000 Active 1 DOM
ⓘ Source: listings_history table (triggers on properties + properties_extension) + one-shot
backfill from property_details.listing_events for pre-trigger history.
Tax reassessment forecast TX · Resets to sale price
- Current annual tax
- $3,447 · $287/mo
- Projected year-2 tax
- $3,459 · $288/mo
- Expected delta
- +$12/yr (+$1/mo · 0.3%)
ⓘ Screening estimate from a state-policy table — verify with the county assessor before closing.
Climate risk First Street
- Flood 1/10 Low FEMA zone X (unshaded) · 0% chance over 30 yrs
- Wildfire 1/10 Low
- Heat 8/10 Severe 7 d/yr ≥110°F today · 24 d/yr by 30 yrs out
- Wind 5/10 Major 26% chance of damaging wind over 30 yrs
- Air quality 3/10 Moderate 2 unhealthy d/yr today · 4 by 30 yrs out
Nearby sold comps map
Loading sold comps map…
Walkable amenities ~0.75 mi
Loading nearby amenities…
Taxation est. · year 1
- Rental income
- $19,972
- − Mortgage interest
- −$10,587
- − Property taxes
- −$3,447
- − Insurance
- −$945
- − Repairs & maintenance
- −$1,598
- − Management
- −$1,598
- − Depreciation
- −$5,498
- Taxable loss
- −$3,701
- Est. tax savings @ 24.0%
- +$888
- After-tax cash flow
- $380/yr
For passive investors: Depreciation is non-cash, so a rental often shows a tax loss while cash-flowing — sheltering income. Rental losses are passive: they offset passive income freely, and up to $25,000/yr can offset ordinary (W-2) income if you actively participate and your MAGI is under $100k (phasing out to $0 by $150k); unused losses carry forward. On sale, claimed depreciation is recaptured at up to 25%, and gains may owe capital-gains tax (a 1031 exchange can defer both). Figures are a year-1 estimate at your 24.0% rate — not tax advice; consult a CPA.
Schools (NCES district)
- District
- Fort Worth ISD
- NCES district ID
- 4819700
- Math proficiency
- 18% ▼ -16.00%
- Reading proficiency
- 28% ▼ -6.00%
- Median HH income
- $42,109
- Composite
- 19.61/100
- National rank
- #8753
- State rank
- #742 of 826 in TX
Livability — Fort Worth
- Score
- 80/100
- State rank
- #49
- US rank
- #1954
Category grades
Schools grade is shown separately in the Schools card above.
Census & demographics
- Census place
- Fort Worth, TX
- County
- Tarrant County · 2,033,669 people
- City population
- 911,619
- Metro
- Dallas-Fort Worth-Arlington, TX
- Population (ZIP)
- 52,974
- Household income
- $51,267
- Rent vs Own
- Severe rent burden
- 2221.0
Population outlook (Tarrant County) Hauer SSP2
- Today (2025)
- 2,380,417 people
- By 2030
- 2,578,900 · +8.3%
- By 2040
- 2,974,995 · +25.0%
- By 2050
- 3,350,489 · +40.8%
- By 2075
- 4,216,909 · +77.2%
- By 2100
- 4,741,527 · +99.2%
Race, ethnicity, and origin ACS 2023
- Neighborhood character
- Diverse neighborhood (Simpson 0.60)
- Race & ethnicity
- Hispanic / Latino 51% Black 36% Two or more races 26% White 8% Asian 3%
- Hispanic origin (detail)
- Mexican 44%
- Foreign-born
- 25% · Canada, Philippines
- Languages at home
- 54% English-only · Spanish 42% Other Indo-European 2% Other Asian/Pacific 1%
Political lean MEDSL · Tarrant
- 2024 margin
- Lean R (+5.1) · D 46.7% · R 51.9% · Other 1.4%
- 2008→2024 swing
- +6.6pp toward D · 2008: -11.7pp · 2024: -5.1pp
- All cycles
- 2024: R+5.1 2020: D+0.2 2016: R+8.7 2012: R+15.7 2008: R+11.7
Not yet ingested
- Civics
- —
Market trends
- HPI YoY
- ▼ -23.04%
- Current HPI
- 336.7941
- Rent YoY
- ▼ -1.61%
- Metro
- Dallas-Fort Worth-Arlington, TX
- State GDP YoY
- ▲ 3.95%
- F500 in state
- 110
Industry mix (Fortune 500 HQ in TX)
| Industry | F500 HQs | Revenue |
|---|---|---|
| Energy | 16 | $1,198B |
|
||
| Technology | 5 | $198B |
|
||
| Engineering / Construction | 4 | $72B |
|
||
| Energy Services | 3 | $60B |
|
||
| Utilities | 3 | $41B |
|
||
| Healthcare | 2 | $330B |
|
||
Price history
+73.6% since first listed16 events — show timeline
- 2026-06-06 Listed $189,000 NTREIS
- 2025-08-08 Sold (Public Records) — Public Records
- 2025-08-06 Sold (Public Records) — Public Records
- 2025-02-21 Contingent — NTREIS
- 2025-02-06 Price Changed $144,990 NTREIS
- 2025-01-31 Price Changed $154,900 NTREIS
- 2025-01-27 Price Changed $165,000 NTREIS
- 2025-01-21 Price Changed $170,000 NTREIS
- 2025-01-17 Price Changed $180,000 NTREIS
- 2025-01-08 Listed $185,000 NTREIS
- 2020-07-06 Sold (Public Records) — Public Records
- 2020-03-10 Sold (Public Records) — Public Records
- 2017-12-05 Sold (Public Records) — Public Records
- 2017-12-04 Listing Removed — NTREIS
- 2017-06-20 Listed $108,900 NTREIS
- 2017-05-31 Sold (Public Records) — Public Records
Property tax history
+9.9%/yrLatest (2025): $3,447 · +7.3% YoY. Source: county tax records.
Cash-flow waterfall
monthlySold comps — $/sqft
last 12 mo · ≤1 miLoading sold comps…