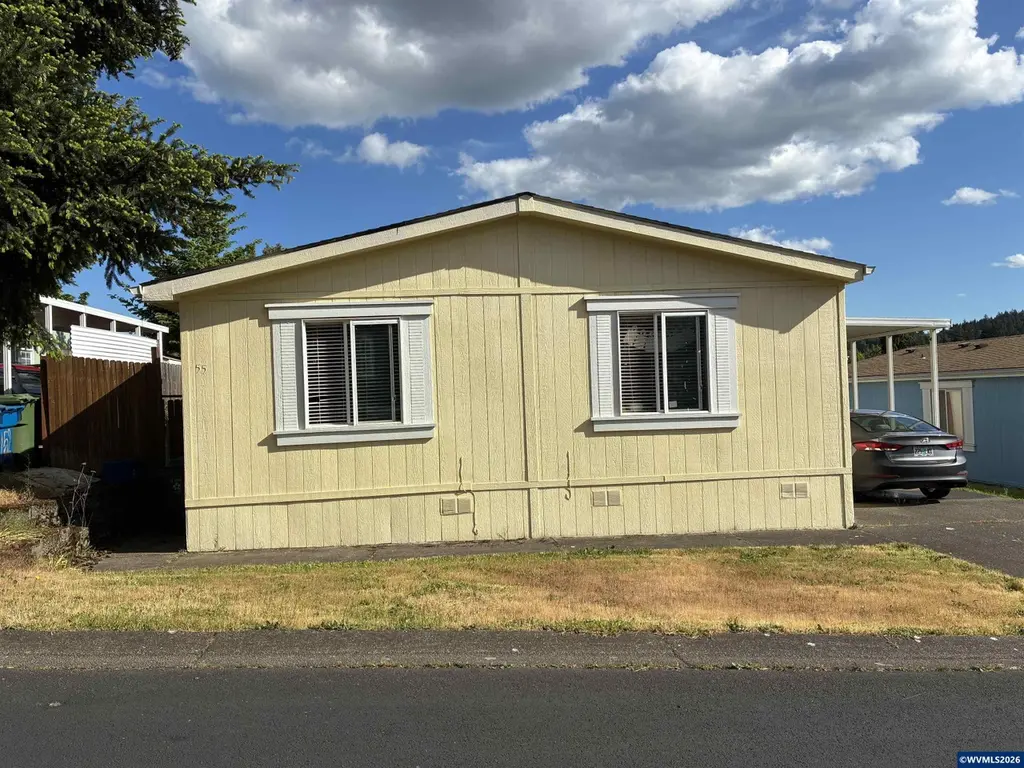
2000 Robins Ln SE #55 · Salem, OR
Flood risk 1/10 · Minimal
- FEMA flood zone
- X (unshaded)
- Chance of flooding over 30 yrs
- 0.0%
- Est. flood insurance / yr
- $507 – $1,088
Fire risk 3/10 · Minor
- Est. fire insurance / yr
- $498 – $926
Heat risk 3/10 · Minor
- Hot days now (above 91°F)
- 7 days/yr
- Hot days in 30 yrs
- 15 days/yr
Wind risk 1/10 · Minimal
- Chance of severe wind over 30 yrs
- —
Air-quality risk 9/10 · Severe
- Unhealthy air days now
- 12 days/yr
- Unhealthy air days in 30 yrs
- 13 days/yr
Risk factors via First Street. Map © Google.
Why this score? — see what drove the B- grade
The composite is a weighted blend of 9 inputs, each scored 0–100. Each bar is that input's sub-score; the figure is the points it added to the 100-point composite (weight × sub-score).
- Cash flow +30.0/30.0
- 1% rule +10.0/10.0
- DSCR +10.0/10.0
- ARV discount +4.8/15.0
- Livability +4.0/5.0
- Schools +3.7/10.0
- Rent growth +2.9/5.0
- Condition / age +2.5/5.0
- Appreciation +0.0/10.0
$95,000
🖨 Deal sheet (PDF) 📄 Offer letter ✓ Due diligence
Listing remarks MLS
Delightful, inviting 1997 Skyline manufactured home in Oak Pointe all age park; freshly painted inside & out; newer: laminate floors, carpet & plantation blinds. MBR at opposite end from other 2 BRs; both BAs w/ tub/shower combo; kitchen w/ wood cabinets, refrigerator w/ icemaker, built-in microwave over electric range, dishwasher; heat pump for heating/cooling; big utility; vaulted ceilings; vinyl windows & privacy fenced yard for your pet! Prime location!
Key facts
- Split br floor plan
- Great room concept
- Backyard deck
Tags
Property features AI
Finance
- Other: No assessments/liens reported; Possession at closing
- HOA & community: Located in Oak Pointe park (not an adult-only park); No home warranty
Exterior
- Parking: One garage space; Carport
- Utilities: City water connected; City sewer; Electric water heater
- Home design: Double-wide mobile home; Skyline make; Built in 1997; Yellow exterior; All-age park (Oak Pointe)
- Construction: Pier foundation; T111 siding; Composition roof; Mobile home size approximately 40 x 27; Serial number 67910404JAB
- Exterior features: Privacy fenced backyard; Deck; Landscaped yard; Shed; Back door
Interior
- Kitchen: Electric range; Microwave included; Refrigerator included; Disposal
- Bedrooms: Master bedroom on the main level (12 x 13); Second bedroom on the main level (10.8 x 13); Third bedroom (10.8 x 13)
- Flooring: Carpet; Vinyl; Laminate
- Bathrooms: Two bathrooms on the main level with tub/shower combos
- Heating & cooling: Electric heating; Ductless heating/cooling
- Interior features: High-speed internet available; Dining area combined with kitchen
- Laundry & utility: Washer and dryer included; Utility room on the main level (6 x 8)
Neighborhood map
What this means for you Summary
Snapshot
- This is a 3-bed/2.0-bath manufactured listed at $95k.
Deal economics
- At list price, monthly cash flow is $857 ($10k/yr) — positive.
- The deal already cash-flows at list — no discount required.
- Meets the 1% rule at list price ($2k rent vs $95k).
- Recommended offer: $92k (3.0% below list) — sets the bar for market timing.
- Cap rate 17.1% vs local median 2.9% in Salem — top-decile yield for the area; either an underpriced asset or a hidden risk that comps aren't pricing in. Stress-test before assuming the spread holds.
Location & tenants
- Location reads 79/100 on livability (#59 in OR, #2,084 nationally) — a middle-class / working-renter tenant base. Strengths: amenities A+, commute A+, housing A+; Watch: crime F.
- Salem-Keizer SD 24J (urban): math 34% / reading 47% proficiency, ranked #103 of 183 in OR (top 56%) — families likely to look elsewhere, expect single-tenant / working-renter base with shorter leases.
- Zoned schools: Pringle Elementary School (499 students, 91% FRL); Judson Middle School (810 students, 96% FRL); South Salem High School (2,256 students, 96% FRL) — zoned schools average 94% FRL vs 53% district-wide (42 pts higher); higher-poverty schools than district average — tighter screening recommended.
- Market conditions: Rents rising (+1.6%/yr); 278 active listings in the ZIP; 40 comparable units currently listed for rent nearby; rentals at typical pace (median 26d on market — plan ~3-4 weeks tenant-placement turnaround); solid renter incomes; 1,591 units permitted in Marion County in 2024 (716 in 5+ unit buildings).
Forward outlook
- Local home prices are declining (-3.0%/yr); year-one equity from $657 of loan paydown is wiped out by about $3k of value loss. Plan a longer hold.
- Marion County population projected at +17% by 2050 — long-run rental-demand tailwind backs the buy-and-hold thesis.
- At projected returns (-3.0% appreciation + 1.6% rent growth), your $27k cash investment doubles in ~4 years — after that, you're playing with house money.
Negotiation context
- It's been on market 33 days — a 3% lower offer ($92k) is reasonable based on typical stale-listing flexibility.
- 4 sale attempts since 21y ago with the ask held roughly flat each time — persistent listings suggest the price (not the market) is what's stuck; bring a comps-based counter.
- Current owner paid $32k; list at $95k implies a 197% gain — meaningful room to come down on a strong offer.
Questions for the listing agent
- It's been on market 33 days. Have you received any prior offers? Is the seller open to a 3% concession, seller financing, or rate buy-down credit?
- Is there a deadline driving the sale (1031 exchange, divorce, estate, relocation)? That informs how much negotiation room exists.
- Schools are D-rated, which usually means shorter tenancies and higher turnover. Who's the typical renter profile here, and what's been the actual vacancy rate?
- Crime grade is F in this area — have there been break-ins, vandalism, or insurance claims at this property in the last 3 years? What carrier currently insures it and at what premium?
- What's the average days-on-market for RENTAL listings here right now (not sales)? A rising rental-DOM trend means longer vacancies and softer asking-rent achievability than the comps imply.
- What's the recent tenant-quality profile in this submarket — average credit score on applications, eviction rate, late-payment / NSF rate, and stable-employment percentage? A property-management company in the area should have these aggregated.
- How much new for-sale + rental construction is in the pipeline within 1–3 miles? Heavy new supply typically softens prices + rents 12–24 months out; constrained supply supports both.
Investment metrics
- 1% rule
- 1.96% ✓
- Cap rate
- 17.12%
- Cash-on-cash
- 38.65%
- DSCR
- 2.72
- GRM
- 4.2
CMA / ARV
- ARV (on-the-fly)
- $89,640
- Comps found
- 7
Show comp detail 7 sales within ~0.75 mi
| Address | Dist | Beds/Ba | Sqft | Sold | Price | $/sf | Match |
|---|---|---|---|---|---|---|---|
| 2045 Nocturne Ct SE | 0.44mi | 3/2.0 | 1,152 (+7%) | 3mo | $45,000 | $39 | 66 |
| 2065 Nougat Ct SE | 0.39mi | 2/2.0 (-1) | 1,056 (-2%) | 10mo | $46,400 | $44 | 64 |
| 6820 Fairway Ave SE #6820 | 0.43mi | 3/2.0 | 1,152 (+7%) | 12mo | $96,000 | $83 | 59 |
| 2120 Robins Ln SE #45 | 0.26mi | 2/2.0 (-1) | 960 (-11%) | 7mo | $124,900 | $130 | 59 |
| 2120 Robins Ln SE #24 | 0.24mi | 2/2.0 (-1) | 1,232 (+14%) | 17mo | $199,900 | $162 | 46 |
| 2020 Navaho Ct SE #2020 | 0.60mi | 2/2.0 (-1) | 938 (-13%) | 3mo | $49,900 | $53 | 42 |
| 1652 Wiltsey Rd #27 | 0.53mi | 2/2.0 (-1) | 924 (-14%) | 5mo | $82,000 | $89 | 42 |
Match score weights: distance 35% · size 25% · config 20% · recency 20%. Top-matched comps best support the ARV.
Projected returns pro-forma
-3.0% appreciation · 1.64% rent growth · sell at horizon
- IRR
- 33.3%
- Equity multiple
- 2.38×
- Total profit
- $36,665
- Equity at exit
- $14,165
- IRR
- 39.5%
- Equity multiple
- 4.46×
- Total profit
- $92,161
- Equity at exit
- $8,214
Cash invested: $26,600 (down + closing). Projections, not guarantees.
Landlord ↔ Tenant lean methodology
- Overall (STATE)
- 28 Tenant-Leaning
- State Oregon
- 28 Tenant-Leaning · D+6
- County
- — inherits STATE
- City
- — inherits STATE
ZIP-level market 97306
- Rents YoY
- 1.6%
- Active inventory
- 278
- Price-to-rent
- 4.2×
Monthly cashflow live
- Estimated rent
- $1,864 high interval (Pro) →
- Mortgage (P&I)
- −$498
- Tax from tax record
- −$78 /mo · $939/yr
- Insurance
- −$40
- HOA
- −$0
- Vacancy / Maint / Mgmt
- −$392
- Net cashflow
- $857
Break-even live
Sensitivity live
| Price | -10% $911 | -5% $884 | +0% $857 | +5% $830 | +10% $803 |
|---|---|---|---|---|---|
| Rent | -10% $710 | -5% $783 | +0% $857 | +5% $930 | +10% $1,004 |
| Rate | -1.0pp $905 | -0.5pp $881 | base $857 | +0.5pp $832 | +1.0pp $807 |
UW: 25.0% down · 7.5% · 30yr · 1.5% tax · 5.0% vac · 8.0% maint · 8.0% mgmt
Financing live
Cash to close
- Down payment
- $23,750
- Closing costs
- $2,850
- Reserves months
- —
- Total cash needed
- —
Loan-product check · same deal, 3 products live
Conventional
25% down · 7.5% · 30yr
- Down + closing
- —
- Monthly P&I
- —
- Monthly cashflow
- —
- DSCR
- —
- Eligible?
- —
Personal DTI + credit; lowest rate.
DSCR
20% down · 8.5% · 30yr
- Down + closing
- —
- Monthly P&I
- —
- Monthly cashflow
- —
- DSCR
- —
- Eligible?
- —
No personal income docs; deal must DSCR.
Hard money
10% down · 12.0% · 12mo
- Down + closing
- —
- Monthly P&I
- —
- Monthly cashflow
- —
- DSCR
- —
- Eligible?
- —
Short-term bridge; refi at stabilization.
Rent comps 40 comps
| Address | Beds | Baths | Sqft | Rent | $/sqft | DOM | Units | Dist |
|---|---|---|---|---|---|---|---|---|
| 1900 Madras St SE Salem, OR | 1.0–3.0 | 1.0–2.0 | 895 | $1,895 | $2.12 | 16d | 10 | 0.22mi |
| 1951 Madras St SE Salem, OR | 2.0 | 2.5 | 1465 | $1,975 | $1.35 | 23d | 1 | 0.32mi |
| 1691 Waln Dr SE Salem, OR | 1.0–2.0 | 1.0–2.0 | 955 | $1,725 | $1.81 | 16d | 6 | 0.33mi |
| 1701 Madras St SE Salem, OR | 2.0 | 1.0 | 828 | $1,145 | $1.38 | 46d | 1 | 0.41mi |
| 5943 Blue River Dr SE Salem, OR | 3.0 | 3.0 | 1472 | $2,395 | $1.63 | 46d | 1 | 0.41mi |
| 1626 Madras St SE Salem, OR | 2.0 | 1.0 | 921 | $1,695 | $1.84 | 46d | 1 | 0.42mi |
| 6150 Fircrest St SE Salem, OR | 3.0 | 1.5 | 1140 | $2,050 | $1.80 | 16d | 1 | 0.46mi |
| 6150 Fircrest St SE Unit 6160 Salem, OR | 3.0 | 1.5 | 1140 | $2,050 | $1.80 | 16d | 1 | 0.46mi |
| 1807 Wiltsey Rd SE Salem, OR | 1.0–2.0 | 1.0–2.0 | 845 | $1,710 | $2.02 | 16d | 6 | 0.47mi |
| 5952 Park Ct SE Salem, OR | 1.0–2.0 | 1.0 | 742 | $1,299 | $1.75 | 16d | 11 | 0.48mi |
| 5851 Reed Ln SE Salem, OR | 2.0 | 2.0 | 990 | $1,652 | $1.67 | 16d | 7 | 0.48mi |
| 1544 Fircrest Ct SE Salem, OR | 2.0 | 1.5 | 1296 | $1,850 | $1.43 | 25d | 1 | 0.54mi |
| 1860 Rees Hill Rd SE Salem, OR | 2.0 | 2.0 | 962 | $1,675 | $1.74 | 16d | 2 | 0.54mi |
| 1860 Rees Hill Rd SE Unit 1870-205 Salem, OR | 2.0 | 2.0 | 1000 | $1,800 | $1.80 | 25d | 1 | 0.54mi |
| 1860 Rees Hill Rd SE Unit 1890-112 Salem, OR | 2.0 | 2.0 | 925 | $1,650 | $1.78 | 46d | 1 | 0.54mi |
| 5823 Reed Ln SE Unit 112 Salem, OR | 2.0 | 2.5 | 1198 | $1,995 | $1.67 | 25d | 1 | 0.55mi |
| 5775 Commercial St SE Salem, OR | 1.0–3.0 | 1.0–2.0 | 779 | $2,225 | $2.85 | 16d | 47 | 0.55mi |
| 5775 Commercial St SE Salem, OR | 1.0–3.0 | 1.0–2.0 | 779 | $2,295 | $2.94 | 25d | 17 | 0.55mi |
| 5815 Reed Ln SE Unit 133 Salem, OR | 2.0 | 2.5 | 1198 | $1,995 | $1.67 | 25d | 1 | 0.57mi |
| 2116 Nomad Ct SE Unit 2120 Salem, OR | 2.0 | 1.0 | 1050 | $1,425 | $1.36 | 16d | 1 | 0.58mi |
| 1410 Jonmart Ave SE Salem, OR | 3.0 | 2.0 | 1096 | $1,995 | $1.82 | 16d | 1 | 0.61mi |
| 2194 Navaho Ct SE Unit 2198 Salem, OR | 2.0 | 1.0 | 989 | $1,395 | $1.41 | 46d | 1 | 0.64mi |
| 1359 Madras St SE Salem, OR | 2.0 | 1.5 | 864 | $1,495 | $1.73 | 25d | 1 | 0.65mi |
| 2220 Navaho Ct SE Unit 2220 Salem, OR | 2.0 | 1.0 | 1023 | $1,295 | $1.27 | 25d | 1 | 0.65mi |
| 1543 Wiltsey Rd SE Salem, OR | 2.0 | 1.0–2.0 | 1043 | $1,475 | $1.41 | 16d | 4 | 0.65mi |
| 6953 Talloc Ave SE Unit 6955 Salem, OR | 3.0 | 2.5 | 1418 | $2,295 | $1.62 | 16d | 1 | 0.66mi |
| 5512 Murray St SE Salem, OR | 3.0 | 2.0 | 1275 | $2,645 | $2.07 | 23d | 1 | 0.87mi |
| 5535 Woodside Dr SE Unit 442-60 Salem, OR | 2.0 | 1.0 | 982 | $1,399 | $1.42 | 46d | 1 | 0.97mi |
| 5463-5487 Commercial St SE Unit 41 Salem, OR | 2.0 | 1.0 | 889 | $1,250 | $1.41 | 25d | 1 | 1.04mi |
| 5463-5487 Commercial St SE Apt 40 Salem, OR | 2.0 | 1.0 | 889 | $1,250 | $1.41 | 23d | 1 | 1.04mi |
| 5463-5487 Commercial St SE Unit 04 Salem, OR | 2.0 | 1.0 | 889 | $1,175 | $1.32 | 46d | 1 | 1.04mi |
| 5423 Monterey Dr SE Salem, OR | 3.0 | 2.0 | 1457 | $2,295 | $1.58 | 25d | 1 | 1.05mi |
| 5787 Sunstone St SE Unit 5787 Salem, OR | 3.0 | 1.5 | 1192 | $1,645 | $1.38 | 25d | 1 | 1.05mi |
| 5442 Monterey Dr SE Unit 5442 Salem, OR | 2.0 | 2.0 | 1112 | $1,995 | $1.79 | 25d | 1 | 1.05mi |
| 1250 Baxter Rd SE Unit 1276 Salem, OR | 3.0 | 2.5 | 1289 | $2,395 | $1.86 | 16d | 1 | 1.12mi |
| 2846 Vintage Ave SE Unit 2846 Salem, OR | 2.0 | 2.0 | 1105 | $1,895 | $1.71 | 46d | 1 | 1.19mi |
| 5290 Baxter Ct SE Salem, OR | 2.0 | 1.5 | 1125 | $1,900 | $1.69 | 16d | 1 | 1.25mi |
| 5248 Baxter Ct SE Salem, OR | 2.0 | 1.5 | 1105 | $1,750 | $1.58 | 46d | 1 | 1.27mi |
| 5031 Big Rock Ct SE Salem, OR | 3.0 | 2.0 | 1314 | $2,700 | $2.05 | 46d | 1 | 1.40mi |
| 1194 Barnes Ave SE Salem, OR | 1.0–2.0 | 1.0 | 807 | $1,499 | $1.86 | 16d | 3 | 1.41mi |
Listing history 25 events
-
2026-06-21days on market $95,000 Active 33 DOM
-
2026-06-18days on market $95,000 Active 30 DOM
-
2026-06-17days on market $95,000 Active 29 DOM
-
2026-06-16days on market $95,000 Active 28 DOM
-
2026-06-15days on market $95,000 Active 27 DOM
-
2026-06-14days on market $95,000 Active 25 DOM
-
2026-06-10days on market $95,000 Active 22 DOM
-
2026-06-09days on market $95,000 Active 21 DOM
-
2026-06-08days on market $95,000 Active 20 DOM
-
2026-06-07days on market $95,000 Active 19 DOM
-
2026-06-03days on market $95,000 Active 15 DOM
-
2026-06-02days on market $95,000 Active 14 DOM
-
2026-06-01days on market $95,000 Active 13 DOM
-
2026-05-31days on market $95,000 Active 12 DOM
-
2026-05-30days on market $95,000 Active 11 DOM
-
2026-05-19$95,000 Active
-
2014-09-30soldstatus $32,000 Sold 475-char remark
Show marketing remark (475 chars)
Delightful, inviting 1997 Skyline manufactured home in Oak Pointe all age park; freshly painted inside & out; newer: laminate floors, carpet & plantation blinds. MBR at opposite end from other 2 BRs; both BAs w/ tub/shower combo; kitchen w/ wood cabinets, refrigerator w/ icemaker, built-in microwave over electric range, dishwasher; heat pump for heating/cooling; big utility; vaulted ceilings; vinyl windows & privacy fenced yard for your pet! Prime location!
-
2014-09-23historical Active under Contract 475-char remark
Show marketing remark (475 chars)
Delightful, inviting 1997 Skyline manufactured home in Oak Pointe all age park; freshly painted inside & out; newer: laminate floors, carpet & plantation blinds. MBR at opposite end from other 2 BRs; both BAs w/ tub/shower combo; kitchen w/ wood cabinets, refrigerator w/ icemaker, built-in microwave over electric range, dishwasher; heat pump for heating/cooling; big utility; vaulted ceilings; vinyl windows & privacy fenced yard for your pet! Prime location!
-
2014-09-17$32,000 Active 475-char remark
Show marketing remark (475 chars)
Delightful, inviting 1997 Skyline manufactured home in Oak Pointe all age park; freshly painted inside & out; newer: laminate floors, carpet & plantation blinds. MBR at opposite end from other 2 BRs; both BAs w/ tub/shower combo; kitchen w/ wood cabinets, refrigerator w/ icemaker, built-in microwave over electric range, dishwasher; heat pump for heating/cooling; big utility; vaulted ceilings; vinyl windows & privacy fenced yard for your pet! Prime location!
-
2012-03-28historical
-
2010-09-20historical
-
2010-07-29price $35,900
-
2010-04-15price $39,900
-
2010-03-31$44,900 Active
-
2005-10-24$34,900
ⓘ Source: listings_history table (triggers on properties + properties_extension) + one-shot
backfill from property_details.listing_events for pre-trigger history.
Tax reassessment forecast OR · Resets to sale price
- Current annual tax
- $939 · $78/mo
- Projected year-2 tax
- $939 · $78/mo
- Expected delta
- $0/yr ($0/mo · 0.0%)
ⓘ Screening estimate from a state-policy table — verify with the county assessor before closing.
Climate risk First Street
- Flood 1/10 Low FEMA zone X (unshaded) · 0% chance over 30 yrs
- Wildfire 3/10 Moderate
- Heat 3/10 Moderate 7 d/yr ≥91°F today · 15 d/yr by 30 yrs out
- Wind 1/10 Low
- Air quality 9/10 Extreme 12 unhealthy d/yr today · 13 by 30 yrs out
Nearby sold comps map
Loading sold comps map…
Walkable amenities ~0.75 mi
Loading nearby amenities…
Taxation est. · year 1
- Rental income
- $22,373
- − Mortgage interest
- −$5,321
- − Property taxes
- −$939
- − Insurance
- −$475
- − Repairs & maintenance
- −$1,790
- − Management
- −$1,790
- − Depreciation
- −$2,764
- Taxable income
- $9,294
- Est. tax owed @ 24.0%
- −$2,231
- After-tax cash flow
- $8,052/yr
For passive investors: Depreciation is non-cash, so a rental often shows a tax loss while cash-flowing — sheltering income. Rental losses are passive: they offset passive income freely, and up to $25,000/yr can offset ordinary (W-2) income if you actively participate and your MAGI is under $100k (phasing out to $0 by $150k); unused losses carry forward. On sale, claimed depreciation is recaptured at up to 25%, and gains may owe capital-gains tax (a 1031 exchange can defer both). Figures are a year-1 estimate at your 24.0% rate — not tax advice; consult a CPA.
Schools (NCES district)
- District
- Salem-Keizer SD 24J
- NCES district ID
- 4110820
- Math proficiency
- 34% ▼ -1.00%
- Reading proficiency
- 47% ▼ -2.00%
- Median HH income
- $48,632
- Composite
- 37.16/100
- National rank
- #9017
- State rank
- #103 of 183 in OR
Livability — Salem
- Score
- 79/100
- State rank
- #59
- US rank
- #2084
Category grades
Schools grade is shown separately in the Schools card above.
Census & demographics
- Census place
- Salem, OR
- County
- Marion County · 258,219 people
- City population
- 193,601
- Metro
- Salem, OR
- Population (ZIP)
- 34,383
- Household income
- $101,753
- Rent vs Own
- Severe rent burden
- 1437.0
Population outlook (Marion County) Hauer SSP2
- Today (2025)
- 360,940 people
- By 2030
- 375,178 · +3.9%
- By 2040
- 400,914 · +11.1%
- By 2050
- 422,187 · +17.0%
- By 2075
- 460,305 · +27.5%
- By 2100
- 464,025 · +28.6%
Race, ethnicity, and origin ACS 2023
- Neighborhood character
- Predominantly White (74%)
- Race & ethnicity
- White 74% Hispanic / Latino 12% Two or more races 9% Asian 5% Pacific Islander 2% Black 1%
- Hispanic origin (detail)
- Mexican 9%
- Common ancestry
- Italian 6% Portuguese 5% Slovak 3%
- Foreign-born
- 8% · Canada, China, Vietnam
- Languages at home
- 86% English-only · Spanish 6% Other Asian/Pacific 3% Russian/Polish/Slavic 1%
Political lean MEDSL · Marion
- 2024 margin
- Toss-up / Even · D 47.5% · R 49.5% · Other 3.0%
- 2008→2024 swing
- -4.2pp toward R · 2008: 2.2pp · 2024: -2.0pp
- All cycles
- 2024: R+2.0 2020: D+1.1 2016: R+5.0 2012: R+3.5 2008: D+2.2
Not yet ingested
- Civics
- —
Market trends
- HPI YoY
- ▼ -335.25%
- Current HPI
- 279.7875
- Rent YoY
- ▲ 1.64%
- Metro
- Salem, OR
- State GDP YoY
- ▲ 2.05%
- F500 in state
- 2
Industry mix (Fortune 500 HQ in OR)
| Industry | F500 HQs | Revenue |
|---|---|---|
| Consumer Goods | 1 | $51B |
|
||
Price history
+172.2% since first listed10 events — show timeline
- 2026-05-19 Listed $95,000 WVMLS
- 2014-09-30 Sold (MLS) $32,000 WVMLS
- 2014-09-23 Contingent — WVMLS
- 2014-09-17 Listed $32,000 WVMLS
- 2012-03-28 Listing Removed — WVMLS
- 2010-09-20 Listing Removed — WVMLS
- 2010-07-29 Price Changed $35,900 WVMLS
- 2010-04-15 Price Changed $39,900 WVMLS
- 2010-03-31 Listed $44,900 WVMLS
- 2005-10-24 Listed $34,900 WVMLS
Property tax history
+2.7%/yrLatest (2025): $939 · +7.7% YoY. Source: county tax records.
Cash-flow waterfall
monthlySold comps — $/sqft
last 12 mo · ≤1 miLoading sold comps…