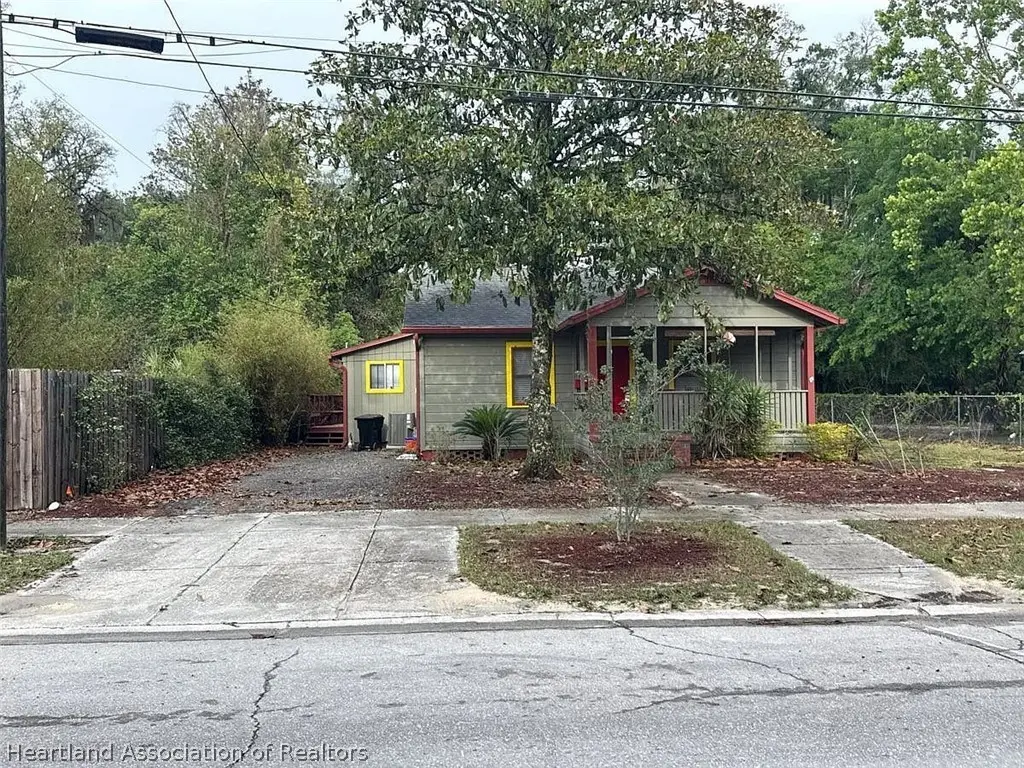
205 NE 9th St · Gainesville, FL
Flood risk 1/10 · Minimal
- FEMA flood zone
- X (unshaded)
- Chance of flooding over 30 yrs
- 0.0%
- Est. flood insurance / yr
- $507 – $1,088
Fire risk 4/10 · Minor
- Est. fire insurance / yr
- $947 – $1,759
Heat risk 8/10 · Major
- Hot days now (above 107°F)
- 7 days/yr
- Hot days in 30 yrs
- 21 days/yr
Wind risk 9/10 · Severe
- Chance of severe wind over 30 yrs
- 99.0%
Air-quality risk 3/10 · Minor
- Unhealthy air days now
- 3 days/yr
- Unhealthy air days in 30 yrs
- 3 days/yr
Risk factors via First Street. Map © Google.
Why this score? — see what drove the D+ grade
The composite is a weighted blend of 9 inputs, each scored 0–100. Each bar is that input's sub-score; the figure is the points it added to the 100-point composite (weight × sub-score).
- Cash flow +15.0/30.0
- ARV discount +7.5/15.0
- 1% rule +5.0/10.0
- DSCR +5.0/10.0
- Schools +4.3/10.0
- Livability +4.0/5.0
- Rent growth +3.8/5.0
- Condition / age +2.5/5.0
- Appreciation +0.0/10.0
$5,000
🖨 Deal sheet 📄 Offer letter ✓ Due diligence
Listing remarks MLS
This cute 3bd/1ba vintage cottage, located in an ideal downtown location of Gainesville (Doig & Robertson subdivision), is ready and waiting for you to add some TLC to its charm. The bedrooms and living area are spacious and bright. A cute kitchen leads to the separate laundry room which leads outside to a wood deck complete with built-in seating. The finished open front porch--complete with a swinging chair and rocking chair--offers the perfect place to sit and read a book, study, or even keep your favorite plants. A chain-link fence provides the perfect area to keep your dog secure and safe or just to offer you a sense of privacy without feeling closed in. A/C was installed in 2013 and has a transferrable extended warranty. The main branch library, UF, Shands, shopping, restaurants are all conveniently accessible within minutes. This is your opportunity to own a home located in the much desired Duck Pond area. Don''t let this one get away!
Key facts
- 9,583 sq ft lot
- Built 1941
- Listed 7 days
Property features AI
Finance
- Other: Zoning: RMF7
Exterior
- Parking: Driveway; On-street parking
- Utilities: Water: other source; Sewer: other
- Home design: Single-family residence; One story; Residential property
- Construction: Construction details: see remarks
- Exterior features: Front porch; Other roof
Interior
- Flooring: Other flooring
- Bathrooms: 1 full bathroom
- Heating & cooling: No heating; No cooling
- Interior features: Other flooring; One total room
Neighborhood map
What this means for you Summary
Snapshot
- This is a 3-bed/1.0-bath single-family listed at $5k.
Deal economics
- At list price, monthly cash flow is $1k ($15k/yr) — positive.
- The deal already cash-flows at list — no discount required.
- Meets the 1% rule at list price ($2k rent vs $5k).
Location & tenants
- Location reads 81/100 on livability (#97 in FL, #1,480 nationally) — a professional / high-income tenant draw. Strengths: amenities A+, commute A+, cost of living A+; Watch: employment D+, crime F.
- Alachua (urban): math 49% / reading 54% proficiency, ranked #30 of 73 in FL (top 41%) — acceptable for families but not a draw, mixed tenant base, ~2y average lease.
- Market conditions: Rents rising fast (+5.2%/yr); 138 active listings in the ZIP; lower-income renter base — watch delinquency; 1,774 units permitted in Alachua County in 2024 (984 in 5+ unit buildings).
- At $1,615/mo this rent would consume 64% of the median local household income ($30k/yr) (locally 3429% of renters already pay >50% of income on rent) — very limited rent-growth headroom before tenants either downsize or default.
Forward outlook
- Local home prices are declining (-3.0%/yr); year-one equity from $35 of loan paydown is wiped out by about $150 of value loss. Plan a longer hold.
- Alachua County population projected at +26% by 2050 — long-run rental-demand tailwind backs the buy-and-hold thesis.
- At projected returns (-3.0% appreciation + 5.2% rent growth), your $1k cash investment doubles in ~1 year — after that, you're playing with house money.
Negotiation context
- Only 8 days on market — expect competitive offers; lowballing is unlikely to land.
- 5 sale attempts since 23y ago with the ask held roughly flat each time — persistent listings suggest the price (not the market) is what's stuck; bring a comps-based counter.
Risks & watch-outs
- Watch-outs: property tax is 3.0% of price; built in 1941 — expect roof / HVAC / electrical / plumbing capex.
- Climate carrying-cost: severe wind risk, 99% chance of damaging wind over 30y; extreme-heat days projected 7→21/yr by 2055 (HVAC capex compounding) — expect insurance premiums to compound above CPI over the hold.
Questions for the listing agent
- Built in 1941 — when were the roof, HVAC, electrical panel, plumbing, and water heater last replaced?
- Property tax is high relative to price — has the assessment been appealed recently, and will the sale trigger a re-assessment?
- Is there a deadline driving the sale (1031 exchange, divorce, estate, relocation)? That informs how much negotiation room exists.
- Schools are B-rated — typically a magnet for longer-tenancy family renters. What's the average tenant stay here, and is there a school-zone premium baked into asking?
- Crime grade is F in this area — have there been break-ins, vandalism, or insurance claims at this property in the last 3 years? What carrier currently insures it and at what premium?
- The area grade is low — what's the realistic commute time and amenity access for the typical tenant pool here? Any planned neighborhood developments (good or bad) we should know about?
- What's the average days-on-market for RENTAL listings here right now (not sales)? A rising rental-DOM trend means longer vacancies and softer asking-rent achievability than the comps imply.
- What's the recent tenant-quality profile in this submarket — average credit score on applications, eviction rate, late-payment / NSF rate, and stable-employment percentage? A property-management company in the area should have these aggregated.
- How much new for-sale + rental construction is in the pipeline within 1–3 miles? Heavy new supply typically softens prices + rents 12–24 months out; constrained supply supports both.
Investment metrics
- 1% rule
- 32.30% ✓
- Cap rate
- 302.63%
- Cash-on-cash
- 1058.34%
- DSCR
- 48.09
- GRM
- 0.3
CMA / ARV
No comps found within radius.
Projected returns pro-forma
-3.0% appreciation · 5.24% rent growth · sell at horizon
- IRR
- —
- Equity multiple
- 59.27×
- Total profit
- $81,579
- Equity at exit
- $746
- IRR
- —
- Equity multiple
- 135.57×
- Total profit
- $188,400
- Equity at exit
- $432
Cash invested: $1,400 (down + closing). Projections, not guarantees.
Landlord ↔ Tenant lean methodology
- Overall (STATE)
- 87 Strongly Landlord-Friendly
- State Florida
- 87 Strongly Landlord-Friendly · R+3
- County
- — inherits STATE
- City
- — inherits STATE
ZIP-level market 32601
- Home prices YoY
- -27.7%
- Rents YoY
- 5.2%
- Active inventory
- 138
- Price-to-rent
- 0.3×
Monthly cashflow live
- Estimated rent
- $1,615 medium interval (Pro) →
- Mortgage (P&I)
- −$26
- Tax from tax record
- −$13 /mo · $152/yr
- Insurance
- −$2
- HOA
- −$0
- Vacancy / Maint / Mgmt
- −$339
- Net cashflow
- $1,235
Break-even live
UW: 25.0% down · 7.5% · 30yr · 1.5% tax · 5.0% vac · 8.0% maint · 8.0% mgmt
Financing live
Cash to close
- Down payment
- $1,250
- Closing costs
- $150
- Reserves months
- —
- Total cash needed
- —
Loan-product check · same deal, 3 products live
Conventional
25% down · 7.5% · 30yr
- Down + closing
- —
- Monthly P&I
- —
- Monthly cashflow
- —
- DSCR
- —
- Eligible?
- —
Personal DTI + credit; lowest rate.
DSCR
20% down · 8.5% · 30yr
- Down + closing
- —
- Monthly P&I
- —
- Monthly cashflow
- —
- DSCR
- —
- Eligible?
- —
No personal income docs; deal must DSCR.
Hard money
10% down · 12.0% · 12mo
- Down + closing
- —
- Monthly P&I
- —
- Monthly cashflow
- —
- DSCR
- —
- Eligible?
- —
Short-term bridge; refi at stabilization.
Listing history 7 events
-
2026-06-10days on market $5,000 Active 8 DOM
-
2026-06-09days on market $5,000 Active 7 DOM
-
2026-06-08days on market $5,000 Active 6 DOM
-
2026-06-07days on market $5,000 Active 5 DOM
-
2026-06-05days on market $5,000 Active 2 DOM
-
2026-06-03remarks 300-char remark
-
2026-06-03$5,000 Active 1 DOM
ⓘ Source: listings_history table (triggers on properties + properties_extension) + one-shot
backfill from property_details.listing_events for pre-trigger history.
Tax reassessment forecast FL · Resets to sale price
- Current annual tax
- $152 · $13/mo
- Projected year-2 tax
- $152 · $13/mo
- Expected delta
- $0/yr ($0/mo · 0.0%)
ⓘ Screening estimate from a state-policy table — verify with the county assessor before closing.
Climate risk First Street
- Flood 1/10 Low FEMA zone X (unshaded) · 0% chance over 30 yrs
- Wildfire 4/10 Moderate
- Heat 8/10 Severe 7 d/yr ≥107°F today · 21 d/yr by 30 yrs out
- Wind 9/10 Extreme 99% chance of damaging wind over 30 yrs
- Air quality 3/10 Moderate 3 unhealthy d/yr today · 3 by 30 yrs out
Nearby sold comps map
Loading sold comps map…
Walkable amenities ~0.75 mi
Loading nearby amenities…
Taxation est. · year 1
- Rental income
- $19,378
- − Mortgage interest
- −$280
- − Property taxes
- −$152
- − Insurance
- −$25
- − Repairs & maintenance
- −$1,550
- − Management
- −$1,550
- − Depreciation
- −$145
- Taxable income
- $15,675
- Est. tax owed @ 24.0%
- −$3,762
- After-tax cash flow
- $11,055/yr
For passive investors: Depreciation is non-cash, so a rental often shows a tax loss while cash-flowing — sheltering income. Rental losses are passive: they offset passive income freely, and up to $25,000/yr can offset ordinary (W-2) income if you actively participate and your MAGI is under $100k (phasing out to $0 by $150k); unused losses carry forward. On sale, claimed depreciation is recaptured at up to 25%, and gains may owe capital-gains tax (a 1031 exchange can defer both). Figures are a year-1 estimate at your 24.0% rate — not tax advice; consult a CPA.
Schools (NCES district)
- District
- Alachua
- NCES district ID
- 1200030
- Math proficiency
- 49% ▼ -9.00%
- Reading proficiency
- 54% ▼ -3.00%
- Median HH income
- $42,683
- Composite
- 43.31/100
- National rank
- #3038
- State rank
- #30 of 73 in FL
Livability — Gainesville
- Score
- 81/100
- State rank
- #97
- US rank
- #1480
Category grades
Schools grade is shown separately in the Schools card above.
Census & demographics
- Census place
- Gainesville, FL
- County
- Alachua County · 218,005 people
- City population
- 188,348
- Metro
- Gainesville, FL
- Population (ZIP)
- 23,180
- Household income
- $30,352
- Rent vs Own
- Severe rent burden
- 3429.0
Population outlook (Alachua County) Hauer SSP2
- Today (2025)
- 289,834 people
- By 2030
- 305,873 · +5.5%
- By 2040
- 335,246 · +15.7%
- By 2050
- 364,719 · +25.8%
- By 2075
- 436,665 · +50.7%
- By 2100
- 482,920 · +66.6%
Race, ethnicity, and origin ACS 2023
- Neighborhood character
- Diverse neighborhood (Simpson 0.56)
- Race & ethnicity
- White 64% Hispanic / Latino 13% Two or more races 12% Black 11% Asian 6%
- Hispanic origin (detail)
- Puerto Rican 2% Cuban 3%
- Common ancestry
- Romanian 3% Slovak 3% Scotch-Irish 2%
- Foreign-born
- 10% · Canada, China, Jamaica
- Languages at home
- 83% English-only · Spanish 10% Other Indo-European 3% German/W. Germanic 1%
Political lean MEDSL · Alachua
- 2024 margin
- Strong D (+21.0) · D 59.7% · R 38.8% · Other 1.5%
- 2008→2024 swing
- -0.6pp no change · 2008: 21.6pp · 2024: 21.0pp
- All cycles
- 2024: D+21.0 2020: D+27.2 2016: D+22.5 2012: D+17.3 2008: D+21.6
Not yet ingested
- Civics
- —
Market trends
- HPI YoY
- ▼ -125.81%
- Current HPI
- 327.9985
- Rent YoY
- ▲ 5.24%
- Metro
- Gainesville, FL
- State GDP YoY
- ▲ 3.28%
- F500 in state
- 36
Industry mix (Fortune 500 HQ in FL)
| Industry | F500 HQs | Revenue |
|---|---|---|
| Industrial Technology | 2 | $29B |
|
||
| Insurance | 2 | $17B |
|
||
| Retail | 1 | $60B |
|
||
| Technology Distribution | 1 | $58B |
|
||
| Homebuilding | 1 | $35B |
|
||
| Technology Manufacturing | 1 | $35B |
|
||
Price history
-82.6% since first listed19 events — show timeline
- 2026-06-02 Listed $5,000 HAOR as distributed by MLS GRID
- 2025-04-04 Listing Removed — Stellar MLS as Distributed by MLS Grid
- 2025-03-06 Relisted — Stellar MLS as Distributed by MLS Grid
- 2025-02-07 Pending — Stellar MLS as Distributed by MLS Grid
- 2025-01-31 Price Changed $299,900 Stellar MLS as Distributed by MLS Grid
- 2025-01-23 Price Changed $309,950 Stellar MLS as Distributed by MLS Grid
- 2025-01-07 Price Changed $315,000 Stellar MLS as Distributed by MLS Grid
- 2024-12-18 Price Changed $319,000 Stellar MLS as Distributed by MLS Grid
- 2024-12-07 Price Changed $329,000 Stellar MLS as Distributed by MLS Grid
- 2024-11-07 Listed $345,000 Stellar MLS as Distributed by MLS Grid
- 2023-02-22 Sold (Public Records) $269,900 Public Records
- 2022-01-11 Price Changed $1,650 RENT.
- 2021-01-29 Sold (Public Records) $143,000 Public Records
- 2021-01-27 Sold (MLS) $143,000 Stellar MLS as Distributed by MLS Grid
- 2020-12-30 Listed $145,000 Stellar MLS as Distributed by MLS Grid
- 2003-12-03 Sold (Public Records) $90,000 Public Records
- 2003-09-27 Listing Removed — Stellar MLS as Distributed by MLS Grid
- 2003-06-27 Listed $98,900 Stellar MLS as Distributed by MLS Grid
- 1987-12-01 Sold (Public Records) $28,800 Public Records
Property tax history
-20.5%/yrLatest (2025): $152 · +2.1% YoY. Source: county tax records.
Cash-flow waterfall
monthlySold comps — $/sqft
last 12 mo · ≤1 miLoading sold comps…