 11-Plex
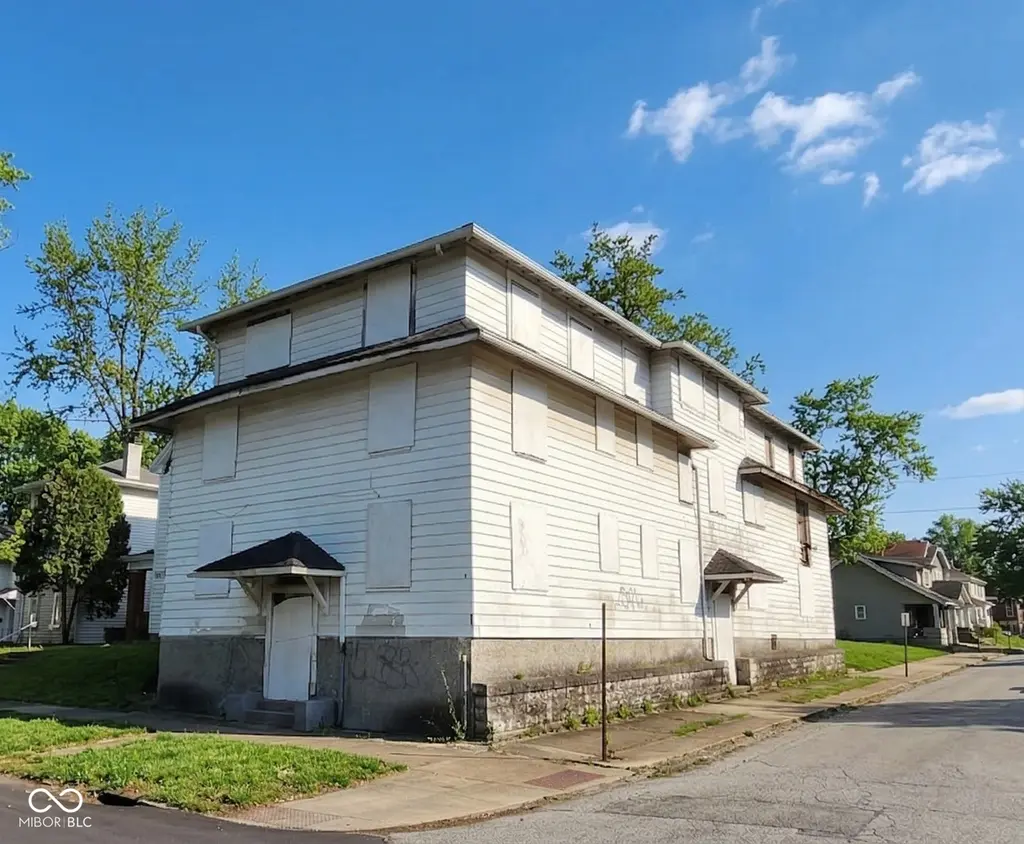
1525 N C St · Richmond, IN
Flood risk 8/10 · Major
- FEMA flood zone
- X (unshaded)
- Chance of flooding over 30 yrs
- 0.98%
- Est. flood insurance / yr
- $507 – $1,088
Fire risk 1/10 · Minimal
- Est. fire insurance / yr
- $717 – $1,331
Heat risk 3/10 · Minor
- Hot days now (above 100°F)
- 7 days/yr
- Hot days in 30 yrs
- 18 days/yr
Wind risk 2/10 · Minimal
- Chance of severe wind over 30 yrs
- 1.0%
Air-quality risk 3/10 · Minor
- Unhealthy air days now
- 2 days/yr
- Unhealthy air days in 30 yrs
- 3 days/yr
Risk factors via First Street. Map © Google.
Why this score? — see what drove the D grade
The composite is a weighted blend of 9 inputs, each scored 0–100. Each bar is that input's sub-score; the figure is the points it added to the 100-point composite (weight × sub-score).
- Cash flow +15.0/30.0
- ARV discount +7.5/15.0
- 1% rule +5.0/10.0
- DSCR +5.0/10.0
- Livability +4.2/5.0
- Rent growth +2.5/5.0
- Condition / age +2.5/5.0
- Schools +1.9/10.0
- Appreciation +0.0/10.0
$99,900
🖨 Deal sheet 📄 Offer letter ✓ Due diligence
Multi-family units
County records classify this as Multi-Family (5+ Unit). Listing-text estimate: 11 units. confirmed
5+ unit building — per-unit beds/baths from public records are typically unavailable; the breakdown below (if shown) is an estimate from the listing text.
Listing remarks MLS
Motivated pricing! Rare opportunity to acquire an 11-unit multifamily property at 1525 N C St in Richmond. This is a full rehab project with significant upside for the right investor. Ideal for experienced investors, flippers, or those looking to build long-term cash flow and equity. With the right vision and renovation plan, this property has the potential to be transformed into a high-performing asset. Located in a convenient area with access to local amenities, making it attractive for future tenants once completed. Bring your contractor, your plan, and capitalize on this large-scale value-add opportunity. Property is being sold as-is. * Some photos staged with Gemini to show the possibilities * *
Key facts
- Full rehab project
- 3,006 sq ft lot
- Built 1940
Tags
Property features AI
Finance
- Financial info: 12 total units; Gross income and expenses reported as zero
Exterior
- Utilities: Solid waste service available
- Home design: Residential income property (quadruplex); Three or more levels
- Construction: Less than 1/4 acre lot
- Exterior features: Street access with street cuts
Interior
- Kitchen: Kitchens present in units
- Bedrooms: Units include kitchens
- Interior features: Conversion: No
Neighborhood map
What this means for you Summary
Snapshot
- This is a 11 × 2-bed/1-bath units multifamily listed at $100k.
Deal economics
- At list price, monthly cash flow is $7k ($82k/yr) — positive. Per door: $624/mo.
- The deal already cash-flows at list — no discount required.
- Meets the 1% rule at list price ($10k rent vs $100k).
- Recommended offer: $94k (6.0% below list) — sets the bar for market timing.
- Cap rate 89.5% vs local median 5.2% in Richmond — top-decile yield for the area; either an underpriced asset or a hidden risk that comps aren't pricing in. Stress-test before assuming the spread holds.
Location & tenants
- Location reads 83/100 on livability (#10 in IN, #869 nationally) — a professional / high-income tenant draw. Strengths: commute A+, cost of living A+, housing A+; Watch: crime D+, schools D-, employment D-.
- Richmond Community Schools (town): math 18% / reading 27% proficiency, ranked #270 of 301 in IN (top 90%) — low school quality limits family demand, transient renter base, plan for 1-2y turnover; 65% free/reduced lunch — lower-income household profile, screen leases tightly.
- Market conditions: 273 active listings in the ZIP; 38 units permitted in Wayne County in 2024 (0 in 5+ unit buildings).
- At $9,642/mo this rent would consume 228% of the median local household income ($51k/yr) (locally 1600% of renters already pay >50% of income on rent) — very limited rent-growth headroom before tenants either downsize or default.
Forward outlook
- Local home prices are declining (-3.0%/yr); year-one equity from $691 of loan paydown is wiped out by about $3k of value loss. Plan a longer hold.
- Wayne County population projected at -21% by 2050 — secular population decline; favor cash flow + early exit over multi-decade hold.
- At projected returns (-3.0% appreciation + 3.0% rent growth), your $28k cash investment doubles in ~1 year — after that, you're playing with house money.
Negotiation context
- It's been on market 63 days — a 6% lower offer ($94k) is reasonable based on typical stale-listing flexibility.
- 2 sale attempts with the ask held roughly flat each time — persistent listings suggest the price (not the market) is what's stuck; bring a comps-based counter.
Risks & watch-outs
- Watch-outs: flood insurance adds $66/mo; built in 1940 — expect roof / HVAC / electrical / plumbing capex.
- Climate carrying-cost: severe flood risk — expect insurance premiums to compound above CPI over the hold.
Questions for the listing agent
- It's been on market 63 days. Have you received any prior offers? Is the seller open to a 6% concession, seller financing, or rate buy-down credit?
- Can we see the unit-by-unit rent roll, current vacancy, and any below-market leases? What's the average tenancy length?
- What capital expenditures (roof, boiler, parking lot, exteriors) have been made in the last 5 years, and what's planned in the next 2?
- Built in 1940 — when were the roof, HVAC, electrical panel, plumbing, and water heater last replaced?
- What's the actual annual flood-insurance premium (NFIP or private), and is the property in a SFHA with mandatory coverage?
- Why hasn't it sold? Are there any deal-killer items the seller is aware of (foundation, flood, title, zoning, code violations)?
- Is there a deadline driving the sale (1031 exchange, divorce, estate, relocation)? That informs how much negotiation room exists.
- Schools are D-rated, which usually means shorter tenancies and higher turnover. Who's the typical renter profile here, and what's been the actual vacancy rate?
- Crime grade is D in this area — have there been break-ins, vandalism, or insurance claims at this property in the last 3 years? What carrier currently insures it and at what premium?
- The area grade is low — what's the realistic commute time and amenity access for the typical tenant pool here? Any planned neighborhood developments (good or bad) we should know about?
- What's the average days-on-market for RENTAL listings here right now (not sales)? A rising rental-DOM trend means longer vacancies and softer asking-rent achievability than the comps imply.
- What's the recent tenant-quality profile in this submarket — average credit score on applications, eviction rate, late-payment / NSF rate, and stable-employment percentage? A property-management company in the area should have these aggregated.
- How much new apartment / multifamily construction is in the pipeline within 1–3 miles? Heavy new supply (>2% of stock underway) typically softens rents 12–24 months out; light construction supports rent growth.
Investment metrics
- 1% rule
- 9.65% ✓
- Cap rate
- 89.51%
- Cash-on-cash
- 297.19%
- DSCR
- 14.22
- GRM
- 0.9
CMA / ARV
No comps found within radius.
Projected returns pro-forma
-3.0% appreciation · 3.0% rent growth · sell at horizon
- IRR
- —
- Equity multiple
- 16.05×
- Total profit
- $420,981
- Equity at exit
- $14,895
- IRR
- —
- Equity multiple
- 34.25×
- Total profit
- $930,024
- Equity at exit
- $8,638
Cash invested: $27,972 (down + closing). Projections, not guarantees.
Landlord ↔ Tenant lean methodology
- Overall (STATE)
- 90 Strongly Landlord-Friendly
- State Indiana
- 90 Strongly Landlord-Friendly · R+11
- County
- — inherits STATE
- City
- — inherits STATE
ZIP-level market 47374
- Active inventory
- 273
- Price-to-rent
- 9.5×
Monthly cashflow live
- Estimated rent
- $9,642 medium interval (Pro) →
- Mortgage (P&I)
- −$524
- Tax from tax record
- −$124 /mo · $1,490/yr
- Insurance
- −$42
- Flood insurance flood zone
- −$66 /mo · $798/yr
- HOA
- −$0
- Vacancy / Maint / Mgmt
- −$2,025
- Net cashflow
- $6,861
Break-even live
11-unit breakdown (identical units grouped — click to expand)
| Units | Beds | Baths | Est. rent |
|---|---|---|---|
| 11× units | 2 | 1 | $9,647 |
| #1 | 2 | 1 | $877 |
| #2 | 2 | 1 | $877 |
| #3 | 2 | 1 | $877 |
| #4 | 2 | 1 | $877 |
| #5 | 2 | 1 | $877 |
| #6 | 2 | 1 | $877 |
| #7 | 2 | 1 | $877 |
| #8 | 2 | 1 | $877 |
| #9 | 2 | 1 | $877 |
| #10 | 2 | 1 | $877 |
| #11 | 2 | 1 | $877 |
| Total (11 units) | $9,642 | ||
UW: 25.0% down · 7.5% · 30yr · 1.5% tax · 5.0% vac · 8.0% maint · 8.0% mgmt
Financing live
Cash to close
- Down payment
- $24,975
- Closing costs
- $2,997
- Reserves months
- —
- Total cash needed
- —
Loan-product check · same deal, 3 products live
Conventional
25% down · 7.5% · 30yr
- Down + closing
- —
- Monthly P&I
- —
- Monthly cashflow
- —
- DSCR
- —
- Eligible?
- —
Personal DTI + credit; lowest rate.
DSCR
20% down · 8.5% · 30yr
- Down + closing
- —
- Monthly P&I
- —
- Monthly cashflow
- —
- DSCR
- —
- Eligible?
- —
No personal income docs; deal must DSCR.
Hard money
10% down · 12.0% · 12mo
- Down + closing
- —
- Monthly P&I
- —
- Monthly cashflow
- —
- DSCR
- —
- Eligible?
- —
Short-term bridge; refi at stabilization.
Listing history 18 events
-
2026-06-19days on market $99,900 Active 63 DOM
-
2026-06-18days on market $99,900 Active 62 DOM
-
2026-06-17days on market $99,900 Active 61 DOM
-
2026-06-16days on market $99,900 Active 60 DOM
-
2026-06-15days on market $99,900 Active 59 DOM
-
2026-06-14days on market $99,900 Active 57 DOM
-
2026-06-12days on market $99,900 Active 56 DOM
-
2026-06-09days on market $99,900 Active 53 DOM
-
2026-06-08days on market $99,900 Active 52 DOM
-
2026-06-07days on market $99,900 Active 51 DOM
-
2026-06-03days on market $99,900 Active 47 DOM
-
2026-06-02days on market $99,900 Active 46 DOM
-
2026-06-01days on market $99,900 Active 45 DOM
-
2026-05-31days on market $99,900 Active 44 DOM
-
2026-05-30days on market $99,900 Active 43 DOM
-
2026-05-20price $89,900 710-char remark
Show marketing remark (710 chars)
Motivated pricing! Rare opportunity to acquire an 11-unit multifamily property at 1525 N C St in Richmond. This is a full rehab project with significant upside for the right investor. Ideal for experienced investors, flippers, or those looking to build long-term cash flow and equity. With the right vision and renovation plan, this property has the potential to be transformed into a high-performing asset. Located in a convenient area with access to local amenities, making it attractive for future tenants once completed. Bring your contractor, your plan, and capitalize on this large-scale value-add opportunity. Property is being sold as-is. * Some photos staged with Gemini to show the possibilities * *
-
2026-04-17$99,900 Active
-
2026-03-25$99,900 Active 710-char remark
Show marketing remark (710 chars)
Motivated pricing! Rare opportunity to acquire an 11-unit multifamily property at 1525 N C St in Richmond. This is a full rehab project with significant upside for the right investor. Ideal for experienced investors, flippers, or those looking to build long-term cash flow and equity. With the right vision and renovation plan, this property has the potential to be transformed into a high-performing asset. Located in a convenient area with access to local amenities, making it attractive for future tenants once completed. Bring your contractor, your plan, and capitalize on this large-scale value-add opportunity. Property is being sold as-is. * Some photos staged with Gemini to show the possibilities * *
ⓘ Source: listings_history table (triggers on properties + properties_extension) + one-shot
backfill from property_details.listing_events for pre-trigger history.
Tax reassessment forecast IN · Partial reset (capped growth)
- Current annual tax
- $1,490 · $124/mo
- Projected year-2 tax
- $1,490 · $124/mo
- Expected delta
- $0/yr ($0/mo · 0.0%)
ⓘ Screening estimate from a state-policy table — verify with the county assessor before closing.
Climate risk First Street
- Flood 8/10 Severe FEMA zone X (unshaded) · 98% chance over 30 yrs
- Wildfire 1/10 Low
- Heat 3/10 Moderate 7 d/yr ≥100°F today · 18 d/yr by 30 yrs out
- Wind 2/10 Low 100% chance of damaging wind over 30 yrs
- Air quality 3/10 Moderate 2 unhealthy d/yr today · 3 by 30 yrs out
Nearby sold comps map
Loading sold comps map…
Walkable amenities ~0.75 mi
Loading nearby amenities…
Taxation est. · year 1
- Rental income
- $115,704
- − Mortgage interest
- −$5,596
- − Property taxes
- −$1,490
- − Insurance
- −$1,297
- − Repairs & maintenance
- −$9,256
- − Management
- −$9,256
- − Depreciation
- −$2,906
- Taxable income
- $85,902
- Est. tax owed @ 24.0%
- −$20,617
- After-tax cash flow
- $61,716/yr
For passive investors: Depreciation is non-cash, so a rental often shows a tax loss while cash-flowing — sheltering income. Rental losses are passive: they offset passive income freely, and up to $25,000/yr can offset ordinary (W-2) income if you actively participate and your MAGI is under $100k (phasing out to $0 by $150k); unused losses carry forward. On sale, claimed depreciation is recaptured at up to 25%, and gains may owe capital-gains tax (a 1031 exchange can defer both). Figures are a year-1 estimate at your 24.0% rate — not tax advice; consult a CPA.
Schools (NCES district)
- District
- Richmond Community Schools
- NCES district ID
- 1809510
- Math proficiency
- 18% ▼ -7.00%
- Reading proficiency
- 27% ▼ -2.00%
- Median HH income
- $35,288
- Composite
- 18.55/100
- National rank
- #8913
- State rank
- #270 of 301 in IN
Livability — Richmond
- Score
- 83/100
- State rank
- #10
- US rank
- #869
Category grades
Schools grade is shown separately in the Schools card above.
Census & demographics
- Census place
- Richmond, IN
- County
- Wayne County · 44,615 people
- City population
- 44,615
- Metro
- Richmond, IN
- Population (ZIP)
- 44,615
- Household income
- $50,766
- Rent vs Own
- Severe rent burden
- 1600.0
Population outlook (Wayne County) Hauer SSP2
- Today (2025)
- 63,316 people
- By 2030
- 60,893 · -3.8%
- By 2040
- 55,386 · -12.5%
- By 2050
- 49,946 · -21.1%
- By 2075
- 37,900 · -40.1%
- By 2100
- 26,562 · -58.0%
Race, ethnicity, and origin ACS 2023
- Neighborhood character
- Predominantly White (82%)
- Race & ethnicity
- White 82% Two or more races 7% Black 6% Hispanic / Latino 4% Asian 1%
- Common ancestry
- Slovak 2% Italian 1% Lithuanian 1%
- Foreign-born
- 4% · Canada, China
- Languages at home
- 95% English-only · Spanish 3%
Political lean MEDSL · Wayne
- 2024 margin
- Solid R (+32.5) · D 32.9% · R 65.4% · Other 1.6%
- 2008→2024 swing
- -28.6pp toward R · 2008: -3.9pp · 2024: -32.5pp
- All cycles
- 2024: R+32.5 2020: R+29.1 2016: R+30.1 2012: R+14.7 2008: R+3.9
Not yet ingested
- Civics
- —
Market trends
- HPI YoY
- ▼ -118.64%
- Current HPI
- 182.5038
- Rent YoY
- —
- Metro
- Richmond, IN
- State GDP YoY
- ▲ 2.90%
- F500 in state
- 18
Industry mix (Fortune 500 HQ in IN)
| Industry | F500 HQs | Revenue |
|---|---|---|
| Industrial Machinery | 2 | $37B |
|
||
| Healthcare | 1 | $177B |
|
||
| Pharmaceuticals | 1 | $45B |
|
||
| Metals / Steel | 1 | $18B |
|
||
| Agriculture | 1 | $17B |
|
||
| Packaging | 1 | $12B |
|
||
Price history
-10.0% since first listed3 events — show timeline
- 2026-05-20 Price Changed $89,900 RRELMS
- 2026-04-17 Listed $99,900 MIBOR as Distributed by MLS Grid
- 2026-03-25 Listed $99,900 RRELMS
Property tax history
-4.2%/yrLatest (2024): $1,490 · +5.8% YoY. Source: county tax records.
Cash-flow waterfall
monthlySold comps — $/sqft
last 12 mo · ≤1 miLoading sold comps…