2958 Vineyards Pkwy #5 · Branson, MO
Flood risk 1/10 · Minimal
- FEMA flood zone
- X (unshaded)
- Chance of flooding over 30 yrs
- 0.0%
- Est. flood insurance / yr
- $473 – $860
Fire risk 3/10 · Minor
- Est. fire insurance / yr
- $1,054 – $1,958
Heat risk 5/10 · Moderate
- Hot days now (above 106°F)
- 7 days/yr
- Hot days in 30 yrs
- 20 days/yr
Wind risk 2/10 · Minimal
- Chance of severe wind over 30 yrs
- 1.0%
Air-quality risk 2/10 · Minimal
- Unhealthy air days now
- 0 days/yr
- Unhealthy air days in 30 yrs
- 1 days/yr
Risk factors via First Street. Map © Google.
Why this score? — see what drove the C- grade
The composite is a weighted blend of 9 inputs, each scored 0–100. Each bar is that input's sub-score; the figure is the points it added to the 100-point composite (weight × sub-score).
- Cash flow +15.9/30.0
- ARV discount +15.0/15.0
- 1% rule +5.0/10.0
- DSCR +4.9/10.0
- Schools +4.2/10.0
- Livability +3.9/5.0
- Rent growth +3.2/5.0
- Condition / age +2.5/5.0
- Appreciation +0.0/10.0
$183,000
🖨 Deal sheet (PDF) 📄 Offer letter ✓ Due diligence
Listing remarks MLS
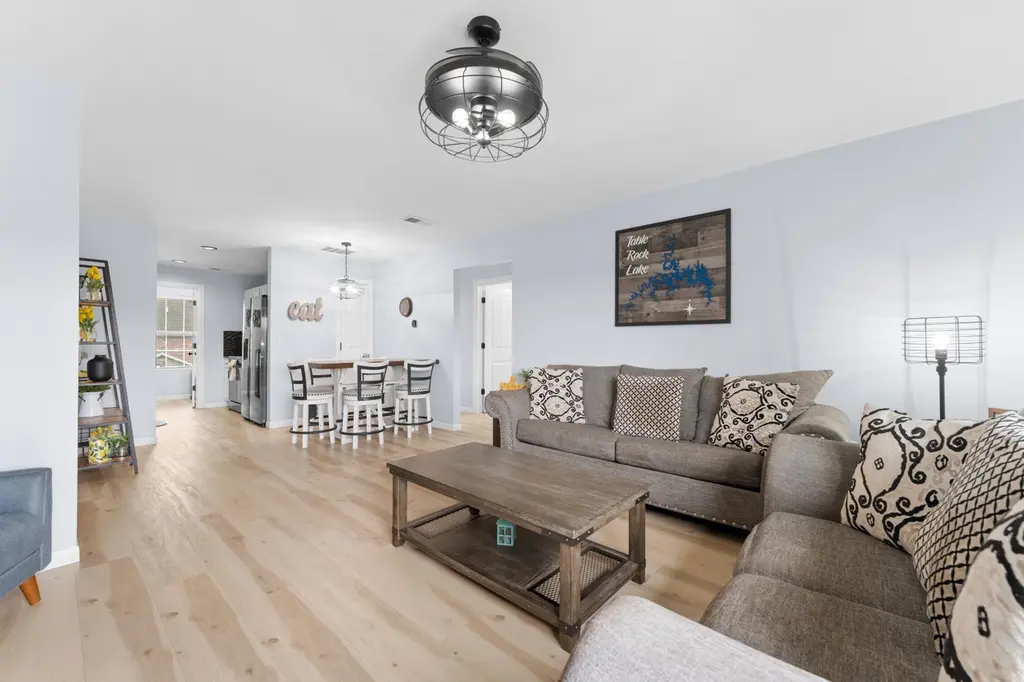
Absolute stunner at a great price! Renovated floor-to-ceiling with high-end EVERYTHING! Granite countertops, luxury vinyl floors, black stainless appliances, and custom bathrooms to match. All furniture and decor included!
Key facts
- $265 HOA
- Pool
- Built 2007
Neighborhood map
What this means for you Summary
Snapshot
- This is a 3-bed/2.0-bath condo listed at $183k.
Deal economics
- At list price, monthly cash flow is $88 ($1k/yr) — positive.
- The deal already cash-flows at list — no discount required.
- Meets the 1% rule at list price ($2k rent vs $183k).
- Recommended offer: $161k (12.0% below list) — sets the bar for market timing.
- Cap rate 6.9% vs local median 2.5% in Branson — top-decile yield for the area; either an underpriced asset or a hidden risk that comps aren't pricing in. Stress-test before assuming the spread holds.
Location & tenants
- Location reads 77/100 on livability (#32 in MO, #2,940 nationally) — a middle-class / working-renter tenant base. Strengths: commute A+, cost of living A+, health & safety A+; Watch: employment C-, crime F.
- Branson R-IV (rural): math 48% / reading 52% proficiency, ranked #44 of 324 in MO (top 14%) — acceptable for families but not a draw, mixed tenant base, ~2y average lease.
- Market conditions: Rents rising (+2.9%/yr); 1048 active listings in the ZIP; 5 comparable units currently listed for rent nearby; rentals lingering (median 44d on market — plan ~5-8 weeks vacancy on turnover, expect pricing pressure); 100% of comp listings sitting > 30 days — soft ceiling on asking rent; 331 units permitted in Taney County in 2024 (50 in 5+ unit buildings).
- This rent runs 36% of the median local income ($60k/yr) — at the standard rent-burdened threshold; future hikes will face affordability resistance.
Forward outlook
- Local home prices are declining (-3.0%/yr); year-one equity from $1k of loan paydown is wiped out by about $5k of value loss. Plan a longer hold.
- Taney County population projected at +17% by 2050 — long-run rental-demand tailwind backs the buy-and-hold thesis.
Negotiation context
- It's been on market 143 days — a 12% lower offer ($161k) is reasonable based on typical stale-listing flexibility.
- 2 sale attempts since 2y ago with the ask held roughly flat each time — persistent listings suggest the price (not the market) is what's stuck; bring a comps-based counter.
Risks & watch-outs
- Climate carrying-cost: extreme-heat days projected 7→20/yr by 2055 (HVAC capex compounding) — expect insurance premiums to compound above CPI over the hold.
Questions for the listing agent
- It's been on market 143 days. Have you received any prior offers? Is the seller open to a 12% concession, seller financing, or rate buy-down credit?
- What does the HOA fee cover, when was the last increase, and are there any pending special assessments or reserve-fund shortfalls?
- Any open or pending special assessments — roof, HVAC, plumbing, elevator, façade? What's the per-unit balance and payoff schedule, and is the seller paying it off at close or rolling it to the buyer?
- Why hasn't it sold? Are there any deal-killer items the seller is aware of (foundation, flood, title, zoning, code violations)?
- Is there a deadline driving the sale (1031 exchange, divorce, estate, relocation)? That informs how much negotiation room exists.
- Crime grade is F in this area — have there been break-ins, vandalism, or insurance claims at this property in the last 3 years? What carrier currently insures it and at what premium?
- What's the average days-on-market for RENTAL listings here right now (not sales)? A rising rental-DOM trend means longer vacancies and softer asking-rent achievability than the comps imply.
- What's the recent tenant-quality profile in this submarket — average credit score on applications, eviction rate, late-payment / NSF rate, and stable-employment percentage? A property-management company in the area should have these aggregated.
- How much new apartment / multifamily construction is in the pipeline within 1–3 miles? Heavy new supply (>2% of stock underway) typically softens rents 12–24 months out; light construction supports rent growth.
Investment metrics
- 1% rule
- 1.00% ✓
- Cap rate
- 6.87%
- Cash-on-cash
- 2.05%
- DSCR
- 1.09
- GRM
- 8.3
CMA / ARV
- ARV (median comp)
- $222,923
- List price
- $183,000
- Delta
- -17.91%
- Verdict
- UNDERPRICED
- Comps
- 20 within 1.0 mi
Projected returns pro-forma
-3.0% appreciation · 2.9% rent growth · sell at horizon
- IRR
- -13.1%
- Equity multiple
- 0.53×
- Total profit
- $-24,165
- Equity at exit
- $27,286
- IRR
- -4.2%
- Equity multiple
- 0.72×
- Total profit
- $-14,246
- Equity at exit
- $15,822
Cash invested: $51,240 (down + closing). Projections, not guarantees.
Landlord ↔ Tenant lean methodology
- Overall (STATE)
- 81 Strongly Landlord-Friendly
- State Missouri
- 81 Strongly Landlord-Friendly · R+10
- County
- — inherits STATE
- City
- — inherits STATE
ZIP-level market 65616
- Home prices YoY
- -24.3%
- Rents YoY
- 2.9%
- Active inventory
- 1048
- Price-to-rent
- 8.3×
Monthly cashflow live
- Estimated rent
- $1,839 high interval (Pro) →
- Mortgage (P&I)
- −$960
- Tax from tax record
- −$64 /mo · $769/yr
- Insurance
- −$76
- HOA
- −$265
- Vacancy / Maint / Mgmt
- −$386
- Net cashflow
- $88
Break-even live
Sensitivity live
| Price | -10% $191 | -5% $139 | +0% $88 | +5% $36 | +10% $-16 |
|---|---|---|---|---|---|
| Rent | -10% $-58 | -5% $15 | +0% $88 | +5% $160 | +10% $233 |
| Rate | -1.0pp $180 | -0.5pp $134 | base $88 | +0.5pp $40 | +1.0pp $-8 |
UW: 25.0% down · 7.5% · 30yr · 1.5% tax · 5.0% vac · 8.0% maint · 8.0% mgmt
Financing live
Cash to close
- Down payment
- $45,750
- Closing costs
- $5,490
- Reserves months
- —
- Total cash needed
- —
Loan-product check · same deal, 3 products live
Conventional
25% down · 7.5% · 30yr
- Down + closing
- —
- Monthly P&I
- —
- Monthly cashflow
- —
- DSCR
- —
- Eligible?
- —
Personal DTI + credit; lowest rate.
DSCR
20% down · 8.5% · 30yr
- Down + closing
- —
- Monthly P&I
- —
- Monthly cashflow
- —
- DSCR
- —
- Eligible?
- —
No personal income docs; deal must DSCR.
Hard money
10% down · 12.0% · 12mo
- Down + closing
- —
- Monthly P&I
- —
- Monthly cashflow
- —
- DSCR
- —
- Eligible?
- —
Short-term bridge; refi at stabilization.
Rent comps 5 comps
| Address | Beds | Baths | Sqft | Rent | $/sqft | DOM | Units | Dist |
|---|---|---|---|---|---|---|---|---|
| 2905 Vineyards Pkwy #5 Branson, MO | 3.0 | 2.0 | 1147 | $1,850 | $1.61 | 44d | 1 | 0.05mi |
| 2907 Vineyards Pkwy #2 Branson, MO | 3.0 | 2.0 | 1147 | $1,850 | $1.61 | 44d | 1 | 0.05mi |
| 3515 Arlene St Branson, MO | 2.0 | 2.0 | 880 | $1,025 | $1.16 | 44d | 1 | 0.66mi |
| 513 Lakewood Rd Branson, MO | 3.0 | 3.0 | 1487 | $1,750 | $1.18 | 44d | 1 | 1.10mi |
| 325 Majestic Dr Branson, MO | 1.0–3.0 | 1.0–2.0 | 941 | $1,650 | $1.75 | 44d | 2 | 1.35mi |
HOA detail condo
- Monthly dues
- $265 · $3,180/yr
- Assessments
- None detected in remarks — confirm with the listing agent.
Listing history 21 events
-
2026-06-19days on market $183,000 Active 143 DOM
-
2026-06-18days on market $183,000 Active 142 DOM
-
2026-06-17days on market $183,000 Active 141 DOM
-
2026-06-16days on market $183,000 Active 140 DOM
-
2026-06-15days on market $183,000 Active 139 DOM
-
2026-06-14days on market $183,000 Active 137 DOM
-
2026-06-12days on market $183,000 Active 136 DOM
-
2026-06-09days on market $183,000 Active 133 DOM
-
2026-06-08days on market $183,000 Active 132 DOM
-
2026-06-07days on market $183,000 Active 131 DOM
-
2026-06-03days on market $183,000 Active 127 DOM
-
2026-06-02days on market $183,000 Active 126 DOM
-
2026-06-01days on market $183,000 Active 125 DOM
-
2026-05-31days on market $183,000 Active 124 DOM
-
2026-05-30days on market $183,000 Active 123 DOM
-
2026-05-12price $183,000 222-char remark
Show marketing remark (222 chars)
Absolute stunner at a great price! Renovated floor-to-ceiling with high-end EVERYTHING! Granite countertops, luxury vinyl floors, black stainless appliances, and custom bathrooms to match. All furniture and decor included!
-
2026-04-20price $184,000 222-char remark
Show marketing remark (222 chars)
Absolute stunner at a great price! Renovated floor-to-ceiling with high-end EVERYTHING! Granite countertops, luxury vinyl floors, black stainless appliances, and custom bathrooms to match. All furniture and decor included!
-
2026-01-27$184,900 Active 222-char remark
Show marketing remark (222 chars)
Absolute stunner at a great price! Renovated floor-to-ceiling with high-end EVERYTHING! Granite countertops, luxury vinyl floors, black stainless appliances, and custom bathrooms to match. All furniture and decor included!
-
2025-02-14price $204,900
-
2024-11-13$212,500 Active
-
2024-02-20soldstatus
ⓘ Source: listings_history table (triggers on properties + properties_extension) + one-shot
backfill from property_details.listing_events for pre-trigger history.
Tax reassessment forecast MO · Resets to sale price
- Current annual tax
- $769 · $64/mo
- Projected year-2 tax
- $1,775 · $148/mo
- Expected delta
- +$1,007/yr (+$84/mo · 131.0%)
ⓘ Screening estimate from a state-policy table — verify with the county assessor before closing.
Climate risk First Street
- Flood 1/10 Low FEMA zone X (unshaded) · 0% chance over 30 yrs
- Wildfire 3/10 Moderate
- Heat 5/10 Major 7 d/yr ≥106°F today · 20 d/yr by 30 yrs out
- Wind 2/10 Low 100% chance of damaging wind over 30 yrs
- Air quality 2/10 Low 0 unhealthy d/yr today · 1 by 30 yrs out
Nearby sold comps map
Loading sold comps map…
Walkable amenities ~0.75 mi
Loading nearby amenities…
Taxation est. · year 1
- Rental income
- $22,065
- − Mortgage interest
- −$10,251
- − Property taxes
- −$769
- − Insurance
- −$915
- − Repairs & maintenance
- −$1,765
- − Management
- −$1,765
- − HOA
- −$3,180
- − Depreciation
- −$5,324
- Taxable loss
- −$1,903
- Est. tax savings @ 24.0%
- +$457
- After-tax cash flow
- $1,509/yr
For passive investors: Depreciation is non-cash, so a rental often shows a tax loss while cash-flowing — sheltering income. Rental losses are passive: they offset passive income freely, and up to $25,000/yr can offset ordinary (W-2) income if you actively participate and your MAGI is under $100k (phasing out to $0 by $150k); unused losses carry forward. On sale, claimed depreciation is recaptured at up to 25%, and gains may owe capital-gains tax (a 1031 exchange can defer both). Figures are a year-1 estimate at your 24.0% rate — not tax advice; consult a CPA.
Schools (NCES district)
- District
- Branson R-IV
- NCES district ID
- 2905760
- Math proficiency
- 48% ▼ -6.00%
- Reading proficiency
- 52% ▼ -3.00%
- Median HH income
- $41,473
- Composite
- 41.96/100
- National rank
- #3347
- State rank
- #44 of 324 in MO
Livability — Branson
- Score
- 77/100
- State rank
- #32
- US rank
- #2940
Category grades
Schools grade is shown separately in the Schools card above.
Census & demographics
- Census place
- Branson, MO
- County
- Taney County · 28,460 people
- City population
- 28,460
- Metro
- Branson, MO
- Population (ZIP)
- 28,460
- Household income
- $60,489
- Rent vs Own
- Severe rent burden
- 1065.0
Population outlook (Taney County) Hauer SSP2
- Today (2025)
- 59,017 people
- By 2030
- 61,235 · +3.8%
- By 2040
- 65,225 · +10.5%
- By 2050
- 68,842 · +16.6%
- By 2075
- 77,705 · +31.7%
- By 2100
- 82,002 · +38.9%
Race, ethnicity, and origin ACS 2023
- Neighborhood character
- Predominantly White (82%)
- Race & ethnicity
- White 82% Two or more races 10% Hispanic / Latino 10% Black 2% Asian 2%
- Hispanic origin (detail)
- Mexican 6% Puerto Rican 2%
- Common ancestry
- Italian 4% Lithuanian 3% Slovak 2%
- Foreign-born
- 5% · Canada
- Languages at home
- 89% English-only · Spanish 7% Other Indo-European 1% Russian/Polish/Slavic 1%
Political lean MEDSL · Taney
- 2024 margin
- Solid R (+59.3) · D 19.9% · R 79.2%
- 2008→2024 swing
- -22.2pp toward R · 2008: -37.2pp · 2024: -59.3pp
- All cycles
- 2024: R+59.3 2020: R+57.7 2016: R+59.3 2012: R+47.4 2008: R+37.2
Not yet ingested
- Civics
- —
Market trends
- HPI YoY
- ▼ -64.45%
- Current HPI
- 200.8392
- Rent YoY
- ▲ 2.90%
- Metro
- Branson, MO
- State GDP YoY
- ▲ 1.84%
- F500 in state
- 20
Industry mix (Fortune 500 HQ in MO)
| Industry | F500 HQs | Revenue |
|---|---|---|
| Healthcare | 1 | $163B |
|
||
| Insurance | 1 | $21B |
|
||
| Industrial Technology | 1 | $17B |
|
||
| Retail | 1 | $16B |
|
||
| Industrial Distribution | 1 | $10B |
|
||
| Utilities | 1 | $9B |
|
||
Price history
-13.9% since first listed6 events — show timeline
- 2026-05-12 Price Changed $183,000 SOMO
- 2026-04-20 Price Changed $184,000 SOMO
- 2026-01-27 Listed $184,900 SOMO
- 2025-02-14 Price Changed $204,900 SOMO
- 2024-11-13 Listed $212,500 SOMO
- 2024-02-20 Sold (Public Records) — Public Records
Property tax history
+5.0%/yrLatest (2025): $769 · -5.5% YoY. Source: county tax records.
Cash-flow waterfall
monthlySold comps — $/sqft
last 12 mo · ≤1 miLoading sold comps…