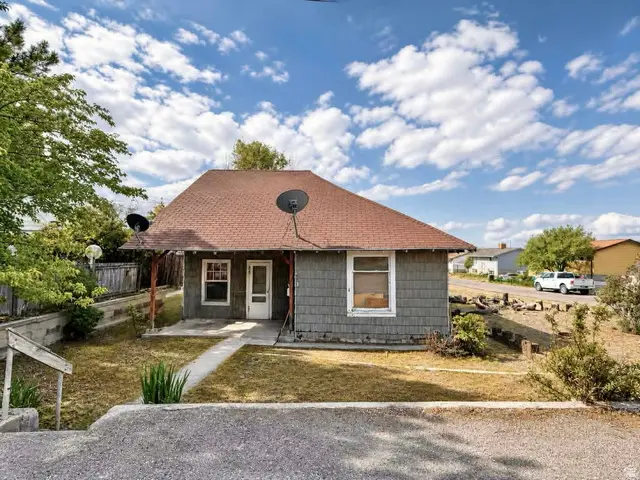
185 W 200 N · Price, UT
Flood risk 1/10 · Minimal
- FEMA flood zone
- X (unshaded)
- Chance of flooding over 30 yrs
- 0.0%
- Est. flood insurance / yr
- $473 – $860
Fire risk 6/10 · Moderate
- Est. fire insurance / yr
- $453 – $841
Heat risk 3/10 · Minor
- Hot days now (above 93°F)
- 4 days/yr
- Hot days in 30 yrs
- 10 days/yr
Wind risk 1/10 · Minimal
- Chance of severe wind over 30 yrs
- —
Air-quality risk 2/10 · Minimal
- Unhealthy air days now
- 1 days/yr
- Unhealthy air days in 30 yrs
- 2 days/yr
Risk factors via First Street. Map © Google.
Why this score? — see what drove the C grade
The composite is a weighted blend of 9 inputs, each scored 0–100. Each bar is that input's sub-score; the figure is the points it added to the 100-point composite (weight × sub-score).
- Cash flow +24.7/30.0
- DSCR +8.0/10.0
- ARV discount +7.5/15.0
- 1% rule +6.4/10.0
- Livability +3.5/5.0
- Schools +3.4/10.0
- Rent growth +2.5/5.0
- Condition / age +1.0/5.0
- Appreciation +0.0/10.0
$110,000
🖨 Deal sheet 📄 Offer letter ✓ Due diligence
Listing remarks
Investor special in the heart of Price. Located at 185 W 200 N, this property is a true fixer-upper with potential for the right buyer. The home offers a functional layout with multiple bedrooms, a spacious living area, and a large attic space that could be reimagined for additional use. This property is in need of significant renovation and is being sold as-is, making it ideal for investors, flippers, or buyers looking to build equity through improvements. With some vision and work, this could be transformed into a great primary residence, rental, or project home. Square footage figures are provided as a courtesy estimate only and were obtained from Cubicasa . Buyer is advised to obtain an
Key facts
- Large attic space
- Functional layout
- 9,583 sq ft lot
Tags
Property features AI
Exterior
- Utilities: Natural gas available; Electricity available; Sewer available; Culinary (public) water available
- Home design: Bungalow/Cottage style; Single-family property; Built and currently standing
- Construction: Above-grade finished living area approximately 1543; Built/standing construction
- Exterior features: Lot is 0.22 acres; Zoned for single-family use
Interior
- Bedrooms: 3 main-level bedrooms
- Bathrooms: 1 full bathroom
- Heating & cooling: Gas central heating
- Interior features: Total of 7 rooms; No basement; No special window features listed
Neighborhood map
What this means for you Summary
Snapshot
- This is a 3-bed/1.0-bath single-family listed at $110k. Condition is rated poor.
Deal economics
- At list price, monthly cash flow is $229 ($3k/yr) — positive.
- The deal already cash-flows at list — no discount required.
- Meets the 1% rule at list price ($1k rent vs $110k).
- Recommended offer: $108k (1.5% below list) — sets the bar for market timing.
Location & tenants
- Location reads 69/100 on livability (#102 in UT) — a middle-class / working-renter tenant base. Strengths: cost of living A+, housing A+, crime A; Watch: amenities F, commute F, employment F.
- Carbon District (town): math 36% / reading 43% proficiency, ranked #53 of 80 in UT (top 66%) — families likely to look elsewhere, expect single-tenant / working-renter base with shorter leases.
- Zoned schools: Castle Heights School (math 50% / reading 43%, grade D-, #215 of 585 statewide, top 37%, 422 students, 46% FRL); Mont Harmon Middle (math 36% / reading 44%, grade F, #72 of 138 statewide, top 53%, 601 students, 45% FRL); Carbon High (math 17% / reading 42%, grade F, #124 of 171 statewide, top 74%, 1,023 students, 34% FRL) — zoned schools at 42% FRL track the district average.
- Market conditions: 146 active listings in the ZIP; 2 comparable units currently listed for rent nearby; 196 units permitted in Carbon County in 2024 (168 in 5+ unit buildings).
Forward outlook
- Local home prices are declining (-3.0%/yr); year-one equity from $761 of loan paydown is wiped out by about $3k of value loss. Plan a longer hold.
- Carbon County population projected at -22% by 2050 — secular population decline; favor cash flow + early exit over multi-decade hold.
Negotiation context
- It's been on market 18 days — a 2% lower offer ($108k) is reasonable based on typical stale-listing flexibility.
Risks & watch-outs
- Watch-outs: built in 1916 — expect roof / HVAC / electrical / plumbing capex.
- Climate carrying-cost: major wildfire risk — expect insurance premiums to compound above CPI over the hold.
Questions for the listing agent
- Have any recent inspections been done? Can we get a copy of the seller's disclosures and any deferred-maintenance estimates?
- Built in 1916 — when were the roof, HVAC, electrical panel, plumbing, and water heater last replaced?
- Is there a deadline driving the sale (1031 exchange, divorce, estate, relocation)? That informs how much negotiation room exists.
- What's the average days-on-market for RENTAL listings here right now (not sales)? A rising rental-DOM trend means longer vacancies and softer asking-rent achievability than the comps imply.
- What's the recent tenant-quality profile in this submarket — average credit score on applications, eviction rate, late-payment / NSF rate, and stable-employment percentage? A property-management company in the area should have these aggregated.
- How much new for-sale + rental construction is in the pipeline within 1–3 miles? Heavy new supply typically softens prices + rents 12–24 months out; constrained supply supports both.
Investment metrics
- 1% rule
- 1.14% ✓
- Cap rate
- 8.80%
- Cash-on-cash
- 8.94%
- DSCR
- 1.40
- GRM
- 7.3
CMA / ARV
No comps found within radius.
Projected returns pro-forma
-3.0% appreciation · 3.0% rent growth · sell at horizon
- IRR
- -2.8%
- Equity multiple
- 0.90×
- Total profit
- $-3,193
- Equity at exit
- $16,401
- IRR
- 7.0%
- Equity multiple
- 1.52×
- Total profit
- $16,113
- Equity at exit
- $9,511
Cash invested: $30,800 (down + closing). Projections, not guarantees.
Landlord ↔ Tenant lean methodology
- Overall (STATE)
- 86 Strongly Landlord-Friendly
- State Utah
- 86 Strongly Landlord-Friendly · R+15
- County
- — inherits STATE
- City
- — inherits STATE
ZIP-level market 84501
- Active inventory
- 146
- Price-to-rent
- 7.3×
Monthly cashflow live
- Estimated rent
- $1,253 medium interval (Pro) →
- Mortgage (P&I)
- −$577
- Tax est. 1.5%
- −$138 /mo · $1,650/yr
- Insurance
- −$46
- HOA
- −$0
- Vacancy / Maint / Mgmt
- −$263
- Net cashflow
- $229
Break-even live
UW: 25.0% down · 7.5% · 30yr · 1.5% tax · 5.0% vac · 8.0% maint · 8.0% mgmt
Financing live
Cash to close
- Down payment
- $27,500
- Closing costs
- $3,300
- Reserves months
- —
- Total cash needed
- —
Loan-product check · same deal, 3 products live
Conventional
25% down · 7.5% · 30yr
- Down + closing
- —
- Monthly P&I
- —
- Monthly cashflow
- —
- DSCR
- —
- Eligible?
- —
Personal DTI + credit; lowest rate.
DSCR
20% down · 8.5% · 30yr
- Down + closing
- —
- Monthly P&I
- —
- Monthly cashflow
- —
- DSCR
- —
- Eligible?
- —
No personal income docs; deal must DSCR.
Hard money
10% down · 12.0% · 12mo
- Down + closing
- —
- Monthly P&I
- —
- Monthly cashflow
- —
- DSCR
- —
- Eligible?
- —
Short-term bridge; refi at stabilization.
Rent comps 2 comps
| Address | Beds | Baths | Sqft | Rent | $/sqft | DOM | Units | Dist |
|---|---|---|---|---|---|---|---|---|
| 146 N 100 E Price, UT | 2.0 | 1.0 | 1100 | $800 | $0.73 | 21d | 1 | 0.33mi |
| 533 E 100 N Price, UT | 4.0 | 2.0 | 2152 | $2,300 | $1.07 | 21d | 1 | 0.77mi |
Listing history 1 events
-
2026-05-04$110,000 Active 724-char remark
ⓘ Source: listings_history table (triggers on properties + properties_extension) + one-shot
backfill from property_details.listing_events for pre-trigger history.
Climate risk First Street
- Flood 1/10 Low FEMA zone X (unshaded) · 0% chance over 30 yrs
- Wildfire 6/10 Major
- Heat 3/10 Moderate 4 d/yr ≥93°F today · 10 d/yr by 30 yrs out
- Wind 1/10 Low
- Air quality 2/10 Low 1 unhealthy d/yr today · 2 by 30 yrs out
Nearby sold comps map
Loading sold comps map…
Walkable amenities ~0.75 mi
Loading nearby amenities…
Taxation est. · year 1
- Rental income
- $15,032
- − Mortgage interest
- −$6,162
- − Property taxes
- −$1,650
- − Insurance
- −$550
- − Repairs & maintenance
- −$1,203
- − Management
- −$1,203
- − Depreciation
- −$3,200
- Taxable income
- $1,065
- Est. tax owed @ 24.0%
- −$256
- After-tax cash flow
- $2,498/yr
For passive investors: Depreciation is non-cash, so a rental often shows a tax loss while cash-flowing — sheltering income. Rental losses are passive: they offset passive income freely, and up to $25,000/yr can offset ordinary (W-2) income if you actively participate and your MAGI is under $100k (phasing out to $0 by $150k); unused losses carry forward. On sale, claimed depreciation is recaptured at up to 25%, and gains may owe capital-gains tax (a 1031 exchange can defer both). Figures are a year-1 estimate at your 24.0% rate — not tax advice; consult a CPA.
Condition & rehab AI · 13 photos
This property is in poor condition and requires extensive repairs and updates to become move-in ready. Significant investment is needed to improve the roof, exterior siding, flooring, and interior walls and paint, as well as replace bathroom fixtures and tile. The property has potential for both resale and rental value once these improvements are made.
Repairs flagged
- Major roof — Shingles are visibly damaged
- Major exterior siding — Siding is peeling and damaged
- Major flooring — Carpet is dirty and worn
- Major interior walls/paint — Paint is peeling and walls are damaged
- Major bathroom fixtures — Fixtures are old and in poor condition
- Major bathroom tile — Tile is dirty and worn
- Major interior walls/paint — Paint is peeling and walls are damaged
- Major interior walls/paint — Paint is peeling and walls are damaged
- Major interior walls/paint — Paint is peeling and walls are damaged
- Major interior walls/paint — Paint is peeling and walls are damaged
- Major interior walls/paint — Paint is peeling and walls are damaged
- Major interior walls/paint — Paint is peeling and walls are damaged
Value-add opportunities
- Both roof replacement — New roof will improve both resale and rental value
- Both exterior siding repair/replacement — New siding will improve both resale and rental value
- Both flooring replacement — New flooring will improve both resale and rental value
- Both interior wall and paint repair — New paint and repairs will improve both resale and rental value
- Both bathroom fixtures replacement — New fixtures will improve both resale and rental value
- Both bathroom tile replacement — New tile will improve both resale and rental value
Renovation cost estimate screening
| Repair item | Severity | Est. cost |
|---|---|---|
| roof · Shingles are visibly damaged | Major | $15,000–50,000 |
| exterior siding · Siding is peeling and damaged | Major | $15,000–50,000 |
| flooring · Carpet is dirty and worn | Major | $15,000–50,000 |
| interior walls/paint · Paint is peeling and walls are damaged | Major | $15,000–50,000 |
| bathroom fixtures · Fixtures are old and in poor condition | Major | $15,000–50,000 |
| bathroom tile · Tile is dirty and worn | Major | $15,000–50,000 |
| interior walls/paint · Paint is peeling and walls are damaged | Major | $15,000–50,000 |
| interior walls/paint · Paint is peeling and walls are damaged | Major | $15,000–50,000 |
| interior walls/paint · Paint is peeling and walls are damaged | Major | $15,000–50,000 |
| interior walls/paint · Paint is peeling and walls are damaged | Major | $15,000–50,000 |
| interior walls/paint · Paint is peeling and walls are damaged | Major | $15,000–50,000 |
| interior walls/paint · Paint is peeling and walls are damaged | Major | $15,000–50,000 |
| Total estimated repair cost · 12 items | $180,000–600,000 |
Value-add ROI direction
- Both roof replacement — New roof will improve both resale and rental value ↑
- Both exterior siding repair/replacement — New siding will improve both resale and rental value ↑
- Both flooring replacement — New flooring will improve both resale and rental value ↑
- Both interior wall and paint repair — New paint and repairs will improve both resale and rental value ↑
- Both bathroom fixtures replacement — New fixtures will improve both resale and rental value ↑
- Both bathroom tile replacement — New tile will improve both resale and rental value ↑
ⓘ Cost ranges are severity-bucket heuristics (US national rule-of-thumb). Get contractor quotes + a written scope before underwriting a rehab budget.
Schools (NCES district)
- District
- Carbon District
- NCES district ID
- 4900150
- Math proficiency
- 36% ▼ -7.00%
- Reading proficiency
- 43% ▼ -4.00%
- Median HH income
- $45,189
- Composite
- 33.6/100
- National rank
- #5416
- State rank
- #53 of 80 in UT
Livability — Price
- Score
- 69/100
- State rank
- #102
- US rank
- #8877
Category grades
Schools grade is shown separately in the Schools card above.
Census & demographics
- Census place
- Price, UT
- Population (ZIP)
- 13,002
Population outlook (Carbon County) Hauer SSP2
- Today (2025)
- 18,972 people
- By 2030
- 18,081 · -4.7%
- By 2040
- 16,260 · -14.3%
- By 2050
- 14,895 · -21.5%
- By 2075
- 13,123 · -30.8%
- By 2100
- 13,066 · -31.1%
Race, ethnicity, and origin ACS 2023
- Neighborhood character
- Predominantly White (81%)
- Race & ethnicity
- White 81% Hispanic / Latino 14% Two or more races 7%
- Hispanic origin (detail)
- Mexican 12%
- Common ancestry
- Italian 3% Scottish 2% Slovak 2%
- Foreign-born
- 3% · Canada
- Languages at home
- 93% English-only · Spanish 6% Other Indo-European 1%
Political lean MEDSL · Carbon
- 2024 margin
- Solid R (+44.4) · D 26.7% · R 71.1% · Other 2.1%
- 2008→2024 swing
- -36.4pp toward R · 2008: -8.0pp · 2024: -44.4pp
- All cycles
- 2024: R+44.4 2020: R+45.9 2016: R+44.6 2012: R+36.4 2008: R+8.0
Not yet ingested
- Civics
- —
Market trends
- HPI YoY
- ▼ -119.96%
- Current HPI
- 222.2891
- Rent YoY
- —
- Metro
- —
- State GDP YoY
- ▲ 3.54%
- F500 in state
- 2
Industry mix (Fortune 500 HQ in UT)
| Industry | F500 HQs | Revenue |
|---|---|---|
| Financial Services | 1 | $3B |
|
||
Price history
3 events — show timeline
- 2026-05-29 Sold (MLS) — WFRMLS
- 2026-05-22 Pending — WFRMLS
- 2026-05-04 Listed $110,000 WFRMLS
Cash-flow waterfall
monthlySold comps — $/sqft
last 12 mo · ≤1 miLoading sold comps…