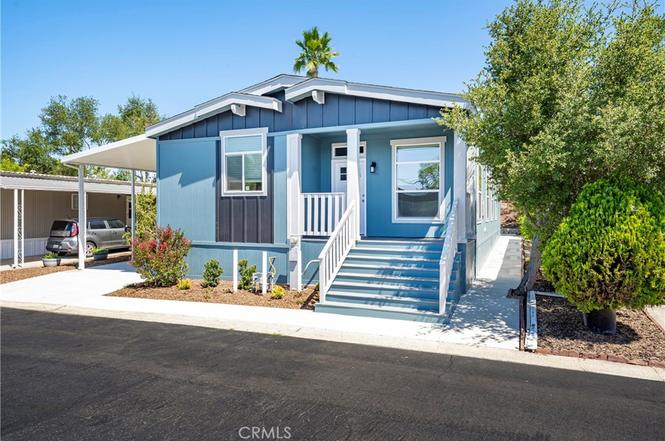
1120 E Mission Rd #57 · Fallbrook, CA
Flood risk 1/10 · Minimal
- FEMA flood zone
- X (unshaded)
- Chance of flooding over 30 yrs
- 0.0%
- Est. flood insurance / yr
- $507 – $1,088
Fire risk 7/10 · Major
- Est. fire insurance / yr
- $659 – $1,223
Heat risk 6/10 · Moderate
- Hot days now (above 94°F)
- 5 days/yr
- Hot days in 30 yrs
- 15 days/yr
Wind risk 1/10 · Minimal
- Chance of severe wind over 30 yrs
- —
Air-quality risk 4/10 · Minor
- Unhealthy air days now
- 5 days/yr
- Unhealthy air days in 30 yrs
- 6 days/yr
Risk factors via First Street. Map © Google.
Why this score? — see what drove the C grade
The composite is a weighted blend of 9 inputs, each scored 0–100. Each bar is that input's sub-score; the figure is the points it added to the 100-point composite (weight × sub-score).
- Cash flow +25.4/30.0
- DSCR +8.4/10.0
- ARV discount +7.5/15.0
- 1% rule +6.7/10.0
- Schools +3.9/10.0
- Condition / age +2.5/5.0
- Rent growth +2.4/5.0
- Livability +2.1/5.0
- Appreciation +0.0/10.0
$279,000
🖨 Deal sheet 📄 Offer letter ✓ Due diligence
Listing remarks
EXCITING NEW HOME: 3 Bedroom (or 2+den/office space) 2 Bath manufactured home sits in one of Fallbrook's most desirable 55+ communities. With roughly 1,450 sq. ft. of well-planned living space, it showcases quartz counters, a full-height designer backsplash, stainless steel appliances, and a combination of durable LVP flooring throughout the living space and you have the option to add it in the bedrooms in lieu of the carpet. High efficiency central A/C and heat, a covered two-to-three car carport, and a generously sized backyard with a large concrete area. The front yard features an automatic irrigation system, keeping landscaping both attractive and low-maintenance. Whether you're sipping
Key facts
- Quartz counters
- Carpeted bedrooms
- Covered carport
Tags
Property features AI
Finance
- Other: Manager approval required for residency; Pets allowed with restrictions (call; breed restrictions)
- Financial info: Monthly land lease approximately $1,550 (park-provided amount)
- HOA & community: Senior community; Park name: Crestview Estates; Community features: curbs, dog park, hiking, street lighting; Land lease (park) applies
Exterior
- Parking: Attached carport (3 carport spaces); Concrete driveway; Total parking for 3 vehicles; Access via paved city streets
- Security: Carbon monoxide detector(s); Fire and smoke detection system; Resident manager (on-site management/approval required)
- Utilities: Public/district water; Public sewer; Natural gas connected; Electricity connected; Sewer connected; Water connected
- Home design: Mobile home (Skyliner model); Double body type; Single story; Turnkey condition; Entry at front door; Mobile dimensions approximately 27' x 56'
- Construction: Hardboard siding; Drywall interior walls; Cellulose insulation; Asphalt roof; Pillar/post/pier foundation with tie-down
- Exterior features: Front porch; Awning; Porch - front; In-ground fenced, filtered community pool; Porch and patio (has patio); Cement board skirting
Interior
- Kitchen: Kitchen open to family room; Kitchen island; Walk-in pantry; Quartz counters; Garbage disposal; Microwave; Warmer oven drawer; Self-cleaning oven; Free-standing range / Gas range; Refrigerator; Freezer; Dishwasher; Water line to refrigerator; Energy Star appliances
- Bedrooms: Primary bedroom with walk-in closet
- Flooring: Vinyl
- Bathrooms: Two full bathrooms; Double sinks in primary bath; Shower; Exhaust fan(s); Linen closet/storage
- Heating & cooling: Central heating and cooling; Natural gas heating; Forced air / central furnace; Energy Star-rated systems
- Interior features: Quartz counters; High (9+ feet) ceilings; Ceiling fan(s); Pantry; Recessed lighting; Open floor plan; Double-pane Energy Star windows with blinds and screens; Front door entry; One-level (single story); In-ground, heated community spa; Carbon monoxide and fire/smoke detectors; Resident manager
- Laundry & utility: Inside laundry room; Washer hookup; Gas dryer hookup; Individual laundry room
Neighborhood map
What this means for you Summary
Snapshot
- This is a 3-bed/2.0-bath manufactured listed at $279k.
Deal economics
- At list price, monthly cash flow is $646 ($8k/yr) — positive.
- The deal already cash-flows at list — no discount required.
- Meets the 1% rule at list price ($3k rent vs $279k).
- Recommended offer: $246k (12.0% below list) — sets the bar for market timing.
- Cap rate 9.1% vs local median 2.4% in Fallbrook — top-decile yield for the area; either an underpriced asset or a hidden risk that comps aren't pricing in. Stress-test before assuming the spread holds.
Location & tenants
- Location reads 42/100 on livability (#1,364 in CA) — a working-class tenant base; expect higher turnover. Watch: crime D-, amenities F, commute F.
- Fallbrook Union High (suburban): math 32% / reading 58% proficiency, ranked #183 of 517 in CA (top 35%) — families likely to look elsewhere, expect single-tenant / working-renter base with shorter leases.
- Zoned schools: Fallbrook High (math 35% / reading 59%, grade D-, #389 of 1,170 statewide, top 35%, 1,924 students, 71% FRL).
- Market conditions: Rents soft (-0.3%/yr); 345 active listings in the ZIP; 5 comparable units currently listed for rent nearby; rentals leasing fast (median 3d on market — plan ~1-2 weeks tenant-placement turnaround); high-income renter base; 11,759 units permitted in San Diego County in 2024 (7,244 in 5+ unit buildings).
- This rent runs 35% of the median local income ($111k/yr) — at the standard rent-burdened threshold; future hikes will face affordability resistance.
Forward outlook
- Local home prices are declining (-3.0%/yr); year-one equity from $2k of loan paydown is wiped out by about $8k of value loss. Plan a longer hold.
- San Diego County population projected at +20% by 2050 — long-run rental-demand tailwind backs the buy-and-hold thesis.
Negotiation context
- It's been on market 143 days — a 12% lower offer ($246k) is reasonable based on typical stale-listing flexibility.
Risks & watch-outs
- Climate carrying-cost: major wildfire risk; extreme-heat days projected 5→15/yr by 2055 (HVAC capex compounding) — expect insurance premiums to compound above CPI over the hold.
Questions for the listing agent
- It's been on market 143 days. Have you received any prior offers? Is the seller open to a 12% concession, seller financing, or rate buy-down credit?
- Why hasn't it sold? Are there any deal-killer items the seller is aware of (foundation, flood, title, zoning, code violations)?
- Is there a deadline driving the sale (1031 exchange, divorce, estate, relocation)? That informs how much negotiation room exists.
- Schools are D-rated, which usually means shorter tenancies and higher turnover. Who's the typical renter profile here, and what's been the actual vacancy rate?
- Crime grade is D in this area — have there been break-ins, vandalism, or insurance claims at this property in the last 3 years? What carrier currently insures it and at what premium?
- What's the average days-on-market for RENTAL listings here right now (not sales)? A rising rental-DOM trend means longer vacancies and softer asking-rent achievability than the comps imply.
- What's the recent tenant-quality profile in this submarket — average credit score on applications, eviction rate, late-payment / NSF rate, and stable-employment percentage? A property-management company in the area should have these aggregated.
- How much new for-sale + rental construction is in the pipeline within 1–3 miles? Heavy new supply typically softens prices + rents 12–24 months out; constrained supply supports both.
Investment metrics
- 1% rule
- 1.17% ✓
- Cap rate
- 9.07%
- Cash-on-cash
- 9.93%
- DSCR
- 1.44
- GRM
- 7.1
CMA / ARV
- ARV (on-the-fly)
- $154,548
- Comps found
- 5
Show comp detail 5 sales within ~0.75 mi
| Address | Dist | Beds/Ba | Sqft | Sold | Price | $/sf | Match |
|---|---|---|---|---|---|---|---|
| 1120 E Mission Rd #102 | 0.03mi | 2/2.0 (-1) | 1,440 (+1%) | 2mo | $429,000 | $298 | 91 |
| 1120 E Mission Rd #37 | 0.00mi | 2/2.0 (-1) | 1,440 (+1%) | 6mo | $75,000 | $52 | 89 |
| 1120 E Mission Rd #27 | 0.03mi | 2/2.0 (-1) | 1,400 (-2%) | 8mo | $139,000 | $99 | 83 |
| 1120 E Mission Rd Space 94 | 0.00mi | 2/2.0 (-1) | 1,440 (+1%) | 23mo | $155,000 | $108 | 75 |
| 1120 E Mission Rd #69 | 0.03mi | 3/2.0 | 1,620 (+13%) | 8mo | $189,000 | $117 | 70 |
Match score weights: distance 35% · size 25% · config 20% · recency 20%. Top-matched comps best support the ARV.
Projected returns pro-forma
-3.0% appreciation · 0.0% rent growth · sell at horizon
- IRR
- -4.8%
- Equity multiple
- 0.83×
- Total profit
- $-13,557
- Equity at exit
- $41,600
- IRR
- 0.9%
- Equity multiple
- 1.06×
- Total profit
- $4,480
- Equity at exit
- $24,123
Cash invested: $78,120 (down + closing). Projections, not guarantees.
Landlord ↔ Tenant lean methodology
- Overall (STATE)
- 18 Strongly Tenant-Friendly
- State California
- 18 Strongly Tenant-Friendly · D+13
- County
- — inherits STATE
- City
- — inherits STATE
ZIP-level market 92028
- Rents YoY
- -0.3%
- Active inventory
- 345
- Price-to-rent
- 7.1×
Monthly cashflow live
- Estimated rent
- $3,259 high interval (Pro) →
- Mortgage (P&I)
- −$1,463
- Tax est. 1.5%
- −$349 /mo · $4,185/yr
- Insurance
- −$116
- HOA
- −$0
- Vacancy / Maint / Mgmt
- −$684
- Net cashflow
- $646
Break-even live
UW: 25.0% down · 7.5% · 30yr · 1.5% tax · 5.0% vac · 8.0% maint · 8.0% mgmt
Financing live
Cash to close
- Down payment
- $69,750
- Closing costs
- $8,370
- Reserves months
- —
- Total cash needed
- —
Loan-product check · same deal, 3 products live
Conventional
25% down · 7.5% · 30yr
- Down + closing
- —
- Monthly P&I
- —
- Monthly cashflow
- —
- DSCR
- —
- Eligible?
- —
Personal DTI + credit; lowest rate.
DSCR
20% down · 8.5% · 30yr
- Down + closing
- —
- Monthly P&I
- —
- Monthly cashflow
- —
- DSCR
- —
- Eligible?
- —
No personal income docs; deal must DSCR.
Hard money
10% down · 12.0% · 12mo
- Down + closing
- —
- Monthly P&I
- —
- Monthly cashflow
- —
- DSCR
- —
- Eligible?
- —
Short-term bridge; refi at stabilization.
Rent comps 5 comps
| Address | Beds | Baths | Sqft | Rent | $/sqft | DOM | Units | Dist |
|---|---|---|---|---|---|---|---|---|
| 421 Potter St Fallbrook, CA | 1.0–2.0 | 1.0–2.0 | 726 | $2,100 | $2.89 | 2d | 2 | 0.69mi |
| 757 N Stage Coach Ln Fallbrook, CA | 3.0 | 2.0 | 1508 | $3,900 | $2.59 | 22d | 1 | 0.70mi |
| 338 E Fallbrook St Fallbrook, CA | 2.0 | 2.0 | 976 | $2,495 | $2.56 | 3d | 1 | 0.91mi |
| 611 Summit Ave Fallbrook, CA | 3.0 | 2.0 | 1506 | $3,500 | $2.32 | 10d | 1 | 1.28mi |
| 744 W Fallbrook St Fallbrook, CA | 1.0–2.0 | 1.0–2.0 | 780 | $2,200 | $2.82 | 2d | 1 | 1.40mi |
Listing history 16 events
-
2026-06-18days on market $279,000 Active 143 DOM
-
2026-06-17days on market $279,000 Active 142 DOM
-
2026-06-16days on market $279,000 Active 141 DOM
-
2026-06-15days on market $279,000 Active 140 DOM
-
2026-06-13days on market $279,000 Active 138 DOM
-
2026-06-13days on market $279,000 Active 137 DOM
-
2026-06-09days on market $279,000 Active 134 DOM
-
2026-06-08days on market $279,000 Active 133 DOM
-
2026-06-07days on market $279,000 Active 132 DOM
-
2026-06-04days on market $279,000 Active 129 DOM
-
2026-06-03days on market $279,000 Active 128 DOM
-
2026-06-02days on market $279,000 Active 127 DOM
-
2026-06-02price $279,000 Active 126 DOM
-
2026-06-01days on market $285,000 Active 126 DOM
-
2026-05-31days on market $285,000 Active 125 DOM
-
2026-01-26$285,000 Active
ⓘ Source: listings_history table (triggers on properties + properties_extension) + one-shot
backfill from property_details.listing_events for pre-trigger history.
Climate risk First Street
- Flood 1/10 Low FEMA zone X (unshaded) · 0% chance over 30 yrs
- Wildfire 7/10 Severe
- Heat 6/10 Major 5 d/yr ≥94°F today · 15 d/yr by 30 yrs out
- Wind 1/10 Low
- Air quality 4/10 Moderate 5 unhealthy d/yr today · 6 by 30 yrs out
Nearby sold comps map
Loading sold comps map…
Walkable amenities ~0.75 mi
Loading nearby amenities…
Taxation est. · year 1
- Rental income
- $39,102
- − Mortgage interest
- −$15,628
- − Property taxes
- −$4,185
- − Insurance
- −$1,395
- − Repairs & maintenance
- −$3,128
- − Management
- −$3,128
- − Depreciation
- −$8,116
- Taxable income
- $3,521
- Est. tax owed @ 24.0%
- −$845
- After-tax cash flow
- $6,909/yr
For passive investors: Depreciation is non-cash, so a rental often shows a tax loss while cash-flowing — sheltering income. Rental losses are passive: they offset passive income freely, and up to $25,000/yr can offset ordinary (W-2) income if you actively participate and your MAGI is under $100k (phasing out to $0 by $150k); unused losses carry forward. On sale, claimed depreciation is recaptured at up to 25%, and gains may owe capital-gains tax (a 1031 exchange can defer both). Figures are a year-1 estimate at your 24.0% rate — not tax advice; consult a CPA.
Schools (NCES district)
- District
- Fallbrook Union High
- NCES district ID
- 0613530
- Math proficiency
- 32% ▲ 11.00%
- Reading proficiency
- 58% ▲ 9.00%
- Median HH income
- $56,644
- Composite
- 39.17/100
- National rank
- #4025
- State rank
- #183 of 517 in CA
Livability — Fallbrook
- Score
- 42/100
- State rank
- #1364
- US rank
- #27057
Category grades
Schools grade is shown separately in the Schools card above.
Census & demographics
- Census place
- Fallbrook, CA
- County
- San Diego County · 3,178,799 people
- City population
- 52,227
- Metro
- San Diego-Chula Vista-Carlsbad, CA
- Population (ZIP)
- 52,227
- Household income
- $111,290
- Rent vs Own
- Severe rent burden
- 1384.0
Population outlook (San Diego County) Hauer SSP2
- Today (2025)
- 3,678,185 people
- By 2030
- 3,856,546 · +4.8%
- By 2040
- 4,171,407 · +13.4%
- By 2050
- 4,421,607 · +20.2%
- By 2075
- 4,831,599 · +31.4%
- By 2100
- 4,832,502 · +31.4%
Race, ethnicity, and origin ACS 2023
- Neighborhood character
- Diverse neighborhood (Simpson 0.59)
- Race & ethnicity
- White 48% Hispanic / Latino 42% Two or more races 21% Asian 4% Black 2% Native American 1%
- Hispanic origin (detail)
- Mexican 35%
- Common ancestry
- Slovak 2% Italian 2% Romanian 2%
- Foreign-born
- 21% · Canada, Vietnam, China
- Languages at home
- 66% English-only · Spanish 29% Tagalog/Filipino 1% Other Asian/Pacific 1%
Political lean MEDSL · San Diego
- 2024 margin
- D (+16.8) · D 56.9% · R 40.1% · Other 2.9%
- 2008→2024 swing
- +6.6pp toward D · 2008: 10.2pp · 2024: 16.8pp
- All cycles
- 2024: D+16.8 2020: D+22.8 2016: D+17.8 2012: D+5.1 2008: D+10.2
Not yet ingested
- Civics
- —
Market trends
- HPI YoY
- ▼ -533.50%
- Current HPI
- 320.7162
- Rent YoY
- ▼ -0.35%
- Metro
- San Diego-Chula Vista-Carlsbad, CA
- State GDP YoY
- ▲ 3.21%
- F500 in state
- 116
Industry mix (Fortune 500 HQ in CA)
| Industry | F500 HQs | Revenue |
|---|---|---|
| Technology | 27 | $1,492B |
|
||
| Financial Services | 3 | $174B |
|
||
| Retail | 3 | $44B |
|
||
| Insurance | 3 | $26B |
|
||
| Media / Entertainment | 2 | $115B |
|
||
| Pharmaceuticals / Biotech | 2 | $62B |
|
||
Price history
1 event — show timeline
- 2026-01-26 Listed $285,000 CRMLS
Cash-flow waterfall
monthlySold comps — $/sqft
last 12 mo · ≤1 miLoading sold comps…