 🏗️ New Construction
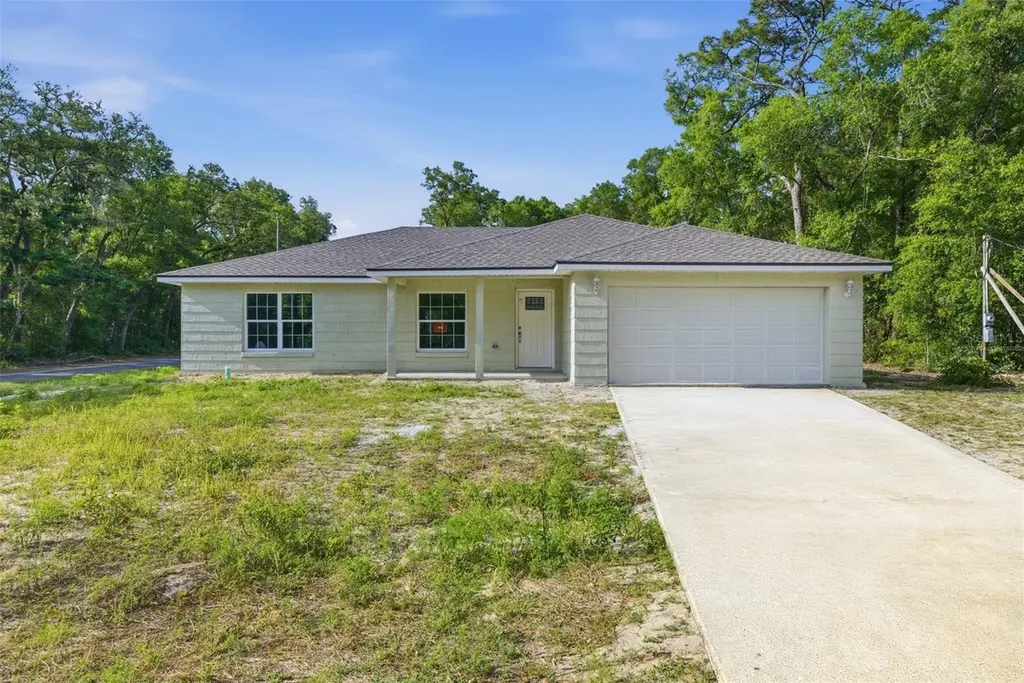
28 Locust Ter · Silver Springs Shores, FL
Flood risk 1/10 · Minimal
- FEMA flood zone
- X (unshaded)
- Chance of flooding over 30 yrs
- 0.0%
- Est. flood insurance / yr
- $507 – $1,088
Fire risk 6/10 · Moderate
- Est. fire insurance / yr
- $947 – $1,759
Heat risk 8/10 · Major
- Hot days now (above 108°F)
- 7 days/yr
- Hot days in 30 yrs
- 21 days/yr
Wind risk 9/10 · Severe
- Chance of severe wind over 30 yrs
- 99.0%
Air-quality risk 3/10 · Minor
- Unhealthy air days now
- 3 days/yr
- Unhealthy air days in 30 yrs
- 4 days/yr
Risk factors via First Street. Map © Google.
Why this score? — see what drove the D- grade
The composite is a weighted blend of 9 inputs, each scored 0–100. Each bar is that input's sub-score; the figure is the points it added to the 100-point composite (weight × sub-score).
- Cash flow +8.0/30.0
- Appreciation +8.0/10.0
- ARV discount +7.5/15.0
- Schools +3.6/10.0
- Livability +3.4/5.0
- 1% rule +2.5/10.0
- Rent growth +2.5/5.0
- Condition / age +2.5/5.0
- DSCR +2.1/10.0
$285,000
🖨 Deal sheet (PDF) 📄 Offer letter ✓ Due diligence
Listing remarks
One or more photo(s) has been virtually staged. Under Construction. Brand new construction home situated on a desirable corner lot in the sought-after Silver Springs Shores area of Ocala! This beautiful 3 bedroom, 2 bathroom home features luxury vinyl plank flooring throughout, granite countertops, and decorative wood plank stucco accents on both the front and rear of the home, giving it a modern custom feel. The builder also upgraded the attic with spray foam insulation to help improve energy efficiency and lower monthly utility costs. Inside, you’ll find an open layout with beautiful tile showers, a spacious primary suite featuring a tray ceiling, large walk-in shower, and walk-in c
Key facts
- 0.24 acre lot
- 2 garage spots
- Built 2026
Property features AI
Exterior
- Parking: Attached garage; 2-car garage
- Utilities: Septic tank; Water available and connected; Electricity available and connected; Broadband/high-speed internet available
- Home design: Single family residence; One story; Under construction (projected completion June 7, 2026); Faces east
- Construction: Block and stucco construction; Shingle roof; Slab foundation; New construction; Builder: Reyes Construction Services Group Inc.
- Exterior features: Covered front and rear porches; Patio; French doors; Private mailbox; Corner lot; Cleared lot; In-county location; Asphalt/paved road access
Interior
- Kitchen: Dishwasher; Microwave; Range
- Bedrooms: 3 bedrooms
- Flooring: Ceramic tile
- Bathrooms: 2 full bathrooms
- Heating & cooling: Electric heating; Heat pump; Central air conditioning
- Interior features: Eat-in kitchen; High ceilings; Dining area; Open floorplan; Solid wood cabinets; Stone counters; Walk-in closet(s)
- Laundry & utility: Laundry room inside
Neighborhood map
What this means for you Summary
Snapshot
- This is a 3-bed/2.0-bath land listed at $285k.
Deal economics
- At list price, monthly cash flow is $-251 ($-3k/yr) — negative.
- To cash-flow at today's rent, offer at most $209k (26.5% below list).
- To meet the 1% rule (rent ≥ 1% of price), the offer needs to be $183k (35.7% below list).
- Recommended offer: $183k (35.7% below list) — sets the bar for 1% rule.
Location & tenants
- Location reads 68/100 on livability (#527 in FL) — a middle-class / working-renter tenant base. Strengths: cost of living A+, housing A+, health & safety A-; Watch: crime C-, employment D, amenities F.
- Marion (rural): math 42% / reading 43% proficiency, ranked #61 of 73 in FL (top 84%) — families likely to look elsewhere, expect single-tenant / working-renter base with shorter leases; 61% free/reduced lunch — lower-income household profile, screen leases tightly.
- Zoned schools: Emerald Shores Elementary School (math 30% / reading 34%, grade F, #1,797 of 2,144 statewide, top 86%, 666 students, 74% FRL); Lake Weir Middle School (math 37% / reading 33%, grade F, #416 of 571 statewide, top 74%, 1,207 students, 76% FRL); Lake Weir High School (math 23% / reading 34%, grade F, #458 of 667 statewide, top 69%, 1,483 students, 68% FRL).
- Market conditions: Rents flat; 683 active listings in the ZIP; 3 comparable units currently listed for rent nearby; rentals at typical pace (median 16d on market — plan ~3-4 weeks tenant-placement turnaround); 7,071 units permitted in Marion County in 2024 (534 in 5+ unit buildings).
- This rent runs 34% of the median local income ($64k/yr) — at the standard rent-burdened threshold; future hikes will face affordability resistance.
Forward outlook
- In year one you build about $16k of equity ($2k loan paydown + $15k appreciation (5.9% local appreciation)).
- Marion County population projected at +13% by 2050 — modest demand growth; plan on rents tracking national, not racing it.
- By year 3, paydown + projected appreciation supports a ~$40k cash-out refi (75% LTV) — recoverable capital for the next deal without selling this one.
Negotiation context
- It's been on market 45 days — a 3% lower offer ($276k) is reasonable based on typical stale-listing flexibility.
Risks & watch-outs
- Climate carrying-cost: severe wind risk, 99% chance of damaging wind over 30y; major wildfire risk; extreme-heat days projected 7→21/yr by 2055 (HVAC capex compounding) — expect insurance premiums to compound above CPI over the hold.
Questions for the listing agent
- What do current leases actually rent for vs. the listed asking? Can we see a recent rent roll and the last 12 months of T-12 income?
- It's been on market 45 days. Have you received any prior offers? Is the seller open to a 36% concession, seller financing, or rate buy-down credit?
- Is there a deadline driving the sale (1031 exchange, divorce, estate, relocation)? That informs how much negotiation room exists.
- Schools are F-rated, which usually means shorter tenancies and higher turnover. Who's the typical renter profile here, and what's been the actual vacancy rate?
- The area grade is low — what's the realistic commute time and amenity access for the typical tenant pool here? Any planned neighborhood developments (good or bad) we should know about?
- What's the average days-on-market for RENTAL listings here right now (not sales)? A rising rental-DOM trend means longer vacancies and softer asking-rent achievability than the comps imply.
- What's the recent tenant-quality profile in this submarket — average credit score on applications, eviction rate, late-payment / NSF rate, and stable-employment percentage? A property-management company in the area should have these aggregated.
- How much new for-sale + rental construction is in the pipeline within 1–3 miles? Heavy new supply typically softens prices + rents 12–24 months out; constrained supply supports both.
Investment metrics
- 1% rule
- 0.75% ✗
- Cap rate
- 5.07%
- Cash-on-cash
- -4.38%
- DSCR
- 0.81
- GRM
- 11.2
CMA / ARV
- ARV (median comp)
- $245,848
- List price
- $285,000
- Delta
- 15.93%
- Verdict
- OVERPRICED
- Comps
- 14 within 1.0 mi
Projected returns pro-forma
5.93% appreciation · 0.17% rent growth · sell at horizon
- IRR
- 10.6%
- Equity multiple
- 1.71×
- Total profit
- $48,946
- Equity at exit
- $153,503
- IRR
- 11.0%
- Equity multiple
- 3.14×
- Total profit
- $147,646
- Equity at exit
- $277,471
Cash invested: $68,837 (down + closing). Projections, not guarantees.
Landlord ↔ Tenant lean methodology
- Overall (STATE)
- 87 Strongly Landlord-Friendly
- State Florida
- 87 Strongly Landlord-Friendly · R+3
- County
- — inherits STATE
- City
- — inherits STATE
ZIP-level market 34472
- Home prices YoY
- 2.4%
- Rents YoY
- 0.2%
- Active inventory
- 683
- Price-to-rent
- 13.0×
Monthly cashflow live
- Estimated rent
- $1,833 medium interval (Pro) →
- Mortgage (P&I)
- −$1,289
- Tax est. 1.5%
- −$307 /mo · $3,688/yr
- Insurance
- −$102
- HOA
- −$0
- Vacancy / Maint / Mgmt
- −$385
- Net cashflow
- $-251
Break-even live
Sensitivity live
| Price | -10% $-81 | -5% $-166 | +0% $-251 | +5% $-336 | +10% $-421 |
|---|---|---|---|---|---|
| Rent | -10% $-396 | -5% $-324 | +0% $-251 | +5% $-179 | +10% $-107 |
| Rate | -1.0pp $-127 | -0.5pp $-189 | base $-251 | +0.5pp $-315 | +1.0pp $-380 |
UW: 25.0% down · 7.5% · 30yr · 1.5% tax · 5.0% vac · 8.0% maint · 8.0% mgmt
Financing live
Cash to close
- Down payment
- $61,462
- Closing costs
- $7,375
- Reserves months
- —
- Total cash needed
- —
Loan-product check · same deal, 3 products live
Conventional
25% down · 7.5% · 30yr
- Down + closing
- —
- Monthly P&I
- —
- Monthly cashflow
- —
- DSCR
- —
- Eligible?
- —
Personal DTI + credit; lowest rate.
DSCR
20% down · 8.5% · 30yr
- Down + closing
- —
- Monthly P&I
- —
- Monthly cashflow
- —
- DSCR
- —
- Eligible?
- —
No personal income docs; deal must DSCR.
Hard money
10% down · 12.0% · 12mo
- Down + closing
- —
- Monthly P&I
- —
- Monthly cashflow
- —
- DSCR
- —
- Eligible?
- —
Short-term bridge; refi at stabilization.
Rent comps 3 comps
| Address | Beds | Baths | Sqft | Rent | $/sqft | DOM | Units | Dist |
|---|---|---|---|---|---|---|---|---|
| 6 Locust Course Ln Ocala, FL | 3.0 | 2.0 | 1263 | $1,735 | $1.37 | 15d | 1 | 0.25mi |
| 342 Locust Pass Ocala, FL | 3.0 | 2.0 | 1232 | $1,650 | $1.34 | 15d | 1 | 0.85mi |
| 219 Locust Ln Ocala, FL | 3.0 | 2.0 | 1232 | $1,650 | $1.34 | 15d | 1 | 1.25mi |
Listing history 17 events
-
2026-06-21days on market $285,000 Active 45 DOM
-
2026-06-18days on market $285,000 Active 42 DOM
-
2026-06-17days on market $285,000 Active 41 DOM
-
2026-06-16days on market $285,000 Active 40 DOM
-
2026-06-15days on market $285,000 Active 39 DOM
-
2026-06-14days on market $285,000 Active 37 DOM
-
2026-06-13days on market $285,000 Active 36 DOM
-
2026-06-10days on market $285,000 Active 34 DOM
-
2026-06-09days on market $285,000 Active 33 DOM
-
2026-06-08days on market $285,000 Active 32 DOM
-
2026-06-07days on market $285,000 Active 31 DOM
-
2026-06-03days on market $285,000 Active 27 DOM
-
2026-06-02days on market $285,000 Active 26 DOM
-
2026-06-01days on market $285,000 Active 25 DOM
-
2026-05-31days on market $285,000 Active 24 DOM
-
2026-05-30days on market $285,000 Active 23 DOM
-
2026-05-07$285,000 Active 1330-char remark
ⓘ Source: listings_history table (triggers on properties + properties_extension) + one-shot
backfill from property_details.listing_events for pre-trigger history.
Climate risk First Street
- Flood 1/10 Low FEMA zone X (unshaded) · 0% chance over 30 yrs
- Wildfire 6/10 Major
- Heat 8/10 Severe 7 d/yr ≥108°F today · 21 d/yr by 30 yrs out
- Wind 9/10 Extreme 99% chance of damaging wind over 30 yrs
- Air quality 3/10 Moderate 3 unhealthy d/yr today · 4 by 30 yrs out
Nearby sold comps map
Loading sold comps map…
Walkable amenities ~0.75 mi
Loading nearby amenities…
Taxation est. · year 1
- Rental income
- $21,990
- − Mortgage interest
- −$13,771
- − Property taxes
- −$3,688
- − Insurance
- −$1,229
- − Repairs & maintenance
- −$1,759
- − Management
- −$1,759
- − Depreciation
- −$7,152
- Taxable loss
- −$7,368
- Est. tax savings @ 24.0%
- +$1,768
- After-tax cash flow
- $-1,247/yr
For passive investors: Depreciation is non-cash, so a rental often shows a tax loss while cash-flowing — sheltering income. Rental losses are passive: they offset passive income freely, and up to $25,000/yr can offset ordinary (W-2) income if you actively participate and your MAGI is under $100k (phasing out to $0 by $150k); unused losses carry forward. On sale, claimed depreciation is recaptured at up to 25%, and gains may owe capital-gains tax (a 1031 exchange can defer both). Figures are a year-1 estimate at your 24.0% rate — not tax advice; consult a CPA.
Schools (NCES district)
- District
- Marion
- NCES district ID
- 1201260
- Math proficiency
- 42% ▼ -7.00%
- Reading proficiency
- 43% ▼ -4.00%
- Median HH income
- $40,015
- Composite
- 35.61/100
- National rank
- #4890
- State rank
- #61 of 73 in FL
Livability — Silver Springs Shores
- Score
- 68/100
- State rank
- #527
- US rank
- #9854
Category grades
Schools grade is shown separately in the Schools card above.
Census & demographics
- County
- Marion County · 315,796 people
- City population
- 34,665
- Metro
- Ocala, FL
- Population (ZIP)
- 35,851
- Household income
- $64,208
- Rent vs Own
- Severe rent burden
- 655.0
Population outlook (Marion County) Hauer SSP2
- Today (2025)
- 365,905 people
- By 2030
- 376,768 · +3.0%
- By 2040
- 396,555 · +8.4%
- By 2050
- 412,723 · +12.8%
- By 2075
- 446,090 · +21.9%
- By 2100
- 436,193 · +19.2%
Race, ethnicity, and origin ACS 2023
- Neighborhood character
- Diverse neighborhood (Simpson 0.65)
- Race & ethnicity
- White 50% Hispanic / Latino 25% Black 21% Two or more races 18% Asian 2%
- Hispanic origin (detail)
- Mexican 2% Puerto Rican 14% Cuban 3%
- Common ancestry
- Romanian 2% Iranian 1% Lithuanian 1%
- Foreign-born
- 11% · Canada, Jamaica, China
- Languages at home
- 78% English-only · Spanish 19% Other Indo-European 1%
Political lean MEDSL · Marion
- 2024 margin
- Solid R (+31.6) · D 33.8% · R 65.5%
- 2008→2024 swing
- -20.0pp toward R · 2008: -11.6pp · 2024: -31.6pp
- All cycles
- 2024: R+31.6 2020: R+25.9 2016: R+26.2 2012: R+16.2 2008: R+11.6
Not yet ingested
- Civics
- —
Market trends
- HPI YoY
- ▲ 5.93%
- Current HPI
- 255.0714
- Rent YoY
- ▲ 0.17%
- Metro
- Ocala, FL
- State GDP YoY
- ▲ 3.28%
- F500 in state
- 36
Industry mix (Fortune 500 HQ in FL)
| Industry | F500 HQs | Revenue |
|---|---|---|
| Industrial Technology | 2 | $29B |
|
||
| Insurance | 2 | $17B |
|
||
| Retail | 1 | $60B |
|
||
| Technology Distribution | 1 | $58B |
|
||
| Homebuilding | 1 | $35B |
|
||
| Technology Manufacturing | 1 | $35B |
|
||
Price history
1 event — show timeline
- 2026-05-07 Listed $285,000 Stellar MLS as Distributed by MLS Grid
Property tax history
+12.2%/yrLatest (2025): $373 · +9.7% YoY. Source: county tax records.
Cash-flow waterfall
monthlySold comps — $/sqft
last 12 mo · ≤1 miLoading sold comps…