 35-Plex
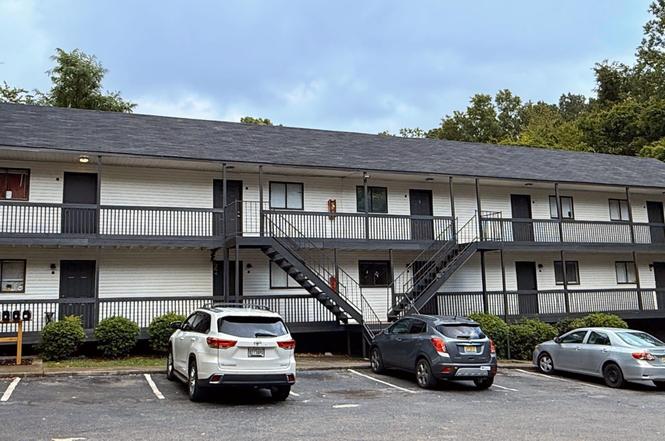
4011 Eunice St · Huntsville, AL
Flood risk 1/10 · Minimal
- FEMA flood zone
- X (unshaded)
- Chance of flooding over 30 yrs
- 0.0%
- Est. flood insurance / yr
- $507 – $1,088
Fire risk 2/10 · Minimal
- Est. fire insurance / yr
- $916 – $1,700
Heat risk 5/10 · Moderate
- Hot days now (above 105°F)
- 7 days/yr
- Hot days in 30 yrs
- 20 days/yr
Wind risk 4/10 · Minor
- Chance of severe wind over 30 yrs
- 19.0%
Air-quality risk 2/10 · Minimal
- Unhealthy air days now
- 1 days/yr
- Unhealthy air days in 30 yrs
- 1 days/yr
Risk factors via First Street. Map © Google.
Why this score? — see what drove the B- grade
The composite is a weighted blend of 9 inputs, each scored 0–100. Each bar is that input's sub-score; the figure is the points it added to the 100-point composite (weight × sub-score).
- Cash flow +30.0/30.0
- 1% rule +10.0/10.0
- DSCR +10.0/10.0
- ARV discount +7.5/15.0
- Livability +4.1/5.0
- Rent growth +3.0/5.0
- Schools +2.9/10.0
- Condition / age +2.5/5.0
- Appreciation +0.0/10.0
$1,600,000
🖨 Deal sheet 📄 Offer letter ✓ Due diligence
Multi-family units
County records classify this as Multi-Family (5+ Unit). Listing-text estimate: 35 units. confirmed
5+ unit building — per-unit beds/baths from public records are typically unavailable; the breakdown below (if shown) is an estimate from the listing text.
Listing remarks
This property was part of a 35-unit portfolio. Now this 18-unit complex is available individually. Golden opportunity for investors to acquire this recently updated and modernized property, renovated interior and exterior, premium on-site laundry room. Inspection after accepted offer and EMD. Provide pre-approval letter and POF to with offer. Seller financing is not available.
Key facts
- 0.86 acre lot
- 21 parking spots
- Built 1978
Property features AI
Finance
- Other: Lot size approximately 0.86 acres
- Financial info: Multi-family investment property (18 units total)
- HOA & community: Community features: Other; Subdivision: H E Foster
Exterior
- Parking: Private off-street parking with 21 spaces
- Utilities: Public water; Public sewer; Electric service
- Home design: Residential income property (multi-family); Two levels; Built in 1978
- Construction: Insulated door
- Exterior features: Balcony; Two buildings on one lot (4009 & 4011 Eunice); Total of 18 residential units across the buildings; Shared laundry room
Interior
- Kitchen: Refrigerator; Oven
- Heating & cooling: Wall furnace heating; Electric heating; Wall unit cooling
- Interior features: Balcony
- Laundry & utility: Electric water heater; On-site laundry room (shared building laundry)
Neighborhood map
What this means for you Summary
Snapshot
- This is a 35 × 4-bed/4.0-bath units multifamily listed at $1.60M.
Deal economics
- At list price, monthly cash flow is $31k ($377k/yr) — positive. Per door: $897/mo.
- The deal already cash-flows at list — no discount required.
- Meets the 1% rule at list price ($52k rent vs $1.60M).
- Recommended offer: $1.41M (12.0% below list) — sets the bar for market timing.
- Cap rate 29.8% vs local median 3.8% in Huntsville — top-decile yield for the area; either an underpriced asset or a hidden risk that comps aren't pricing in. Stress-test before assuming the spread holds.
Location & tenants
- Location reads 82/100 on livability (#3 in AL, #1,082 nationally) — a professional / high-income tenant draw. Strengths: commute A+, cost of living A+, housing A+; Watch: crime F.
- Huntsville City (urban): math 21% / reading 46% proficiency, ranked #48 of 129 in AL (top 37%) — families likely to look elsewhere, expect single-tenant / working-renter base with shorter leases.
- Zoned schools: Ridgecrest Elementary School (math 8% / reading 35%, grade F, #450 of 627 statewide, top 72%, 511 students, 85% FRL); Morris Middle School (math 3% / reading 25%, grade F, #209 of 257 statewide, top 82%, 453 students, 58% FRL); Columbia High School (math 12% / reading 17%, grade F, #220 of 305 statewide, top 77%, 954 students, 50% FRL) — zoned schools average 64% FRL vs 46% district-wide (18 pts higher); higher-poverty schools than district average — tighter screening recommended.
- Zoned-school proficiency averages 17% at this address vs 34% district-wide (-17 pts) — the specific schools serving this property underperform the Huntsville City average; the district grade overstates school quality for this exact location.
- Market conditions: Rents rising (+1.8%/yr); 133 active listings in the ZIP; lower-income renter base — watch delinquency; 4,709 units permitted in Madison County in 2024 (1,186 in 5+ unit buildings).
- At $51,926/mo this rent would consume 1761% of the median local household income ($35k/yr) (locally 1750% of renters already pay >50% of income on rent) — very limited rent-growth headroom before tenants either downsize or default.
Forward outlook
- Local home prices are declining (-3.0%/yr); year-one equity from $11k of loan paydown is wiped out by about $48k of value loss. Plan a longer hold.
- Madison County population projected at +18% by 2050 — long-run rental-demand tailwind backs the buy-and-hold thesis.
- At projected returns (-3.0% appreciation + 1.8% rent growth), your $448k cash investment doubles in ~2 years — after that, you're playing with house money.
Negotiation context
- It's been on market 319 days — a 12% lower offer ($1.41M) is reasonable based on typical stale-listing flexibility.
- 4 sale attempts since 2y ago; this cycle's ask is 3% above the opening price — seller raised mid-cycle; expect resistance to lowballs.
Risks & watch-outs
- Climate carrying-cost: extreme-heat days projected 7→20/yr by 2055 (HVAC capex compounding) — expect insurance premiums to compound above CPI over the hold.
Questions for the listing agent
- It's been on market 319 days. Have you received any prior offers? Is the seller open to a 12% concession, seller financing, or rate buy-down credit?
- Can we see the unit-by-unit rent roll, current vacancy, and any below-market leases? What's the average tenancy length?
- What capital expenditures (roof, boiler, parking lot, exteriors) have been made in the last 5 years, and what's planned in the next 2?
- Built in 1978 — when were the roof, HVAC, electrical panel, plumbing, and water heater last replaced?
- Why hasn't it sold? Are there any deal-killer items the seller is aware of (foundation, flood, title, zoning, code violations)?
- Is there a deadline driving the sale (1031 exchange, divorce, estate, relocation)? That informs how much negotiation room exists.
- Crime grade is F in this area — have there been break-ins, vandalism, or insurance claims at this property in the last 3 years? What carrier currently insures it and at what premium?
- What's the average days-on-market for RENTAL listings here right now (not sales)? A rising rental-DOM trend means longer vacancies and softer asking-rent achievability than the comps imply.
- What's the recent tenant-quality profile in this submarket — average credit score on applications, eviction rate, late-payment / NSF rate, and stable-employment percentage? A property-management company in the area should have these aggregated.
- How much new apartment / multifamily construction is in the pipeline within 1–3 miles? Heavy new supply (>2% of stock underway) typically softens rents 12–24 months out; light construction supports rent growth.
Investment metrics
- 1% rule
- 3.25% ✓
- Cap rate
- 29.85%
- Cash-on-cash
- 84.12%
- DSCR
- 4.74
- GRM
- 2.6
CMA / ARV
No comps found within radius.
Projected returns pro-forma
-3.0% appreciation · 1.82% rent growth · sell at horizon
- IRR
- 83.2%
- Equity multiple
- 4.75×
- Total profit
- $1,679,788
- Equity at exit
- $238,565
- IRR
- 86.2%
- Equity multiple
- 9.47×
- Total profit
- $3,793,583
- Equity at exit
- $138,339
Cash invested: $448,000 (down + closing). Projections, not guarantees.
Landlord ↔ Tenant lean methodology
- Overall (STATE)
- 90 Strongly Landlord-Friendly
- State Alabama
- 90 Strongly Landlord-Friendly · R+15
- County
- — inherits STATE
- City
- — inherits STATE
ZIP-level market 35805
- Home prices YoY
- -17.4%
- Rents YoY
- 1.8%
- Active inventory
- 133
- Price-to-rent
- 89.9×
Monthly cashflow live
- Estimated rent
- $51,926 high interval (Pro) →
- Mortgage (P&I)
- −$8,391
- Tax from tax record
- −$561 /mo · $6,731/yr
- Insurance
- −$667
- HOA
- −$0
- Vacancy / Maint / Mgmt
- −$10,904
- Net cashflow
- $31,403
Break-even live
35-unit breakdown (identical units grouped — click to expand)
| Units | Beds | Baths | Est. rent |
|---|---|---|---|
| 35× units | 4 | 4 | $51,940 |
| #1 | 4 | 4 | $1,484 |
| #2 | 4 | 4 | $1,484 |
| #3 | 4 | 4 | $1,484 |
| #4 | 4 | 4 | $1,484 |
| #5 | 4 | 4 | $1,484 |
| #6 | 4 | 4 | $1,484 |
| #7 | 4 | 4 | $1,484 |
| #8 | 4 | 4 | $1,484 |
| #9 | 4 | 4 | $1,484 |
| #10 | 4 | 4 | $1,484 |
| #11 | 4 | 4 | $1,484 |
| #12 | 4 | 4 | $1,484 |
| #13 | 4 | 4 | $1,484 |
| #14 | 4 | 4 | $1,484 |
| #15 | 4 | 4 | $1,484 |
| #16 | 4 | 4 | $1,484 |
| #17 | 4 | 4 | $1,484 |
| #18 | 4 | 4 | $1,484 |
| #19 | 4 | 4 | $1,484 |
| #20 | 4 | 4 | $1,484 |
| #21 | 4 | 4 | $1,484 |
| #22 | 4 | 4 | $1,484 |
| #23 | 4 | 4 | $1,484 |
| #24 | 4 | 4 | $1,484 |
| #25 | 4 | 4 | $1,484 |
| #26 | 4 | 4 | $1,484 |
| #27 | 4 | 4 | $1,484 |
| #28 | 4 | 4 | $1,484 |
| #29 | 4 | 4 | $1,484 |
| #30 | 4 | 4 | $1,484 |
| #31 | 4 | 4 | $1,484 |
| #32 | 4 | 4 | $1,484 |
| #33 | 4 | 4 | $1,484 |
| #34 | 4 | 4 | $1,484 |
| #35 | 4 | 4 | $1,484 |
| Total (35 units) | $51,926 | ||
UW: 25.0% down · 7.5% · 30yr · 1.5% tax · 5.0% vac · 8.0% maint · 8.0% mgmt
Financing live
Cash to close
- Down payment
- $400,000
- Closing costs
- $48,000
- Reserves months
- —
- Total cash needed
- —
Loan-product check · same deal, 3 products live
Conventional
25% down · 7.5% · 30yr
- Down + closing
- —
- Monthly P&I
- —
- Monthly cashflow
- —
- DSCR
- —
- Eligible?
- —
Personal DTI + credit; lowest rate.
DSCR
20% down · 8.5% · 30yr
- Down + closing
- —
- Monthly P&I
- —
- Monthly cashflow
- —
- DSCR
- —
- Eligible?
- —
No personal income docs; deal must DSCR.
Hard money
10% down · 12.0% · 12mo
- Down + closing
- —
- Monthly P&I
- —
- Monthly cashflow
- —
- DSCR
- —
- Eligible?
- —
Short-term bridge; refi at stabilization.
Listing history 18 events
-
2026-05-30statusdays on market $1,600,000 Pending 319 DOM
-
2026-03-18historical Contingent
-
2025-10-28status Active
-
2025-10-28price $1,600,000
-
2025-10-14historical Contingent
-
2025-07-15$1,550,000 Active
-
2025-02-19historical
-
2025-02-06status Active
-
2025-01-06historical
-
2024-09-26price $1,350,000
-
2024-09-26price $1,250,000
-
2024-09-26$1,185,000 Active
-
2022-11-15historical
-
2021-11-09soldstatus $1,950,000
-
2019-08-12soldstatus $525,000
-
2018-11-02soldstatus $183,500
-
2017-11-14soldstatus $348,400
-
2015-10-06soldstatus $120,000
ⓘ Source: listings_history table (triggers on properties + properties_extension) + one-shot
backfill from property_details.listing_events for pre-trigger history.
Tax reassessment forecast AL · Resets to sale price
- Current annual tax
- $6,731 · $561/mo
- Projected year-2 tax
- $6,731 · $561/mo
- Expected delta
- $0/yr ($0/mo · 0.0%)
ⓘ Screening estimate from a state-policy table — verify with the county assessor before closing.
Climate risk First Street
- Flood 1/10 Low FEMA zone X (unshaded) · 0% chance over 30 yrs
- Wildfire 2/10 Low
- Heat 5/10 Major 7 d/yr ≥105°F today · 20 d/yr by 30 yrs out
- Wind 4/10 Moderate 19% chance of damaging wind over 30 yrs
- Air quality 2/10 Low 1 unhealthy d/yr today · 1 by 30 yrs out
Nearby sold comps map
Loading sold comps map…
Walkable amenities ~0.75 mi
Loading nearby amenities…
Taxation est. · year 1
- Rental income
- $623,112
- − Mortgage interest
- −$89,625
- − Property taxes
- −$6,731
- − Insurance
- −$8,000
- − Repairs & maintenance
- −$49,849
- − Management
- −$49,849
- − Depreciation
- −$46,545
- Taxable income
- $372,512
- Est. tax owed @ 24.0%
- −$89,403
- After-tax cash flow
- $287,437/yr
For passive investors: Depreciation is non-cash, so a rental often shows a tax loss while cash-flowing — sheltering income. Rental losses are passive: they offset passive income freely, and up to $25,000/yr can offset ordinary (W-2) income if you actively participate and your MAGI is under $100k (phasing out to $0 by $150k); unused losses carry forward. On sale, claimed depreciation is recaptured at up to 25%, and gains may owe capital-gains tax (a 1031 exchange can defer both). Figures are a year-1 estimate at your 24.0% rate — not tax advice; consult a CPA.
Schools (NCES district)
- District
- Huntsville City
- NCES district ID
- 0101800
- Math proficiency
- 21% ▼ -23.00%
- Reading proficiency
- 46% ▬ 0.00%
- Median HH income
- $48,264
- Composite
- 28.84/100
- National rank
- #6647
- State rank
- #48 of 129 in AL
Livability — Huntsville
- Score
- 82/100
- State rank
- #3
- US rank
- #1082
Category grades
Schools grade is shown separately in the Schools card above.
Census & demographics
- Census place
- Huntsville, AL
- County
- Madison County · 380,832 people
- City population
- 220,435
- Metro
- Huntsville, AL
- Population (ZIP)
- 20,856
- Household income
- $35,385
- Rent vs Own
- Severe rent burden
- 1750.0
Population outlook (Madison County) Hauer SSP2
- Today (2025)
- 392,086 people
- By 2030
- 409,788 · +4.5%
- By 2040
- 440,557 · +12.4%
- By 2050
- 460,990 · +17.6%
- By 2075
- 502,872 · +28.3%
- By 2100
- 513,623 · +31.0%
Race, ethnicity, and origin ACS 2023
- Neighborhood character
- Diverse neighborhood (Simpson 0.69)
- Race & ethnicity
- White 40% Black 31% Hispanic / Latino 24% Two or more races 8%
- Hispanic origin (detail)
- Mexican 17% Puerto Rican 2%
- Common ancestry
- Lithuanian 1% Slovak 1% Serbian 1%
- Foreign-born
- 16% · Canada, Jamaica
- Languages at home
- 76% English-only · Spanish 22% German/W. Germanic 1%
Political lean MEDSL · Madison
- 2024 margin
- Lean R (+9.0) · D 44.7% · R 53.7% · Other 1.6%
- 2008→2024 swing
- +6.0pp toward D · 2008: -14.9pp · 2024: -9.0pp
- All cycles
- 2024: R+9.0 2020: R+8.0 2016: R+16.8 2012: R+18.7 2008: R+14.9
Not yet ingested
- Civics
- —
Market trends
- HPI YoY
- ▼ -48.03%
- Current HPI
- 228.6963
- Rent YoY
- ▲ 1.82%
- Metro
- Huntsville, AL
- State GDP YoY
- ▲ 2.94%
- F500 in state
- 4
Industry mix (Fortune 500 HQ in AL)
| Industry | F500 HQs | Revenue |
|---|---|---|
| Financial Services | 1 | $8B |
|
||
| Healthcare | 1 | $5B |
|
||
Price history
+1233.3% since first listed17 events — show timeline
- 2026-03-18 Contingent — VMLS
- 2025-10-28 Relisted — VMLS
- 2025-10-28 Price Changed $1,600,000 VMLS
- 2025-10-14 Contingent — VMLS
- 2025-07-15 Listed $1,550,000 VMLS
- 2025-02-19 Delisted — VMLS
- 2025-02-06 Relisted — VMLS
- 2025-01-06 Delisted — VMLS
- 2024-09-26 Price Changed $1,350,000 VMLS
- 2024-09-26 Price Changed $1,250,000 VMLS
- 2024-09-26 Listed $1,185,000 VMLS
- 2022-11-15 Rental Removed — RENT.
- 2021-11-09 Sold (Public Records) $1,950,000 Public Records
- 2019-08-12 Sold (Public Records) $525,000 Public Records
- 2018-11-02 Sold (Public Records) $183,500 Public Records
- 2017-11-14 Sold (Public Records) $348,400 Public Records
- 2015-10-06 Sold (Public Records) $120,000 Public Records
Property tax history
+12.7%/yrLatest (2024): $6,731 · +0.0% YoY. Source: county tax records.
Cash-flow waterfall
monthlySold comps — $/sqft
last 12 mo · ≤1 miLoading sold comps…