 🏗️ New Construction
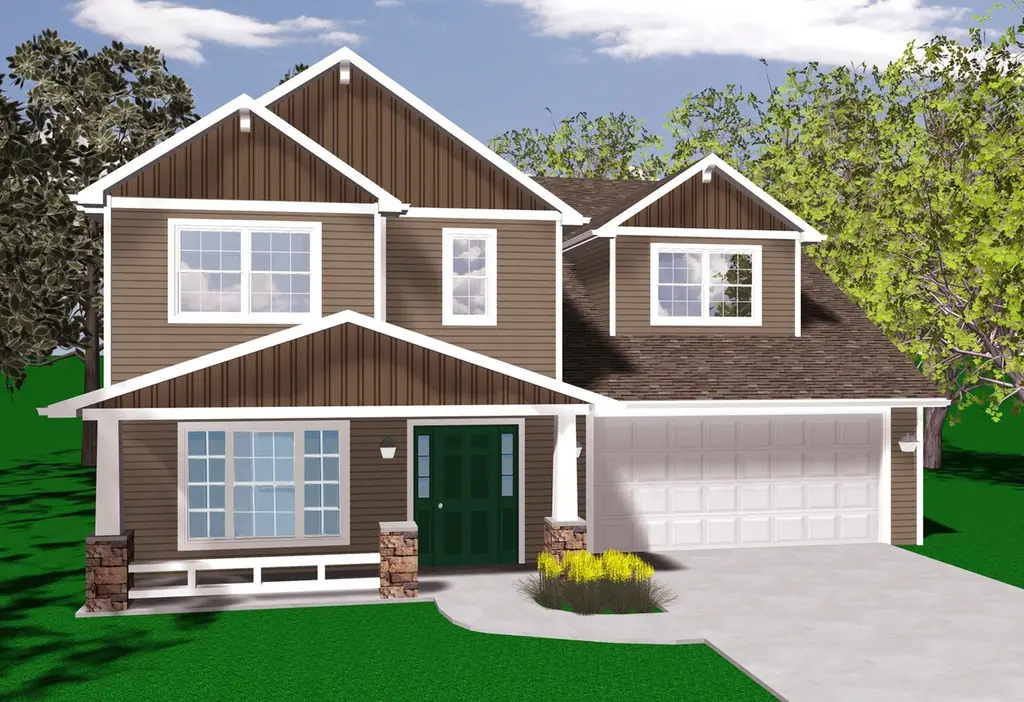
Lancia's Noah Shane II Plan · Huntertown, IN
Flood risk No data
- FEMA flood zone
- —
- Chance of flooding over 30 yrs
- —
- Est. flood insurance / yr
- —
Fire risk No data
- Est. fire insurance / yr
- —
Heat risk No data
- Hot days now (above threshold)
- —
- Hot days in 30 yrs
- —
Wind risk No data
- Chance of severe wind over 30 yrs
- —
Air-quality risk No data
- Unhealthy air days now
- —
- Unhealthy air days in 30 yrs
- —
Risk factors via First Street. Map © Google.
Why this score? — see what drove the F grade
The composite is a weighted blend of 9 inputs, each scored 0–100. Each bar is that input's sub-score; the figure is the points it added to the 100-point composite (weight × sub-score).
- ARV discount +7.5/15.0
- Schools +4.9/10.0
- Cash flow +4.7/30.0
- Rent growth +4.4/5.0
- Livability +3.5/5.0
- Condition / age +1.0/5.0
- 1% rule +0.7/10.0
- DSCR +0.0/10.0
- Appreciation +0.0/10.0
$313,900
🖨 Deal sheet (PDF) 📄 Offer letter ✓ Due diligence
Listing remarks MLS
THIS IS A SAMPLE PLAN - THIS IS NOT A HOME FOR SALE. Lancia's Noah Shane II is a spacious two-story with features to meet your family's needs. Great Room has triple windows and is open to the Kitchen and Nook. Kitchen has corner pantry, island with half shell shape breakfast bar. Office or Bonus Room with French doors off Foyer. Owner Suite Bedroom 1 has walk-in closet, Bath has dual sink vanity, linen closet and 5' Shower. Bedroom 4 also has a walk-in closet. Cubbie Lockers in Laundry Room Large Loft with alcove area at the top of the stairs. 42" cabinet by Garage hallway 3-Car space in Garage can also be upgraded to an additional Owner suite, 5th Bedroom, Mother-in-Law Suite or added living space with an additional entrance added from Nook. A full basement is available. 3-Car Garage with 2-cars deep is standard. (Garage entry into attic storage not available above standard Garage due to access on 2nd floor. ) * Base price does not include land
Key facts
- Walk-in closet
- Linen closet
- 5 shower
Tags
Neighborhood map
What this means for you Summary
Snapshot
- This is a 4-bed/2.5-bath single-family listed at $314k. Condition is rated poor.
Deal economics
- At list price, monthly cash flow is $-972 ($-12k/yr) — negative.
- To cash-flow at today's rent, offer at most $248k (21.0% below list).
- To meet the 1% rule (rent ≥ 1% of price), the offer needs to be $223k (29.1% below list).
- Recommended offer: $223k (29.1% below list) — sets the bar for 1% rule.
Location & tenants
- Location reads 70/100 on livability (#159 in IN) — a middle-class / working-renter tenant base. Strengths: employment A+, cost of living A+, housing A+; Watch: amenities F, commute F, health & safety F.
- Northwest Allen County Schools (rural): math 51% / reading 58% proficiency, ranked #25 of 301 in IN (top 8%) — acceptable for families but not a draw, mixed tenant base, ~2y average lease; only 11% free/reduced lunch — higher-income household profile.
- Zoned schools: Arcola School (math 72% / reading 62%, grade B+, #55 of 994 statewide, top 6%, 216 students, 33% FRL); Carroll Middle School (math 39% / reading 55%, grade D+, #65 of 330 statewide, top 21%, 994 students, 29% FRL); Carroll High School (math 59% / reading 86%, grade B+, #10 of 369 statewide, top 3%, 2,554 students, 21% FRL) — zoned schools average 28% FRL vs 11% district-wide (17 pts higher); higher-poverty schools than district average — tighter screening recommended.
- Market conditions: Rents rising fast (+7.6%/yr); 330 active listings in the ZIP; 1 comparable units currently listed for rent nearby; solid renter incomes; 1,861 units permitted in Allen County in 2024 (576 in 5+ unit buildings).
- This rent runs 33% of the median local income ($81k/yr) — at the standard rent-burdened threshold; future hikes will face affordability resistance.
Forward outlook
- Local home prices are declining (-3.0%/yr); year-one equity from $3k of loan paydown is wiped out by about $12k of value loss. Plan a longer hold.
- Allen County population projected at +10% by 2050 — modest demand growth; plan on rents tracking national, not racing it.
Negotiation context
- It's been on market 304 days — a 12% lower offer ($276k) is reasonable based on typical stale-listing flexibility.
Questions for the listing agent
- What do current leases actually rent for vs. the listed asking? Can we see a recent rent roll and the last 12 months of T-12 income?
- It's been on market 304 days. Have you received any prior offers? Is the seller open to a 29% concession, seller financing, or rate buy-down credit?
- Have any recent inspections been done? Can we get a copy of the seller's disclosures and any deferred-maintenance estimates?
- What does the HOA fee cover, when was the last increase, and are there any pending special assessments or reserve-fund shortfalls?
- Why hasn't it sold? Are there any deal-killer items the seller is aware of (foundation, flood, title, zoning, code violations)?
- Is there a deadline driving the sale (1031 exchange, divorce, estate, relocation)? That informs how much negotiation room exists.
- The area grade is low — what's the realistic commute time and amenity access for the typical tenant pool here? Any planned neighborhood developments (good or bad) we should know about?
- What's the average days-on-market for RENTAL listings here right now (not sales)? A rising rental-DOM trend means longer vacancies and softer asking-rent achievability than the comps imply.
- What's the recent tenant-quality profile in this submarket — average credit score on applications, eviction rate, late-payment / NSF rate, and stable-employment percentage? A property-management company in the area should have these aggregated.
- How much new for-sale + rental construction is in the pipeline within 1–3 miles? Heavy new supply typically softens prices + rents 12–24 months out; constrained supply supports both.
Investment metrics
- 1% rule
- 0.57% ✗
- Cap rate
- 3.29%
- Cash-on-cash
- -10.72%
- DSCR
- 0.52
- GRM
- 14.5
CMA / ARV
- ARV (median comp)
- $388,539
- List price
- $313,900
- Delta
- -19.21%
- Verdict
- UNDERPRICED
- Comps
- 20 within 1.0 mi
Show comp detail 12 sales within ~0.75 mi
| Address | Dist | Beds/Ba | Sqft | Sold | Price | $/sf | Match |
|---|---|---|---|---|---|---|---|
| 5517 Tranquilo Way | 0.28mi | 4/2.5 | 2,346 (-11%) | 1mo | $329,085 | $140 | 67 |
| 5138 Gadwall Pass | 0.64mi | 4/2.5 | 2,588 (-2%) | 2mo | $440,000 | $170 | 65 |
| 12839 Watts Dr | 0.50mi | 5/3.0 (+1) | 2,600 (-2%) | 2mo | $387,130 | $149 | 65 |
| 11883 Baikal Pass | 0.60mi | 4/3.0 | 2,714 (+3%) | 2mo | $521,500 | $192 | 64 |
| 5495 Tranquilo Way | 0.28mi | 5/3.0 (+1) | 2,415 (-9%) | 3mo | $324,900 | $135 | 63 |
| 4841 Whittlebury Dr | 0.34mi | 4/2.5 | 2,322 (-12%) | 2mo | $379,900 | $164 | 62 |
| 5390 Fair Creek Run | 0.25mi | 3/2.0 (-1) | 2,315 (-12%) | 1mo | $513,400 | $222 | 60 |
| 4313 Great Hollow Ct | 0.57mi | 4/2.5 | 2,438 (-8%) | 2mo | $475,000 | $195 | 59 |
| 5371 Elk Run Pl | 0.42mi | 4/2.5 | 2,299 (-13%) | 1mo | $412,000 | $179 | 58 |
| 12843 Watts Dr | 0.51mi | 4/2.5 | 2,346 (-11%) | 3mo | $350,650 | $149 | 55 |
| 11704 Hand Rd | 0.57mi | 4/2.0 | 2,297 (-13%) | 2mo | $290,000 | $126 | 47 |
| 13156 Watling Path | 0.50mi | 3/2.0 (-1) | 2,328 (-12%) | 3mo | $509,670 | $219 | 47 |
Match score weights: distance 35% · size 25% · config 20% · recency 20%. Top-matched comps best support the ARV.
Projected returns pro-forma
-3.0% appreciation · 7.64% rent growth · sell at horizon
- IRR
- -30.7%
- Equity multiple
- -0.05×
- Total profit
- $-113,905
- Equity at exit
- $57,932
- IRR
- -18.6%
- Equity multiple
- -0.19×
- Total profit
- $-129,489
- Equity at exit
- $33,594
Cash invested: $108,791 (down + closing). Projections, not guarantees.
Landlord ↔ Tenant lean methodology
- Overall (STATE)
- 90 Strongly Landlord-Friendly
- State Indiana
- 90 Strongly Landlord-Friendly · R+11
- County
- — inherits STATE
- City
- — inherits STATE
ZIP-level market 46818
- Rents YoY
- 7.6%
- Active inventory
- 330
- Price-to-rent
- 11.8×
Monthly cashflow live
- Estimated rent
- $2,226 medium interval (Pro) →
- Mortgage (P&I)
- −$2,038
- Tax est. 1.5%
- −$486 /mo · $5,828/yr
- Insurance
- −$162
- HOA
- −$45
- Lot rent
- −$0
- Vacancy / Maint / Mgmt
- −$467
- Net cashflow
- $-972
Break-even live
Sensitivity live
| Price | -10% $-703 | -5% $-837 | +0% $-972 | +5% $-1,106 | +10% $-1,240 |
|---|---|---|---|---|---|
| Rent | -10% $-1,147 | -5% $-1,060 | +0% $-972 | +5% $-884 | +10% $-796 |
| Rate | -1.0pp $-776 | -0.5pp $-873 | base $-972 | +0.5pp $-1,072 | +1.0pp $-1,175 |
UW: 25.0% down · 7.5% · 30yr · 1.5% tax · 5.0% vac · 8.0% maint · 8.0% mgmt
Financing live
Cash to close
- Down payment
- $97,135
- Closing costs
- $11,656
- Reserves months
- —
- Total cash needed
- —
Loan-product check · same deal, 3 products live
Conventional
25% down · 7.5% · 30yr
- Down + closing
- —
- Monthly P&I
- —
- Monthly cashflow
- —
- DSCR
- —
- Eligible?
- —
Personal DTI + credit; lowest rate.
DSCR
20% down · 8.5% · 30yr
- Down + closing
- —
- Monthly P&I
- —
- Monthly cashflow
- —
- DSCR
- —
- Eligible?
- —
No personal income docs; deal must DSCR.
Hard money
10% down · 12.0% · 12mo
- Down + closing
- —
- Monthly P&I
- —
- Monthly cashflow
- —
- DSCR
- —
- Eligible?
- —
Short-term bridge; refi at stabilization.
Rent comps 1 comps
| Address | Beds | Baths | Sqft | Rent | $/sqft | DOM | Units | Dist |
|---|---|---|---|---|---|---|---|---|
| 5045 Portney Pl Fort Wayne, IN | 4.0 | 2.5 | 2226 | $2,300 | $1.03 | 46d | 1 | 0.12mi |
HOA detail
- Monthly dues
- $45 · $540/yr
Listing history 18 events
-
2026-06-23days on market $313,900 Active 304 DOM
-
2026-06-21days on market $313,900 Active 303 DOM
-
2026-06-18days on market $313,900 Active 300 DOM
-
2026-06-17days on market $313,900 Active 299 DOM
-
2026-06-16days on market $313,900 Active 298 DOM
-
2026-06-15days on market $313,900 Active 297 DOM
-
2026-06-14days on market $313,900 Active 295 DOM
-
2026-06-13days on market $313,900 Active 294 DOM
-
2026-06-10days on market $313,900 Active 292 DOM
-
2026-06-09days on market $313,900 Active 291 DOM
-
2026-06-08days on market $313,900 Active 290 DOM
-
2026-06-07days on market $313,900 Active 289 DOM
-
2026-06-03days on market $313,900 Active 285 DOM
-
2026-06-02pricedays on market $313,900 Active 284 DOM
-
2026-06-01days on market $302,700 Active 283 DOM
-
2026-05-31days on market $302,700 Active 282 DOM
-
2026-05-30days on market $302,700 Active 281 DOM
-
2025-08-22$302,700 Active 966-char remark
Show marketing remark (966 chars)
THIS IS A SAMPLE PLAN - THIS IS NOT A HOME FOR SALE. Lancia's Noah Shane II is a spacious two-story with features to meet your family's needs. Great Room has triple windows and is open to the Kitchen and Nook. Kitchen has corner pantry, island with half shell shape breakfast bar. Office or Bonus Room with French doors off Foyer. Owner Suite Bedroom 1 has walk-in closet, Bath has dual sink vanity, linen closet and 5' Shower. Bedroom 4 also has a walk-in closet. Cubbie Lockers in Laundry Room Large Loft with alcove area at the top of the stairs. 42" cabinet by Garage hallway 3-Car space in Garage can also be upgraded to an additional Owner suite, 5th Bedroom, Mother-in-Law Suite or added living space with an additional entrance added from Nook. A full basement is available. 3-Car Garage with 2-cars deep is standard. (Garage entry into attic storage not available above standard Garage due to access on 2nd floor. ) * Base price does not include land
ⓘ Source: listings_history table (triggers on properties + properties_extension) + one-shot
backfill from property_details.listing_events for pre-trigger history.
Nearby sold comps map
Loading sold comps map…
Walkable amenities ~0.75 mi
Loading nearby amenities…
Taxation est. · year 1
- Rental income
- $26,711
- − Mortgage interest
- −$21,764
- − Property taxes
- −$5,828
- − Insurance
- −$1,943
- − Repairs & maintenance
- −$2,137
- − Management
- −$2,137
- − HOA
- −$540
- − Depreciation
- −$11,303
- Taxable loss
- −$18,941
- Est. tax savings @ 24.0%
- +$4,546
- After-tax cash flow
- $-7,114/yr
For passive investors: Depreciation is non-cash, so a rental often shows a tax loss while cash-flowing — sheltering income. Rental losses are passive: they offset passive income freely, and up to $25,000/yr can offset ordinary (W-2) income if you actively participate and your MAGI is under $100k (phasing out to $0 by $150k); unused losses carry forward. On sale, claimed depreciation is recaptured at up to 25%, and gains may owe capital-gains tax (a 1031 exchange can defer both). Figures are a year-1 estimate at your 24.0% rate — not tax advice; consult a CPA.
Condition & rehab AI · 2 photos
This property requires extensive repairs and updates to its roof, exterior, interior, and systems, significantly impacting its current condition and value. Significant investment is needed to bring it up to a livable standard.
Repairs flagged
- Major roof — No visible roof in the satellite image.
- Major exterior siding — No visible exterior in the satellite image.
- Major interior walls and paint — No visible interior walls or paint in the satellite image.
- Major systems — No visible systems in the satellite image.
Value-add opportunities
- Both roof replacement — A new roof would significantly improve the home's appearance and functionality.
- Both exterior siding and paint — A fresh coat of paint and new siding would enhance curb appeal and increase the home's value.
- Both interior walls and paint — Fresh paint and repairs to interior walls would improve the home's condition and appeal.
- Both system upgrades — Upgrading systems like HVAC and electrical would improve the home's functionality and value.
Renovation cost estimate screening
| Repair item | Severity | Est. cost |
|---|---|---|
| roof · No visible roof in the satellite image. | Major | $15,000–50,000 |
| exterior siding · No visible exterior in the satellite image. | Major | $15,000–50,000 |
| interior walls and paint · No visible interior walls or paint in the satellite image. | Major | $15,000–50,000 |
| systems · No visible systems in the satellite image. | Major | $15,000–50,000 |
| Total estimated repair cost · 4 items | $60,000–200,000 |
Value-add ROI direction
- Both roof replacement — A new roof would significantly improve the home's appearance and functionality. ↑
- Both exterior siding and paint — A fresh coat of paint and new siding would enhance curb appeal and increase the home's value. ↑
- Both interior walls and paint — Fresh paint and repairs to interior walls would improve the home's condition and appeal. ↑
- Both system upgrades — Upgrading systems like HVAC and electrical would improve the home's functionality and value. ↑
ⓘ Cost ranges are severity-bucket heuristics (US national rule-of-thumb). Get contractor quotes + a written scope before underwriting a rehab budget.
Schools (NCES district)
- District
- Northwest Allen County Schools
- NCES district ID
- 1808250
- Math proficiency
- 51% ▼ -6.00%
- Reading proficiency
- 58% ▼ -5.00%
- Median HH income
- $78,952
- Composite
- 49.26/100
- National rank
- #2027
- State rank
- #25 of 301 in IN
Livability — Huntertown
- Score
- 70/100
- State rank
- #159
- US rank
- #7771
Category grades
Schools grade is shown separately in the Schools card above.
Census & demographics
- County
- Allen County · 326,813 people
- Metro
- Fort Wayne, IN
- Population (ZIP)
- 21,954
- Household income
- $81,066
- Rent vs Own
- Severe rent burden
- 101.0
Population outlook (Allen County) Hauer SSP2
- Today (2025)
- 394,020 people
- By 2030
- 405,128 · +2.8%
- By 2040
- 423,476 · +7.5%
- By 2050
- 435,137 · +10.4%
- By 2075
- 450,293 · +14.3%
- By 2100
- 424,101 · +7.6%
Race, ethnicity, and origin ACS 2023
- Neighborhood character
- Predominantly White (79%)
- Race & ethnicity
- White 79% Two or more races 8% Hispanic / Latino 7% Black 4% Asian 3%
- Hispanic origin (detail)
- Mexican 6%
- Common ancestry
- Italian 4% Slovak 3% Romanian 2%
- Foreign-born
- 8% · Canada, Vietnam, Philippines
- Languages at home
- 90% English-only · Spanish 4% Other Asian/Pacific 1% Vietnamese 1%
Political lean MEDSL · Allen
- 2024 margin
- R (+12.5) · D 42.9% · R 55.4% · Other 1.7%
- 2008→2024 swing
- -8.1pp toward R · 2008: -4.3pp · 2024: -12.5pp
- All cycles
- 2024: R+12.5 2020: R+11.2 2016: R+19.6 2012: R+16.8 2008: R+4.3
Not yet ingested
- Civics
- —
Market trends
- HPI YoY
- ▼ -217.71%
- Current HPI
- 228.1539
- Rent YoY
- ▲ 7.64%
- Metro
- Fort Wayne, IN
- State GDP YoY
- ▲ 2.90%
- F500 in state
- 18
Industry mix (Fortune 500 HQ in IN)
| Industry | F500 HQs | Revenue |
|---|---|---|
| Industrial Machinery | 2 | $37B |
|
||
| Healthcare | 1 | $177B |
|
||
| Pharmaceuticals | 1 | $45B |
|
||
| Metals / Steel | 1 | $18B |
|
||
| Agriculture | 1 | $17B |
|
||
| Packaging | 1 | $12B |
|
||
Price history
1 event — show timeline
- 2025-08-22 Listed $302,700 Zillow
Cash-flow waterfall
monthlySold comps — $/sqft
last 12 mo · ≤1 miLoading sold comps…