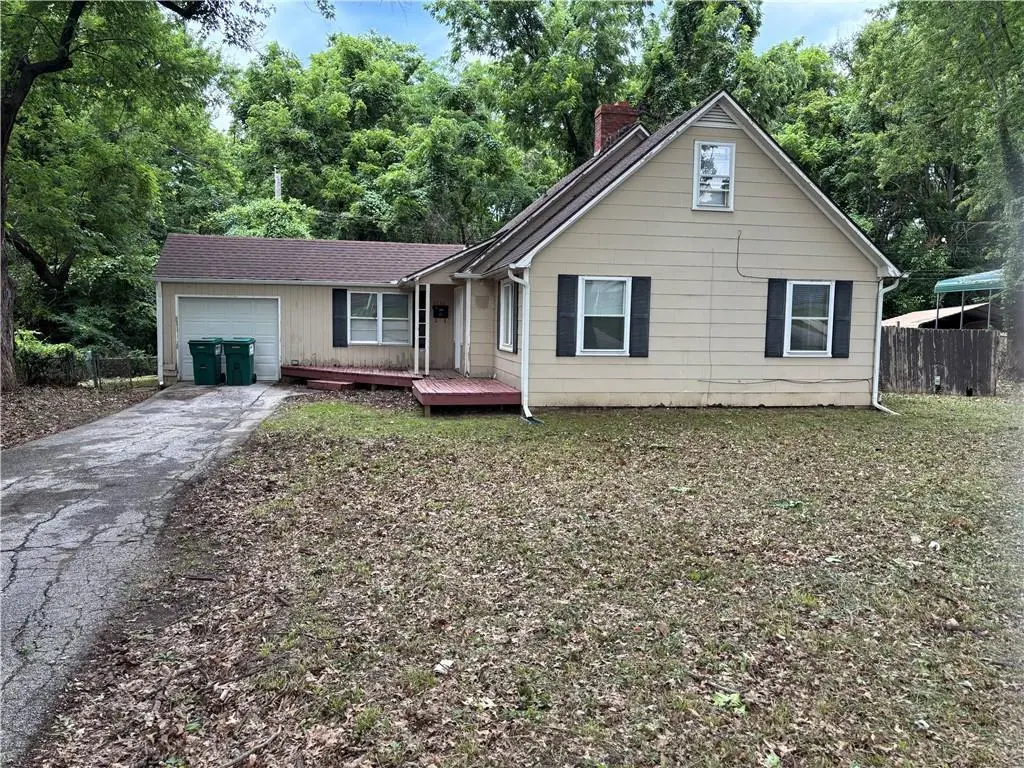
8732 E 73rd Ter · Raytown, MO
Flood risk 1/10 · Minimal
- FEMA flood zone
- X (unshaded)
- Chance of flooding over 30 yrs
- 0.0%
- Est. flood insurance / yr
- $473 – $860
Fire risk 1/10 · Minimal
- Est. fire insurance / yr
- $1,054 – $1,958
Heat risk 4/10 · Minor
- Hot days now (above 107°F)
- 7 days/yr
- Hot days in 30 yrs
- 16 days/yr
Wind risk 2/10 · Minimal
- Chance of severe wind over 30 yrs
- —
Air-quality risk 3/10 · Minor
- Unhealthy air days now
- 3 days/yr
- Unhealthy air days in 30 yrs
- 5 days/yr
Risk factors via First Street. Map © Google.
Why this score? — see what drove the C+ grade
The composite is a weighted blend of 9 inputs, each scored 0–100. Each bar is that input's sub-score; the figure is the points it added to the 100-point composite (weight × sub-score).
- Cash flow +23.1/30.0
- ARV discount +15.0/15.0
- DSCR +7.4/10.0
- 1% rule +5.8/10.0
- Livability +3.2/5.0
- Rent growth +2.8/5.0
- Condition / age +2.5/5.0
- Schools +1.8/10.0
- Appreciation +0.0/10.0
$149,900
🖨 Deal sheet (PDF) 📄 Offer letter ✓ Due diligence
Listing remarks MLS
Property to be sold "As-Is/Where-Is", No seller's disclosure, No warranty, No guarantees. All offers MUST include Earnest Dep, Proof of funds or Pre-Approval letter. Please allow a few days to reply. PLEASE CONTACT LISTING AGENT FOR A COPY OF SELLER'S ADDENDUMS PRIOR TO WRITING AN OFFER. ALLOW 2 BUSINESS DAYS FOR OFFERS TO BE REVIEWED. BUYERS ARE TO BE PRE-QUALIFIED BY COUNTRYWIDE MORTGAGE PRIOR TO SUBMITTAL OF OFFER.
Key facts
- 8,238 sq ft lot
- Garage
- Built 1900
Property features AI
Exterior
- Parking: Attached garage (1 car, garage faces front)
- Utilities: Public water; Public sewer; Metro Free telecom
- Home design: Single-family residential; 2-story floor plan; Fixer condition
- Construction: Asbestos and wood siding exterior; Composition roof; House is over 100 years old
- Exterior features: Front porch; City lot (approx. 84 x 112 ft)
Interior
- Kitchen: Kitchen on first level
- Bedrooms: 3 bedrooms (two on second level, primary on first level)
- Bathrooms: 2 full bathrooms
- Heating & cooling: Cooling present; No heating specified
- Interior features: Family room; Bonus room; Full concrete basement
- Laundry & utility: Laundry in basement
Neighborhood map
What this means for you Summary
Snapshot
- This is a 3-bed/1.5-bath single-family listed at $150k.
Deal economics
- At list price, monthly cash flow is $269 ($3k/yr) — positive.
- The deal already cash-flows at list — no discount required.
- Meets the 1% rule at list price ($2k rent vs $150k).
- Cap rate 8.4% vs local median 5.0% in Raytown — top-decile yield for the area; either an underpriced asset or a hidden risk that comps aren't pricing in. Stress-test before assuming the spread holds.
Location & tenants
- Location reads 65/100 on livability (#281 in MO) — a middle-class / working-renter tenant base. Strengths: cost of living A+, housing A+, health & safety B+; Watch: crime F, amenities F, commute F.
- Raytown C-2 (suburban): math 12% / reading 28% proficiency, ranked #302 of 324 in MO (top 93%) — low school quality limits family demand, transient renter base, plan for 1-2y turnover.
- Zoned schools: Westridge Elem. (math 2% / reading 17%, grade F, #1,037 of 1,115 statewide, top 94%, 321 students, 74% FRL); South Middle (math 6% / reading 25%, grade F, #359 of 391 statewide, top 92%, 522 students, 73% FRL); Raytown South Sr. High (math 8% / reading 32%, grade F, #475 of 521 statewide, top 92%, 1,185 students, 68% FRL) — zoned schools average 72% FRL vs 54% district-wide (18 pts higher); higher-poverty schools than district average — tighter screening recommended.
- Market conditions: Rents rising (+1.3%/yr); 208 active listings in the ZIP; 20 comparable units currently listed for rent nearby; rentals at typical pace (median 18d on market — plan ~3-4 weeks tenant-placement turnaround); 4,002 units permitted in Jackson County in 2024 (2,271 in 5+ unit buildings).
Forward outlook
- Local home prices are declining (-3.0%/yr); year-one equity from $1k of loan paydown is wiped out by about $4k of value loss. Plan a longer hold.
- Jackson County population projected at +4% by 2050 — modest demand growth; plan on rents tracking national, not racing it.
Negotiation context
- Only 2 days on market — expect competitive offers; lowballing is unlikely to land.
- 3 sale attempts since 19y ago with the ask held roughly flat each time — persistent listings suggest the price (not the market) is what's stuck; bring a comps-based counter.
Risks & watch-outs
- Watch-outs: built in 1900 — expect roof / HVAC / electrical / plumbing capex.
Questions for the listing agent
- Built in 1900 — when were the roof, HVAC, electrical panel, plumbing, and water heater last replaced?
- Is there a deadline driving the sale (1031 exchange, divorce, estate, relocation)? That informs how much negotiation room exists.
- Schools are D-rated, which usually means shorter tenancies and higher turnover. Who's the typical renter profile here, and what's been the actual vacancy rate?
- Crime grade is F in this area — have there been break-ins, vandalism, or insurance claims at this property in the last 3 years? What carrier currently insures it and at what premium?
- What's the average days-on-market for RENTAL listings here right now (not sales)? A rising rental-DOM trend means longer vacancies and softer asking-rent achievability than the comps imply.
- What's the recent tenant-quality profile in this submarket — average credit score on applications, eviction rate, late-payment / NSF rate, and stable-employment percentage? A property-management company in the area should have these aggregated.
- How much new for-sale + rental construction is in the pipeline within 1–3 miles? Heavy new supply typically softens prices + rents 12–24 months out; constrained supply supports both.
Investment metrics
- 1% rule
- 1.08% ✓
- Cap rate
- 8.45%
- Cash-on-cash
- 7.69%
- DSCR
- 1.34
- GRM
- 7.7
CMA / ARV
- ARV (on-the-fly)
- $197,120
- Comps found
- 12
Show comp detail 12 sales within ~0.75 mi
| Address | Dist | Beds/Ba | Sqft | Sold | Price | $/sf | Match |
|---|---|---|---|---|---|---|---|
| 7402 Blue Ridge Blvd | 0.10mi | 3/1.5 | 1,208 (-6%) | 12mo | $190,000 | $157 | 76 |
| 7012 Kentucky Ave | 0.40mi | 3/1.0 | 1,290 (+1%) | 5mo | $149,900 | $116 | 74 |
| 7300 Elm Ave | 0.48mi | 3/2.0 | 1,290 (+1%) | 2mo | $247,000 | $191 | 73 |
| 8812 E 72nd Ter | 0.21mi | 3/2.0 | 1,190 (-7%) | 6mo | $174,950 | $147 | 72 |
| 8716 E 74th St | 0.06mi | 2/2.0 (-1) | 1,386 (+8%) | 6mo | $145,000 | $105 | 71 |
| 7306 Elm Ave | 0.49mi | 4/2.0 (+1) | 1,296 (+1%) | 6mo | $199,000 | $154 | 62 |
| 8721 E 74 St | 0.08mi | 3/2.5 | 1,462 (+14%) | 8mo | $257,000 | $176 | 62 |
| 7212 Oxford Ave | 0.55mi | 3/2.0 | 1,381 (+8%) | 5mo | $200,000 | $145 | 55 |
| 7138 Sycamore Ave | 0.64mi | 2/1.5 (-1) | 1,326 (+4%) | 6mo | $195,000 | $147 | 54 |
| 9206 Vaughn Ave | 0.39mi | 4/2.0 (+1) | 1,184 (-8%) | 10mo | $230,000 | $194 | 54 |
| 7714 James A Reed Rd | 0.74mi | 2/1.0 (-1) | 1,229 (-4%) | 4mo | $165,000 | $134 | 48 |
| 8709 E 79th St | 0.74mi | 3/1.5 | 1,210 (-6%) | 12mo | $235,000 | $194 | 46 |
Match score weights: distance 35% · size 25% · config 20% · recency 20%. Top-matched comps best support the ARV.
Projected returns pro-forma
-3.0% appreciation · 1.34% rent growth · sell at horizon
- IRR
- -6.4%
- Equity multiple
- 0.77×
- Total profit
- $-9,812
- Equity at exit
- $22,351
- IRR
- 1.1%
- Equity multiple
- 1.07×
- Total profit
- $2,997
- Equity at exit
- $12,961
Cash invested: $41,972 (down + closing). Projections, not guarantees.
Landlord ↔ Tenant lean methodology
- Overall (STATE)
- 81 Strongly Landlord-Friendly
- State Missouri
- 81 Strongly Landlord-Friendly · R+10
- County
- — inherits STATE
- City
- — inherits STATE
ZIP-level market 64133
- Rents YoY
- 1.3%
- Active inventory
- 208
- Price-to-rent
- 7.7×
Monthly cashflow live
- Estimated rent
- $1,617 high interval (Pro) →
- Mortgage (P&I)
- −$786
- Tax from tax record
- −$160 /mo · $1,917/yr
- Insurance
- −$62
- HOA
- −$0
- Vacancy / Maint / Mgmt
- −$340
- Net cashflow
- $269
Break-even live
Sensitivity live
| Price | -10% $354 | -5% $311 | +0% $269 | +5% $226 | +10% $184 |
|---|---|---|---|---|---|
| Rent | -10% $141 | -5% $205 | +0% $269 | +5% $333 | +10% $397 |
| Rate | -1.0pp $344 | -0.5pp $307 | base $269 | +0.5pp $230 | +1.0pp $191 |
UW: 25.0% down · 7.5% · 30yr · 1.5% tax · 5.0% vac · 8.0% maint · 8.0% mgmt
Financing live
Cash to close
- Down payment
- $37,475
- Closing costs
- $4,497
- Reserves months
- —
- Total cash needed
- —
Loan-product check · same deal, 3 products live
Conventional
25% down · 7.5% · 30yr
- Down + closing
- —
- Monthly P&I
- —
- Monthly cashflow
- —
- DSCR
- —
- Eligible?
- —
Personal DTI + credit; lowest rate.
DSCR
20% down · 8.5% · 30yr
- Down + closing
- —
- Monthly P&I
- —
- Monthly cashflow
- —
- DSCR
- —
- Eligible?
- —
No personal income docs; deal must DSCR.
Hard money
10% down · 12.0% · 12mo
- Down + closing
- —
- Monthly P&I
- —
- Monthly cashflow
- —
- DSCR
- —
- Eligible?
- —
Short-term bridge; refi at stabilization.
Rent comps 20 comps
| Address | Beds | Baths | Sqft | Rent | $/sqft | DOM | Units | Dist |
|---|---|---|---|---|---|---|---|---|
| 8907 E 73rd St Raytown, MO | 3.0 | 1.0 | 1000 | $1,595 | $1.59 | 16d | 1 | 0.15mi |
| 8800 E 71st Ter Raytown, MO | 3.0 | 2.0 | 1497 | $1,650 | $1.10 | 25d | 1 | 0.24mi |
| 8713 E 77th Ter Kansas City, MO | 3.0 | 2.0 | 1124 | $1,800 | $1.60 | 45d | 1 | 0.54mi |
| 9005 E 68th Ter Raytown, MO | 4.0 | 2.0 | 1566 | $1,936 | $1.24 | 5d | 1 | 0.66mi |
| 7720 Elm Ave Kansas City, MO | 3.0 | 1.5 | 1400 | $1,700 | $1.21 | 45d | 1 | 0.79mi |
| 7704 E 75th Ter Kansas City, MO | 3.0 | 1.0 | 1016 | $1,325 | $1.30 | 18d | 1 | 0.83mi |
| 7607 Arlington Ave Raytown, MO | 3.0 | 1.5 | 1225 | $1,461 | $1.19 | 18d | 1 | 0.84mi |
| 7712 Arlington Ave Raytown, MO | 3.0 | 2.0 | 1358 | $1,741 | $1.28 | 14d | 1 | 0.90mi |
| 7917 Ditzler Ave Raytown, MO | 3.0 | 1.0 | 912 | $1,450 | $1.59 | 5d | 1 | 0.93mi |
| 9408 E 68th St Raytown, MO | 2.0 | 1.0 | 1112 | $1,295 | $1.16 | 18d | 1 | 0.94mi |
| 7600 E 70th Ter Kansas City, MO | 3.0 | 2.0 | 1604 | $1,601 | $1.00 | 6d | 1 | 0.94mi |
| 7905 Elm Ave Raytown, MO | 3.0 | 1.5 | 1104 | $1,700 | $1.54 | 4d | 1 | 0.96mi |
| 7929 Sycamore Ave Kansas City, MO | 2.0 | 1.0 | 1044 | $1,200 | $1.15 | 9d | 2 | 1.00mi |
| 6512 Marsh Ave Kansas City, MO | 3.0 | 2.5 | 1463 | $1,978 | $1.35 | 0d | 1 | 1.11mi |
| 6500 Marsh Ave Unit 6512 Kansas City, MO | 3.0 | 2.5 | 1463 | $1,945 | $1.33 | 25d | 1 | 1.13mi |
| 8951 E 83rd St Raytown, MO | 4.0 | 2.0 | 926 | $1,516 | $1.64 | 25d | 1 | 1.25mi |
| 9400 E 82nd St Raytown, MO | 3.0 | 2.0 | 1396 | $1,606 | $1.15 | 5d | 1 | 1.28mi |
| 7421 Hardy Ave Raytown, MO | 3.0 | 2.5 | 1696 | $1,699 | $1.00 | 4d | 1 | 1.28mi |
| 9706 E 65th Ter Raytown, MO | 3.0 | 1.0 | 995 | $1,295 | $1.30 | 45d | 1 | 1.28mi |
| 10213 E 78 St Raytown, MO | 3.0 | 2.0 | 1160 | $1,410 | $1.22 | 23d | 1 | 1.35mi |
Listing history 2 events
-
2026-06-21remarks 155-char remark
-
2026-06-21$149,900 Active 2 DOM
ⓘ Source: listings_history table (triggers on properties + properties_extension) + one-shot
backfill from property_details.listing_events for pre-trigger history.
Tax reassessment forecast MO · Resets to sale price
- Current annual tax
- $1,917 · $160/mo
- Projected year-2 tax
- $1,917 · $160/mo
- Expected delta
- $0/yr ($0/mo · 0.0%)
ⓘ Screening estimate from a state-policy table — verify with the county assessor before closing.
Climate risk First Street
- Flood 1/10 Low FEMA zone X (unshaded) · 0% chance over 30 yrs
- Wildfire 1/10 Low
- Heat 4/10 Moderate 7 d/yr ≥107°F today · 16 d/yr by 30 yrs out
- Wind 2/10 Low
- Air quality 3/10 Moderate 3 unhealthy d/yr today · 5 by 30 yrs out
Nearby sold comps map
Loading sold comps map…
Walkable amenities ~0.75 mi
Loading nearby amenities…
Taxation est. · year 1
- Rental income
- $19,400
- − Mortgage interest
- −$8,397
- − Property taxes
- −$1,917
- − Insurance
- −$750
- − Repairs & maintenance
- −$1,552
- − Management
- −$1,552
- − Depreciation
- −$4,361
- Taxable income
- $873
- Est. tax owed @ 24.0%
- −$209
- After-tax cash flow
- $3,017/yr
For passive investors: Depreciation is non-cash, so a rental often shows a tax loss while cash-flowing — sheltering income. Rental losses are passive: they offset passive income freely, and up to $25,000/yr can offset ordinary (W-2) income if you actively participate and your MAGI is under $100k (phasing out to $0 by $150k); unused losses carry forward. On sale, claimed depreciation is recaptured at up to 25%, and gains may owe capital-gains tax (a 1031 exchange can defer both). Figures are a year-1 estimate at your 24.0% rate — not tax advice; consult a CPA.
Schools (NCES district)
- District
- Raytown C-2
- NCES district ID
- 2926070
- Math proficiency
- 12% ▼ -11.00%
- Reading proficiency
- 28% ▼ -9.00%
- Median HH income
- $47,215
- Composite
- 17.59/100
- National rank
- #9039
- State rank
- #302 of 324 in MO
Livability — Raytown
- Score
- 65/100
- State rank
- #281
- US rank
- #13079
Category grades
Schools grade is shown separately in the Schools card above.
Census & demographics
- Census place
- Raytown, MO
- County
- Jackson County · 687,798 people
- City population
- 60,054
- Metro
- Kansas City, MO-KS
- Population (ZIP)
- 36,249
- Household income
- $67,750
- Rent vs Own
- Severe rent burden
- 1173.0
Population outlook (Jackson County) Hauer SSP2
- Today (2025)
- 719,589 people
- By 2030
- 731,456 · +1.6%
- By 2040
- 746,689 · +3.8%
- By 2050
- 749,289 · +4.1%
- By 2075
- 736,227 · +2.3%
- By 2100
- 668,210 · -7.1%
Race, ethnicity, and origin ACS 2023
- Neighborhood character
- Diverse neighborhood (Simpson 0.64)
- Race & ethnicity
- White 46% Black 37% Hispanic / Latino 12% Two or more races 9%
- Hispanic origin (detail)
- Mexican 10%
- Common ancestry
- Italian 7% Slovak 1% Lithuanian 1%
- Foreign-born
- 5% · Canada
- Languages at home
- 90% English-only · Spanish 7% French/Haitian/Cajun 1%
Political lean MEDSL · Jackson
- 2024 margin
- D (+19.3) · D 58.9% · R 39.5% · Other 1.6%
- 2008→2024 swing
- -6.1pp toward R · 2008: 25.4pp · 2024: 19.3pp
- All cycles
- 2024: D+19.3 2020: D+22.0 2016: D+16.6 2012: D+19.0 2008: D+25.4
Not yet ingested
- Civics
- —
Market trends
- HPI YoY
- ▼ -155.40%
- Current HPI
- 263.6915
- Rent YoY
- ▲ 1.34%
- Metro
- Kansas City, MO-KS
- State GDP YoY
- ▲ 1.84%
- F500 in state
- 20
Industry mix (Fortune 500 HQ in MO)
| Industry | F500 HQs | Revenue |
|---|---|---|
| Healthcare | 1 | $163B |
|
||
| Insurance | 1 | $21B |
|
||
| Industrial Technology | 1 | $17B |
|
||
| Retail | 1 | $16B |
|
||
| Industrial Distribution | 1 | $10B |
|
||
| Utilities | 1 | $9B |
|
||
Price history
+275.7% since first listed10 events — show timeline
- 2026-06-20 Listed $149,900 Heartland MLS as Distributed by MLS Grid
- 2026-06-19 Coming Soon $149,900 Heartland MLS as Distributed by MLS Grid
- 2024-03-14 Rental Removed $1,295 APPFOLIO
- 2024-02-02 Price Changed $1,295 APPFOLIO
- 2024-01-07 Listed for Rent $1,350 APPFOLIO
- 2008-03-28 Sold (MLS) — Heartland MLS as Distributed by MLS Grid
- 2007-10-25 Listed $39,900 Heartland MLS as Distributed by MLS Grid
- 2003-10-31 Sold (Public Records) — Public Records
- 2002-10-03 Sold (Public Records) — Public Records
- 2002-01-25 Sold (Public Records) — Public Records
Property tax history
+4.3%/yrLatest (2025): $1,917 · +1.6% YoY. Source: county tax records.
Cash-flow waterfall
monthlySold comps — $/sqft
last 12 mo · ≤1 miLoading sold comps…