 Duplex
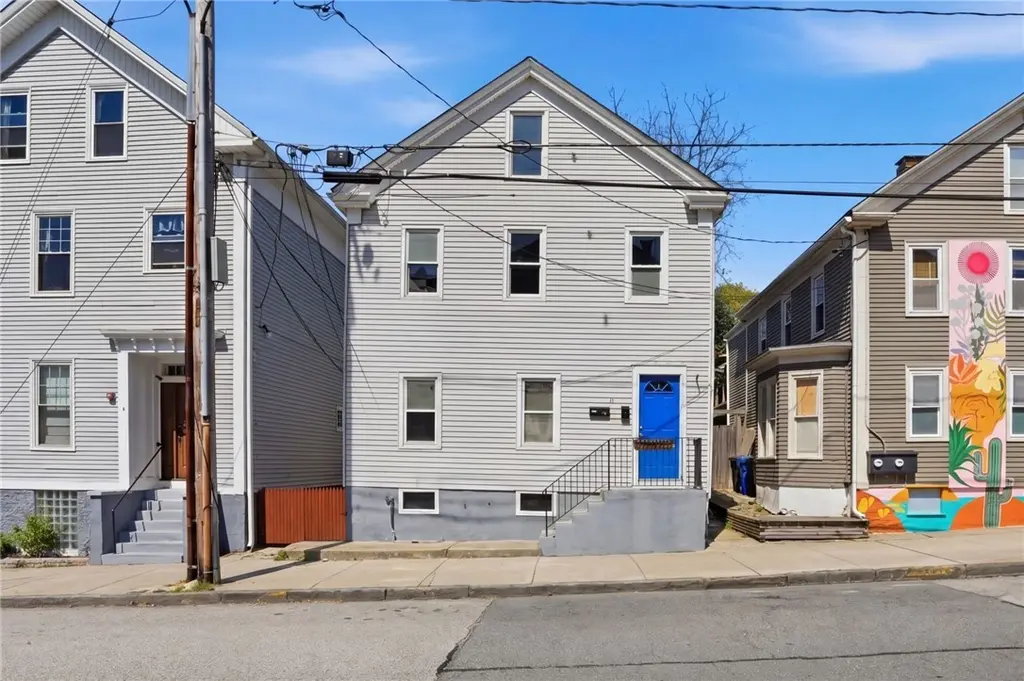
8 Mann Ave · Newport, RI
Flood risk 1/10 · Minimal
- FEMA flood zone
- X (unshaded)
- Chance of flooding over 30 yrs
- 0.0%
- Est. flood insurance / yr
- $507 – $1,088
Fire risk 1/10 · Minimal
- Est. fire insurance / yr
- $835 – $1,551
Heat risk 6/10 · Moderate
- Hot days now (above 89°F)
- 7 days/yr
- Hot days in 30 yrs
- 17 days/yr
Wind risk 8/10 · Major
- Chance of severe wind over 30 yrs
- 80.0%
Air-quality risk 2/10 · Minimal
- Unhealthy air days now
- 2 days/yr
- Unhealthy air days in 30 yrs
- 2 days/yr
Risk factors via First Street. Map © Google.
Why this score? — see what drove the C- grade
The composite is a weighted blend of 9 inputs, each scored 0–100. Each bar is that input's sub-score; the figure is the points it added to the 100-point composite (weight × sub-score).
- Cash flow +22.6/30.0
- ARV discount +7.5/15.0
- DSCR +7.3/10.0
- 1% rule +4.9/10.0
- Rent growth +4.8/5.0
- Livability +3.9/5.0
- Condition / age +2.5/5.0
- Schools +1.5/10.0
- Appreciation +0.0/10.0
$699,900
🖨 Deal sheet (PDF) 📄 Offer letter ✓ Due diligence
Multi-family units
County records classify this as Multi-Family (2-4 Unit). Listing-text estimate: 2 units. confirmed
Listing remarks
Ideally located in the heart of Newport's Kay/Broadway neighborhood, this two-family property offers the perfect blend of location, flexibility, and investment potential. Just off vibrant Broadway and within close walking distance to Thames Street, shops, restaurants and the Newport Harbor, the setting delivers the quintessential Newport lifestyle with unmatched convenience. The first-floor unit is in solid condition, making it ideal for an owner-occupant or immediate rental income. The second-floor unit presents a valuable opportunity for renovation making it perfect for adding equity and maximizing returns. Both units have hardwood flooring. Whether you're seeking a primary residence with
Key facts
- Hardwood flooring
- Newport harbor
- Two-family property
Tags
Property features AI
Finance
- Other: Zoning: R10
- HOA & community: Community amenities nearby: marina, pool, public transportation, recreation area, tennis courts, shopping, restaurants, near hospital and schools
Exterior
- Parking: No garage
- Utilities: Sewer connected; Water connected; Electric service 100 amps
- Home design: 3-story building; Multi-family property with 2 units in one building; Above-grade finished area 1,795
- Construction: Plaster and aluminum siding exterior; Concrete perimeter foundation
- Exterior features: Fenced yard
Interior
- Kitchen: Dishwasher; Microwave; Oven; Range; Refrigerator
- Bedrooms: One unit is two-bedroom; One unit is one-bedroom
- Flooring: Hardwood; Laminate
- Bathrooms: Two full bathrooms (total in building); Each unit includes a full bathroom
- Heating & cooling: Baseboard heating; Gas heating; Hot water heating
- Interior features: Skylights; Interior steps; Stall shower
- Laundry & utility: Gas water heater; Water heater
Neighborhood map
What this means for you Summary
Snapshot
- This is a 2 × 3-bed/2.0-bath units multifamily listed at $700k.
Deal economics
- At list price, monthly cash flow is $1k ($14k/yr) — positive. Per door: $597/mo.
- The deal already cash-flows at list — no discount required.
- To meet the 1% rule (rent ≥ 1% of price), the offer needs to be $694k (0.9% below list).
- Recommended offer: $694k (0.9% below list) — sets the bar for 1% rule.
- Cap rate 8.3% vs local median 2.3% in Newport — top-decile yield for the area; either an underpriced asset or a hidden risk that comps aren't pricing in. Stress-test before assuming the spread holds.
Location & tenants
- Location reads 78/100 on livability (#5 in RI, #2,367 nationally) — a middle-class / working-renter tenant base. Strengths: amenities A+, commute A+, health & safety A+; Watch: cost of living F.
- Newport (suburban): math 10% / reading 20% proficiency, ranked #29 of 39 in RI (top 74%) — low school quality limits family demand, transient renter base, plan for 1-2y turnover.
- Zoned schools: Claiborne Pell Elementary (math 10% / reading 23%, grade F, #124 of 167 statewide, top 74%, 697 students, 70% FRL); Frank E. Thompson Middle (math 8% / reading 16%, grade F, #42 of 57 statewide, top 75%, 546 students, 77% FRL); Rogers High School (math 17% / reading 32%, grade F, #35 of 58 statewide, top 60%, 633 students, 72% FRL).
- Market conditions: Rents rising fast (+9.3%/yr); 136 active listings in the ZIP; 40 comparable units currently listed for rent nearby; rentals at typical pace (median 25d on market — plan ~3-4 weeks tenant-placement turnaround); solid renter incomes; 94 units permitted in Newport County in 2024 (0 in 5+ unit buildings).
- At $6,938/mo this rent would consume 97% of the median local household income ($86k/yr) (locally 1294% of renters already pay >50% of income on rent) — very limited rent-growth headroom before tenants either downsize or default.
Forward outlook
- Local home prices are declining (-3.0%/yr); year-one equity from $5k of loan paydown is wiped out by about $21k of value loss. Plan a longer hold.
- Newport County population projected at -12% by 2050 — secular population decline; favor cash flow + early exit over multi-decade hold.
- At projected returns (-3.0% appreciation + 8.0% rent growth), your $196k cash investment doubles in ~9 years — after that, you're playing with house money.
Negotiation context
- Only 11 days on market — expect competitive offers; lowballing is unlikely to land.
Risks & watch-outs
- Watch-outs: built in 1900 — expect roof / HVAC / electrical / plumbing capex.
- Climate carrying-cost: severe wind risk, 80% chance of damaging wind over 30y; extreme-heat days projected 7→17/yr by 2055 (HVAC capex compounding) — expect insurance premiums to compound above CPI over the hold.
Questions for the listing agent
- Can we see the unit-by-unit rent roll, current vacancy, and any below-market leases? What's the average tenancy length?
- What capital expenditures (roof, boiler, parking lot, exteriors) have been made in the last 5 years, and what's planned in the next 2?
- Built in 1900 — when were the roof, HVAC, electrical panel, plumbing, and water heater last replaced?
- Is there a deadline driving the sale (1031 exchange, divorce, estate, relocation)? That informs how much negotiation room exists.
- Schools are D-rated, which usually means shorter tenancies and higher turnover. Who's the typical renter profile here, and what's been the actual vacancy rate?
- What's the average days-on-market for RENTAL listings here right now (not sales)? A rising rental-DOM trend means longer vacancies and softer asking-rent achievability than the comps imply.
- What's the recent tenant-quality profile in this submarket — average credit score on applications, eviction rate, late-payment / NSF rate, and stable-employment percentage? A property-management company in the area should have these aggregated.
- How much new apartment / multifamily construction is in the pipeline within 1–3 miles? Heavy new supply (>2% of stock underway) typically softens rents 12–24 months out; light construction supports rent growth.
Investment metrics
- 1% rule
- 0.99% ✗
- Cap rate
- 8.34%
- Cash-on-cash
- 7.31%
- DSCR
- 1.33
- GRM
- 8.4
CMA / ARV
No comps found within radius.
Projected returns pro-forma
-3.0% appreciation · 8.0% rent growth · sell at horizon
- IRR
- -0.1%
- Equity multiple
- 1.00×
- Total profit
- $-916
- Equity at exit
- $104,357
- IRR
- 13.8%
- Equity multiple
- 2.34×
- Total profit
- $263,081
- Equity at exit
- $60,515
Cash invested: $195,972 (down + closing). Projections, not guarantees.
Landlord ↔ Tenant lean methodology
- Overall (STATE)
- 31 Tenant-Leaning
- State Rhode Island
- 31 Tenant-Leaning · D+8
- County
- — inherits STATE
- City
- — inherits STATE
ZIP-level market 02840
- Rents YoY
- 9.3%
- Active inventory
- 136
- Price-to-rent
- 16.8×
Monthly cashflow live
- Estimated rent
- $6,938 high interval (Pro) →
- Mortgage (P&I)
- −$3,670
- Tax from tax record
- −$325 /mo · $3,897/yr
- Insurance
- −$292
- HOA
- −$0
- Vacancy / Maint / Mgmt
- −$1,457
- Net cashflow
- $1,194
Break-even live
Sensitivity live
| Price | -10% $1,590 | -5% $1,392 | +0% $1,194 | +5% $996 | +10% $798 |
|---|---|---|---|---|---|
| Rent | -10% $646 | -5% $920 | +0% $1,194 | +5% $1,468 | +10% $1,742 |
| Rate | -1.0pp $1,547 | -0.5pp $1,372 | base $1,194 | +0.5pp $1,013 | +1.0pp $828 |
2-unit breakdown (identical units grouped — click to expand)
| Units | Beds | Baths | Est. rent |
|---|---|---|---|
| 2× units | 3 | 2 | $6,938 |
| #1 | 3 | 2 | $3,469 |
| #2 | 3 | 2 | $3,469 |
| Total (2 units) | $6,938 | ||
UW: 25.0% down · 7.5% · 30yr · 1.5% tax · 5.0% vac · 8.0% maint · 8.0% mgmt
Financing live
Cash to close
- Down payment
- $174,975
- Closing costs
- $20,997
- Reserves months
- —
- Total cash needed
- —
Loan-product check · same deal, 3 products live
Conventional
25% down · 7.5% · 30yr
- Down + closing
- —
- Monthly P&I
- —
- Monthly cashflow
- —
- DSCR
- —
- Eligible?
- —
Personal DTI + credit; lowest rate.
DSCR
20% down · 8.5% · 30yr
- Down + closing
- —
- Monthly P&I
- —
- Monthly cashflow
- —
- DSCR
- —
- Eligible?
- —
No personal income docs; deal must DSCR.
Hard money
10% down · 12.0% · 12mo
- Down + closing
- —
- Monthly P&I
- —
- Monthly cashflow
- —
- DSCR
- —
- Eligible?
- —
Short-term bridge; refi at stabilization.
Rent comps 40 comps
| Address | Beds | Baths | Sqft | Rent | $/sqft | DOM | Units | Dist |
|---|---|---|---|---|---|---|---|---|
| 42 Mann Ave Unit 2 Newport, RI | 3.0 | 1.5 | 2400 | $12,000 | $5.00 | 25d | 1 | 0.15mi |
| 45 Ayrault St Newport, RI | 1.0–2.0 | 1.0–1.5 | 1646 | $7,000 | $4.25 | 6d | 3 | 0.16mi |
| 12 Sherman St Newport, RI | 4.0 | 2.0 | 1681 | $16,000 | $9.52 | 6d | 1 | 0.18mi |
| 24 Spring St Newport, RI | 4.0 | 3.0 | 2522 | $7,500 | $2.97 | 25d | 1 | 0.19mi |
| 8 Johnson Ct Newport, RI | 3.0 | 2.0 | 2016 | $6,000 | $2.98 | 25d | 1 | 0.22mi |
| 4 Barney St Newport, RI | 4.0 | 2.5 | 2168 | $5,000 | $2.31 | 25d | 1 | 0.24mi |
| 4 Kay Ter Newport, RI | 3.0 | 2.5 | 1822 | $4,500 | $2.47 | 25d | 1 | 0.25mi |
| 43 Sherman St Newport, RI | 3.0 | 2.5 | 1910 | $12,000 | $6.28 | 25d | 1 | 0.26mi |
| 12 Clarke St Newport, RI | 3.0 | 2.0 | 2000 | $3,000 | $1.50 | 4d | 1 | 0.29mi |
| 10 Clarke St Newport, RI | 2.0 | 1.0 | 2000 | $2,250 | $1.12 | 4d | 1 | 0.30mi |
| 5 Division St Newport, RI | 4.0 | 3.0 | 2200 | $4,000 | $1.82 | 25d | 1 | 0.30mi |
| 21 School St #4 Newport, RI | 2.0 | 2.5 | 1372 | $8,000 | $5.83 | 25d | 1 | 0.33mi |
| 75 Ayrault St Unit 1 Newport, RI | 2.0 | 1.0 | 1550 | $8,000 | $5.16 | 25d | 1 | 0.34mi |
| 14 Elm St Newport, RI | 3.0 | 1.5 | 1974 | $3,600 | $1.82 | 5d | 1 | 0.37mi |
| 3 Mayberry Ct Newport, RI | 2.0 | 2.5 | 1526 | $3,400 | $2.23 | 4d | 1 | 0.38mi |
| 32 Catherine St Unit B Newport, RI | 2.0 | 2.0 | 1506 | $8,000 | $5.31 | 25d | 1 | 0.39mi |
| 41 Hunter Ave Newport, RI | 4.0 | 2.0 | 1912 | $22,000 | $11.51 | 25d | 1 | 0.41mi |
| 24 Hunter Ave Newport, RI | 2.0 | 1.5 | 1243 | $7,500 | $6.03 | 18d | 1 | 0.41mi |
| 19 Congdon Ave Newport, RI | 3.0 | 1.5 | 1225 | $3,800 | $3.10 | 6d | 1 | 0.42mi |
| 35 Hall Ave Newport, RI | 4.0 | 2.0 | 1800 | $3,650 | $2.03 | 5d | 1 | 0.46mi |
| 35 Hall Ave Newport, RI | 4.0 | 2.0 | 1800 | $3,850 | $2.14 | 25d | 1 | 0.46mi |
| 93 Mill St Unit B Newport, RI | 3.0 | 3.5 | 1443 | $2,975 | $2.06 | 25d | 1 | 0.47mi |
| 58 Gibbs Ave Unit 2 Newport, RI | 3.0 | 2.0 | 1800 | $2,950 | $1.64 | 25d | 1 | 0.47mi |
| 20 Findlay Pl Newport, RI | 3.0 | 2.0 | 1767 | $4,200 | $2.38 | 25d | 1 | 0.48mi |
| 16 Robinson St Newport, RI | 3.0 | 1.5 | 1784 | $6,000 | $3.36 | 18d | 1 | 0.49mi |
| 92 Pelham St Unit 1 Newport, RI | 4.0 | 3.5 | 1800 | $12,000 | $6.67 | 25d | 1 | 0.50mi |
| 92 Pelham St Unit 1 Newport, RI | 4.0 | 3.5 | 1800 | $4,975 | $2.76 | 6d | 1 | 0.50mi |
| 82 Van Zandt Ave Newport, RI | 3.0 | 1.5 | 1263 | $3,600 | $2.85 | 6d | 1 | 0.50mi |
| 75 Pelham St Unit D Newport, RI | 2.0 | 2.0 | 1241 | $9,500 | $7.66 | 25d | 1 | 0.51mi |
| 63 Poplar St Unit 3 Newport, RI | 2.0 | 1.0 | 1300 | $2,800 | $2.15 | 6d | 1 | 0.54mi |
| 84 John St Unit C Newport, RI | 3.0 | 2.0 | 1450 | $4,500 | $3.10 | 25d | 1 | 0.60mi |
| 26 Red Cross Ave Newport, RI | 4.0 | 2.5 | 2536 | $20,000 | $7.89 | 15d | 1 | 0.61mi |
| 26 Red Cross Ave Newport, RI | 4.0 | 2.5 | 2536 | $10,000 | $3.94 | 25d | 1 | 0.61mi |
| 2 Red Cross Ter Newport, RI | 3.0 | 2.0 | 1387 | $3,000 | $2.16 | 25d | 1 | 0.62mi |
| 27 Red Cross Ave Newport, RI | 3.0 | 2.5 | 1680 | $3,900 | $2.32 | 25d | 1 | 0.62mi |
| 19 Eustis Ave Newport, RI | 3.0 | 2.5 | 1704 | $20,000 | $11.74 | 25d | 1 | 0.62mi |
| 19 Eustis Ave Newport, RI | 3.0 | 2.5 | 1704 | $3,750 | $2.20 | 3d | 1 | 0.62mi |
| 115 John St Newport, RI | 3.0 | 2.0 | 1525 | $10,000 | $6.56 | 25d | 1 | 0.63mi |
| 115 John St Newport, RI | 3.0 | 2.0 | 1525 | $13,000 | $8.52 | 5d | 1 | 0.63mi |
| 11 Eustis Ave Newport, RI | 3.0 | 2.0 | 1380 | $12,000 | $8.70 | 25d | 1 | 0.64mi |
Listing history 16 events
-
2026-06-21days on market $699,900 Active 11 DOM
-
2026-06-18days on market $699,900 Active 8 DOM
-
2026-06-17days on market $699,900 Active 7 DOM
-
2026-06-16days on market $699,900 Active 6 DOM
-
2026-06-15days on market $699,900 Active 5 DOM
-
2026-06-13pricedays on market $699,900 Active 3 DOM
-
2026-06-09days on market $749,999 Active 34 DOM
-
2026-06-08days on market $749,999 Active 33 DOM
-
2026-06-07days on market $749,999 Active 32 DOM
-
2026-06-05days on market $749,999 Active 29 DOM
-
2026-06-03days on market $749,999 Active 28 DOM
-
2026-06-02days on market $749,999 Active 27 DOM
-
2026-06-01days on market $749,999 Active 26 DOM
-
2026-05-31days on market $749,999 Active 25 DOM
-
2026-05-13price $749,999
-
2026-05-06$824,999 Active
ⓘ Source: listings_history table (triggers on properties + properties_extension) + one-shot
backfill from property_details.listing_events for pre-trigger history.
Tax reassessment forecast RI · Partial reset (capped growth)
- Current annual tax
- $3,897 · $325/mo
- Projected year-2 tax
- $7,653 · $638/mo
- Expected delta
- +$3,756/yr (+$313/mo · 96.4%)
ⓘ Screening estimate from a state-policy table — verify with the county assessor before closing.
Climate risk First Street
- Flood 1/10 Low FEMA zone X (unshaded) · 0% chance over 30 yrs
- Wildfire 1/10 Low
- Heat 6/10 Major 7 d/yr ≥89°F today · 17 d/yr by 30 yrs out
- Wind 8/10 Severe 80% chance of damaging wind over 30 yrs
- Air quality 2/10 Low 2 unhealthy d/yr today · 2 by 30 yrs out
Nearby sold comps map
Loading sold comps map…
Walkable amenities ~0.75 mi
Loading nearby amenities…
Taxation est. · year 1
- Rental income
- $83,256
- − Mortgage interest
- −$39,205
- − Property taxes
- −$3,897
- − Insurance
- −$3,500
- − Repairs & maintenance
- −$6,660
- − Management
- −$6,660
- − Depreciation
- −$20,361
- Taxable income
- $2,973
- Est. tax owed @ 24.0%
- −$713
- After-tax cash flow
- $13,618/yr
For passive investors: Depreciation is non-cash, so a rental often shows a tax loss while cash-flowing — sheltering income. Rental losses are passive: they offset passive income freely, and up to $25,000/yr can offset ordinary (W-2) income if you actively participate and your MAGI is under $100k (phasing out to $0 by $150k); unused losses carry forward. On sale, claimed depreciation is recaptured at up to 25%, and gains may owe capital-gains tax (a 1031 exchange can defer both). Figures are a year-1 estimate at your 24.0% rate — not tax advice; consult a CPA.
Schools (NCES district)
- District
- Newport
- NCES district ID
- 4400720
- Math proficiency
- 10% ▼ -11.00%
- Reading proficiency
- 20% ▼ -8.00%
- Median HH income
- $59,063
- Composite
- 14.6/100
- National rank
- #9412
- State rank
- #29 of 39 in RI
Livability — Newport
- Score
- 78/100
- State rank
- #5
- US rank
- #2367
Category grades
Schools grade is shown separately in the Schools card above.
Census & demographics
- Census place
- Newport, RI
- County
- Newport County · 73,957 people
- City population
- 23,448
- Metro
- Providence-Warwick, RI-MA
- Population (ZIP)
- 23,448
- Household income
- $86,250
- Rent vs Own
- Severe rent burden
- 1294.0
Population outlook (Newport County) Hauer SSP2
- Today (2025)
- 81,198 people
- By 2030
- 79,518 · -2.1%
- By 2040
- 75,581 · -6.9%
- By 2050
- 71,801 · -11.6%
- By 2075
- 64,618 · -20.4%
- By 2100
- 56,724 · -30.1%
Race, ethnicity, and origin ACS 2023
- Neighborhood character
- Predominantly White (74%)
- Race & ethnicity
- White 74% Hispanic / Latino 11% Two or more races 9% Black 7% Asian 3%
- Hispanic origin (detail)
- Puerto Rican 6%
- Common ancestry
- Russian 5% Lithuanian 4% Romanian 4%
- Foreign-born
- 8% · Canada, China
- Languages at home
- 90% English-only · Spanish 6% Other Indo-European 2% Russian/Polish/Slavic 1%
Political lean MEDSL · Newport
- 2024 margin
- Strong D (+25.5) · D 61.6% · R 36.1% · Other 2.2%
- 2008→2024 swing
- +2.2pp toward D · 2008: 23.3pp · 2024: 25.5pp
- All cycles
- 2024: D+25.5 2020: D+29.8 2016: D+19.4 2012: D+17.7 2008: D+23.3
Not yet ingested
- Civics
- —
Market trends
- HPI YoY
- ▼ -1340.91%
- Current HPI
- 451.3919
- Rent YoY
- ▲ 9.32%
- Metro
- Providence-Warwick, RI-MA
- State GDP YoY
- ▲ 2.25%
- F500 in state
- 10
Industry mix (Fortune 500 HQ in RI)
| Industry | F500 HQs | Revenue |
|---|---|---|
| Healthcare | 1 | $373B |
|
||
| Food Distribution | 1 | $31B |
|
||
| Aerospace / Defense | 1 | $14B |
|
||
| Financial Services | 1 | $8B |
|
||
| Consumer Goods | 1 | $4B |
|
||
Price history
-9.1% since first listed2 events — show timeline
- 2026-05-13 Price Changed $749,999 RIS
- 2026-05-06 Listed $824,999 RIS
Property tax history
+2.6%/yrLatest (2025): $3,897 · +3.0% YoY. Source: county tax records.
Cash-flow waterfall
monthlySold comps — $/sqft
last 12 mo · ≤1 miLoading sold comps…