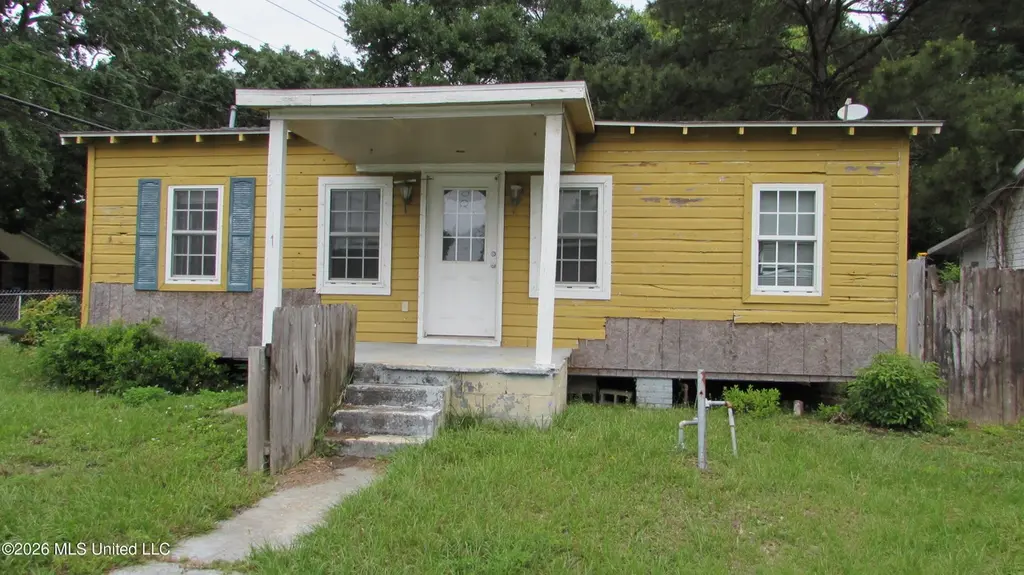
303 Myrtle St · Gulfport, MS
Flood risk 3/10 · Minor
- FEMA flood zone
- X (shaded)
- Chance of flooding over 30 yrs
- 0.09%
- Est. flood insurance / yr
- $507 – $1,088
Fire risk 1/10 · Minimal
- Est. fire insurance / yr
- $1,241 – $2,305
Heat risk 10/10 · Severe
- Hot days now (above 106°F)
- 7 days/yr
- Hot days in 30 yrs
- 23 days/yr
Wind risk 9/10 · Severe
- Chance of severe wind over 30 yrs
- 99.0%
Air-quality risk 3/10 · Minor
- Unhealthy air days now
- 2 days/yr
- Unhealthy air days in 30 yrs
- 3 days/yr
Risk factors via First Street. Map © Google.
Why this score? — see what drove the B+ grade
The composite is a weighted blend of 9 inputs, each scored 0–100. Each bar is that input's sub-score; the figure is the points it added to the 100-point composite (weight × sub-score).
- Cash flow +30.0/30.0
- ARV discount +15.0/15.0
- 1% rule +10.0/10.0
- DSCR +10.0/10.0
- Livability +3.7/5.0
- Rent growth +3.6/5.0
- Schools +3.4/10.0
- Condition / age +2.5/5.0
- Appreciation +0.0/10.0
$90,000
🖨 Deal sheet 📄 Offer letter ✓ Due diligence
Listing remarks MLS
Located on a corner lot!! Come See!
Key facts
- Fenced yard
- Newer roof
- Corner lot
Tags
Property features AI
Finance
- Other: Building area: 1,010 (source: public records); Lot dimensions approximately 68.0 x 123.5 x 42.0 x 119.0; Lot size about 0.15 acres
Exterior
- Parking: On-street parking
- Security: Other security features
- Utilities: Public water; Public sewer; Electricity connected; Water connected; Natural gas listed as not available under utilities (heating uses natural gas)
- Home design: Single-family house; One level
- Construction: Wood siding; Pillar/post/pier foundation; Asphalt shingle roof; Built (year source: public records)
- Exterior features: Front yard fencing; Fenced lot
Interior
- Kitchen: Free-standing refrigerator; Oven
- Flooring: Luxury vinyl flooring
- Bathrooms: One full bathroom; One half bathroom (1.5 total)
- Heating & cooling: Central heating (natural gas); Central electric air conditioning
- Interior features: Move-in ready condition; Private yard; Porch
- Laundry & utility: Indoor laundry room
Neighborhood map
What this means for you Summary
Snapshot
- This is a 2-bed/1.5-bath single-family listed at $90k.
Deal economics
- At list price, monthly cash flow is $561 ($7k/yr) — positive.
- The deal already cash-flows at list — no discount required.
- Meets the 1% rule at list price ($1k rent vs $90k).
- Recommended offer: $87k (3.0% below list) — sets the bar for market timing.
- Cap rate 13.8% vs local median 4.9% in Gulfport — top-decile yield for the area; either an underpriced asset or a hidden risk that comps aren't pricing in. Stress-test before assuming the spread holds.
Location & tenants
- Location reads 73/100 on livability (#15 in MS) — a middle-class / working-renter tenant base. Strengths: cost of living A+, housing A+, health & safety A+; Watch: schools D, amenities F, commute F.
- Gulfport School District (urban): math 41% / reading 42% proficiency, ranked #37 of 130 in MS (top 28%) — families likely to look elsewhere, expect single-tenant / working-renter base with shorter leases; 67% free/reduced lunch — lower-income household profile, screen leases tightly.
- Market conditions: Rents rising fast (+4.3%/yr); 301 active listings in the ZIP; 26 comparable units currently listed for rent nearby; rentals lingering (median 44d on market — plan ~5-8 weeks vacancy on turnover, expect pricing pressure); 54% of comp listings sitting > 30 days — soft ceiling on asking rent; 2,194 units permitted in Harrison County in 2024 (0 in 5+ unit buildings).
- This rent runs 31% of the median local income ($55k/yr) — at the standard rent-burdened threshold; future hikes will face affordability resistance.
Forward outlook
- Local home prices are declining (-3.0%/yr); year-one equity from $622 of loan paydown is wiped out by about $3k of value loss. Plan a longer hold.
- Harrison County population projected at +27% by 2050 — long-run rental-demand tailwind backs the buy-and-hold thesis.
- At projected returns (-3.0% appreciation + 4.3% rent growth), your $25k cash investment doubles in ~5 years — after that, you're playing with house money.
Negotiation context
- It's been on market 36 days — a 3% lower offer ($87k) is reasonable based on typical stale-listing flexibility.
- 2 sale attempts since 14y ago with the ask held roughly flat each time — persistent listings suggest the price (not the market) is what's stuck; bring a comps-based counter.
Risks & watch-outs
- Watch-outs: built in 1947 — expect roof / HVAC / electrical / plumbing capex.
- Climate carrying-cost: severe wind risk, 99% chance of damaging wind over 30y; extreme-heat days projected 7→23/yr by 2055 (HVAC capex compounding) — expect insurance premiums to compound above CPI over the hold.
Questions for the listing agent
- It's been on market 36 days. Have you received any prior offers? Is the seller open to a 3% concession, seller financing, or rate buy-down credit?
- Built in 1947 — when were the roof, HVAC, electrical panel, plumbing, and water heater last replaced?
- Is there a deadline driving the sale (1031 exchange, divorce, estate, relocation)? That informs how much negotiation room exists.
- Schools are D-rated, which usually means shorter tenancies and higher turnover. Who's the typical renter profile here, and what's been the actual vacancy rate?
- What's the average days-on-market for RENTAL listings here right now (not sales)? A rising rental-DOM trend means longer vacancies and softer asking-rent achievability than the comps imply.
- What's the recent tenant-quality profile in this submarket — average credit score on applications, eviction rate, late-payment / NSF rate, and stable-employment percentage? A property-management company in the area should have these aggregated.
- How much new for-sale + rental construction is in the pipeline within 1–3 miles? Heavy new supply typically softens prices + rents 12–24 months out; constrained supply supports both.
Investment metrics
- 1% rule
- 1.59% ✓
- Cap rate
- 13.77%
- Cash-on-cash
- 26.69%
- DSCR
- 2.19
- GRM
- 5.2
CMA / ARV
- ARV (median comp)
- $147,003
- List price
- $90,000
- Delta
- -38.78%
- Verdict
- UNDERPRICED
- Comps
- 20 within 1.0 mi
Show comp detail 12 sales within ~0.75 mi
| Address | Dist | Beds/Ba | Sqft | Sold | Price | $/sf | Match |
|---|---|---|---|---|---|---|---|
| 255 Lynwood Dr | 0.06mi | 3/1.0 (+1) | 1,040 (+3%) | 15mo | $135,000 | $130 | 73 |
| 259 Dolan Ave | 0.46mi | 2/2.0 | 1,010 (0%) | 7mo | $97,900 | $97 | 71 |
| 239 Palmetto Ln | 0.21mi | 3/1.0 (+1) | 1,077 (+7%) | 11mo | $224,500 | $208 | 63 |
| 263 Church Ave | 0.34mi | 2/1.0 | 932 (-8%) | 9mo | $175,000 | $188 | 62 |
| 13 E Park St | 0.45mi | 3/1.0 (+1) | 1,000 (-1%) | 14mo | $136,000 | $136 | 58 |
| 19 30th St | 0.27mi | 3/1.5 (+1) | 1,060 (+5%) | 19mo | $159,995 | $151 | 58 |
| 611 Mcintosh St | 0.39mi | 3/2.0 (+1) | 1,080 (+7%) | 11mo | $207,000 | $192 | 54 |
| 400 31st St | 0.72mi | 3/1.0 (+1) | 1,008 (-0%) | 14mo | $70,000 | $69 | 47 |
| 203 Milner Ave | 0.56mi | 3/2.0 (+1) | 1,131 (+12%) | 4mo | $199,500 | $176 | 44 |
| 2205 Oak Ave | 0.48mi | 3/1.0 (+1) | 1,144 (+13%) | 8mo | $139,900 | $122 | 42 |
| 201 Milner Ave | 0.56mi | 3/2.0 (+1) | 1,131 (+12%) | 18mo | $192,500 | $170 | 32 |
| 2218 Searle Ave | 0.73mi | 3/1.0 (+1) | 1,108 (+10%) | 14mo | $60,000 | $54 | 31 |
Match score weights: distance 35% · size 25% · config 20% · recency 20%. Top-matched comps best support the ARV.
Projected returns pro-forma
-3.0% appreciation · 4.26% rent growth · sell at horizon
- IRR
- 21.9%
- Equity multiple
- 1.91×
- Total profit
- $22,948
- Equity at exit
- $13,419
- IRR
- 30.7%
- Equity multiple
- 3.92×
- Total profit
- $73,663
- Equity at exit
- $7,782
Cash invested: $25,200 (down + closing). Projections, not guarantees.
Landlord ↔ Tenant lean methodology
- Overall (STATE)
- 90 Strongly Landlord-Friendly
- State Mississippi
- 90 Strongly Landlord-Friendly · R+11
- County
- — inherits STATE
- City
- — inherits STATE
ZIP-level market 39507
- Home prices YoY
- -27.1%
- Rents YoY
- 4.3%
- Active inventory
- 301
- Price-to-rent
- 5.2×
Monthly cashflow live
- Estimated rent
- $1,434 high interval (Pro) →
- Mortgage (P&I)
- −$472
- Tax from tax record
- −$63 /mo · $750/yr
- Insurance
- −$38
- HOA
- −$0
- Vacancy / Maint / Mgmt
- −$301
- Net cashflow
- $561
Break-even live
UW: 25.0% down · 7.5% · 30yr · 1.5% tax · 5.0% vac · 8.0% maint · 8.0% mgmt
Financing live
Cash to close
- Down payment
- $22,500
- Closing costs
- $2,700
- Reserves months
- —
- Total cash needed
- —
Loan-product check · same deal, 3 products live
Conventional
25% down · 7.5% · 30yr
- Down + closing
- —
- Monthly P&I
- —
- Monthly cashflow
- —
- DSCR
- —
- Eligible?
- —
Personal DTI + credit; lowest rate.
DSCR
20% down · 8.5% · 30yr
- Down + closing
- —
- Monthly P&I
- —
- Monthly cashflow
- —
- DSCR
- —
- Eligible?
- —
No personal income docs; deal must DSCR.
Hard money
10% down · 12.0% · 12mo
- Down + closing
- —
- Monthly P&I
- —
- Monthly cashflow
- —
- DSCR
- —
- Eligible?
- —
Short-term bridge; refi at stabilization.
Rent comps 26 comps
| Address | Beds | Baths | Sqft | Rent | $/sqft | DOM | Units | Dist |
|---|---|---|---|---|---|---|---|---|
| 124 30th 1/2 St Gulfport, MS | 2.0 | 1.5 | 1007 | $1,100 | $1.09 | 43d | 1 | 0.56mi |
| 3503 Hancock Ave Gulfport, MS | 2.0 | 2.5 | 1100 | $1,100 | $1.00 | 21d | 1 | 0.72mi |
| 3209 F Ave Gulfport, MS | 2.0 | 1.0 | 1000 | $850 | $0.85 | 43d | 1 | 0.73mi |
| 477 Tegarden Rd Unit D Gulfport, MS | 3.0 | 2.0 | 1300 | $1,300 | $1.00 | 13d | 1 | 0.81mi |
| 229 Milray Ln Gulfport, MS | 2.0 | 2.5 | 889 | $1,795 | $2.02 | 21d | 1 | 0.88mi |
| 696 Hunters Glen Ln Gulfport, MS | 3.0 | 1.5 | 1000 | $1,800 | $1.80 | 21d | 1 | 0.94mi |
| 986 Waterford Ln Gulfport, MS | 3.0 | 1.5 | 1000 | $1,650 | $1.65 | 43d | 1 | 0.95mi |
| 1101 Century Oaks Dr Gulfport, MS | 3.0 | 3.0 | 1330 | $1,700 | $1.28 | 43d | 1 | 0.99mi |
| 1131 Century Oaks Dr Gulfport, MS | 3.0 | 3.0 | 1156 | $1,800 | $1.56 | 43d | 1 | 0.99mi |
| 1229 Century Oaks Dr Gulfport, MS | 3.0 | 3.0 | 1200 | $2,600 | $2.17 | 21d | 1 | 1.00mi |
| 1100 Century Oaks Dr Unit A Gulfport, MS | 3.0 | 3.0 | 1156 | $2,200 | $1.90 | 43d | 1 | 1.01mi |
| 1270 Century Oaks Dr Gulfport, MS | 3.0 | 3.0 | 1158 | $1,950 | $1.68 | 43d | 1 | 1.03mi |
| 1276 Century Oaks Dr Gulfport, MS | 3.0 | 3.0 | 1283 | $2,100 | $1.64 | 43d | 1 | 1.06mi |
| 200 Commerce St Gulfport, MS | 2.0 | 1.0 | 900 | $1,100 | $1.22 | 21d | 1 | 1.09mi |
| 980 Courthouse Rd Unit 0426 Gulfport, MS | 1.0 | 1.0 | 892 | $1,539 | $1.73 | 43d | 1 | 1.18mi |
| 980 Courthouse Rd Unit 0829 Gulfport, MS | 1.0 | 1.0 | 892 | $1,160 | $1.30 | 43d | 1 | 1.18mi |
| 980 Courthouse Rd Unit 0409 Gulfport, MS | 1.0 | 1.0 | 892 | $1,139 | $1.28 | 13d | 1 | 1.18mi |
| 980 Courthouse Rd Unit 1605 Gulfport, MS | 2.0 | 2.0 | 1227 | $1,355 | $1.10 | 21d | 1 | 1.18mi |
| 980 Courthouse Rd Apt 512 Gulfport, MS | 1.0 | 1.0 | 892 | $1,209 | $1.36 | 21d | 1 | 1.18mi |
| 832 24th St Gulfport, MS | 2.0 | 1.0 | 800 | $950 | $1.19 | 43d | 1 | 1.25mi |
| 2313 5th Ave Gulfport, MS | 2.0 | 1.0 | 750 | $1,000 | $1.33 | 43d | 1 | 1.29mi |
| 2823 6th Ave Unit A Gulfport, MS | 3.0 | 2.0 | 1100 | $1,100 | $1.00 | 21d | 1 | 1.29mi |
| 2311 5th Ave Gulfport, MS | 3.0 | 1.5 | 1100 | $1,300 | $1.18 | 43d | 1 | 1.30mi |
| 2706 6th Ave Gulfport, MS | 3.0 | 2.0 | 1217 | $1,300 | $1.07 | 21d | 1 | 1.30mi |
| 2233 5th Ave Gulfport, MS | 3.0 | 1.0 | 1215 | $1,300 | $1.07 | 43d | 1 | 1.31mi |
| 941 22nd St Gulfport, MS | 3.0 | 2.0 | 1450 | $1,600 | $1.10 | 13d | 1 | 1.50mi |
Listing history 19 events
-
2026-06-18days on market $90,000 Active 36 DOM
-
2026-06-17days on market $90,000 Active 35 DOM
-
2026-06-16days on market $90,000 Active 34 DOM
-
2026-06-15days on market $90,000 Active 33 DOM
-
2026-06-14days on market $90,000 Active 31 DOM
-
2026-06-13days on market $90,000 Active 30 DOM
-
2026-06-10days on market $90,000 Active 28 DOM
-
2026-06-09days on market $90,000 Active 27 DOM
-
2026-06-08days on market $90,000 Active 26 DOM
-
2026-06-07days on market $90,000 Active 25 DOM
-
2026-06-05days on market $90,000 Active 22 DOM
-
2026-06-02days on market $90,000 Active 20 DOM
-
2026-06-01days on market $90,000 Active 19 DOM
-
2026-05-31days on market $90,000 Active 18 DOM
-
2026-05-30days on market $90,000 Active 17 DOM
-
2026-05-13$90,000 Active 117-char remark
-
2013-01-03soldstatus
-
2012-12-12soldstatus 35-char remark
Show marketing remark (35 chars)
Located on a corner lot!! Come See!
-
2012-04-18$23,700 35-char remark
Show marketing remark (35 chars)
Located on a corner lot!! Come See!
ⓘ Source: listings_history table (triggers on properties + properties_extension) + one-shot
backfill from property_details.listing_events for pre-trigger history.
Tax reassessment forecast MS · Resets to sale price
- Current annual tax
- $750 · $63/mo
- Projected year-2 tax
- $750 · $63/mo
- Expected delta
- $0/yr ($0/mo · 0.0%)
ⓘ Screening estimate from a state-policy table — verify with the county assessor before closing.
Climate risk First Street
- Flood 3/10 Moderate FEMA zone X (shaded) · 9% chance over 30 yrs
- Wildfire 1/10 Low
- Heat 10/10 Extreme 7 d/yr ≥106°F today · 23 d/yr by 30 yrs out
- Wind 9/10 Extreme 99% chance of damaging wind over 30 yrs
- Air quality 3/10 Moderate 2 unhealthy d/yr today · 3 by 30 yrs out
Nearby sold comps map
Loading sold comps map…
Walkable amenities ~0.75 mi
Loading nearby amenities…
Taxation est. · year 1
- Rental income
- $17,203
- − Mortgage interest
- −$5,041
- − Property taxes
- −$750
- − Insurance
- −$450
- − Repairs & maintenance
- −$1,376
- − Management
- −$1,376
- − Depreciation
- −$2,618
- Taxable income
- $5,591
- Est. tax owed @ 24.0%
- −$1,342
- After-tax cash flow
- $5,385/yr
For passive investors: Depreciation is non-cash, so a rental often shows a tax loss while cash-flowing — sheltering income. Rental losses are passive: they offset passive income freely, and up to $25,000/yr can offset ordinary (W-2) income if you actively participate and your MAGI is under $100k (phasing out to $0 by $150k); unused losses carry forward. On sale, claimed depreciation is recaptured at up to 25%, and gains may owe capital-gains tax (a 1031 exchange can defer both). Figures are a year-1 estimate at your 24.0% rate — not tax advice; consult a CPA.
Schools (NCES district)
- District
- Gulfport School District
- NCES district ID
- 2801710
- Math proficiency
- 41% ▼ -15.00%
- Reading proficiency
- 42% ▼ -6.00%
- Median HH income
- $35,712
- Composite
- 34.38/100
- National rank
- #5213
- State rank
- #37 of 130 in MS
Livability — Gulfport
- Score
- 73/100
- State rank
- #15
- US rank
- #5010
Category grades
Schools grade is shown separately in the Schools card above.
Census & demographics
- Census place
- Gulfport, MS
- County
- Harrison County · 178,171 people
- City population
- 96,188
- Metro
- Gulfport-Biloxi, MS
- Population (ZIP)
- 18,564
- Household income
- $54,657
- Rent vs Own
- Severe rent burden
- 1059.0
Population outlook (Harrison County) Hauer SSP2
- Today (2025)
- 228,444 people
- By 2030
- 241,942 · +5.9%
- By 2040
- 267,531 · +17.1%
- By 2050
- 291,062 · +27.4%
- By 2075
- 346,711 · +51.8%
- By 2100
- 378,165 · +65.5%
Race, ethnicity, and origin ACS 2023
- Neighborhood character
- Majority White (65%)
- Race & ethnicity
- White 65% Black 24% Hispanic / Latino 6% Two or more races 5% Asian 1%
- Hispanic origin (detail)
- Mexican 2% Cuban 1%
- Common ancestry
- Slovak 4% Lithuanian 4% Romanian 2%
- Foreign-born
- 4% · Canada
- Languages at home
- 94% English-only · Spanish 2% French/Haitian/Cajun 2% Other Indo-European 1%
Political lean MEDSL · Harrison
- 2024 margin
- Strong R (+28.9) · D 35.0% · R 63.9% · Other 1.1%
- 2008→2024 swing
- -2.9pp toward R · 2008: -26.0pp · 2024: -28.9pp
- All cycles
- 2024: R+28.9 2020: R+25.2 2016: R+30.7 2012: R+26.6 2008: R+26.0
Not yet ingested
- Civics
- —
Market trends
- HPI YoY
- ▼ -67.48%
- Current HPI
- 181.6606
- Rent YoY
- ▲ 4.26%
- Metro
- Gulfport-Biloxi, MS
- State GDP YoY
- —
- F500 in state
- 0
Price history
+279.7% since first listed4 events — show timeline
- 2026-05-13 Listed $90,000 MLSU
- 2013-01-03 Sold (Public Records) — Public Records
- 2012-12-12 Sold (MLS) — MLSU
- 2012-04-18 Listed $23,700 MLSU
Property tax history
+5.3%/yrLatest (2025): $750 · +4.4% YoY. Source: county tax records.
Cash-flow waterfall
monthlySold comps — $/sqft
last 12 mo · ≤1 miLoading sold comps…