370 W 12th St S #2 · Mountain Home, ID
Flood risk 1/10 · Minimal
- FEMA flood zone
- X
- Chance of flooding over 30 yrs
- 0.0%
- Est. flood insurance / yr
- $507 – $1,088
Fire risk 9/10 · Severe
- Est. fire insurance / yr
- $584 – $1,086
Heat risk 4/10 · Minor
- Hot days now (above 98°F)
- 6 days/yr
- Hot days in 30 yrs
- 15 days/yr
Wind risk 1/10 · Minimal
- Chance of severe wind over 30 yrs
- —
Air-quality risk 7/10 · Major
- Unhealthy air days now
- 11 days/yr
- Unhealthy air days in 30 yrs
- 13 days/yr
Risk factors via First Street. Map © Google.
Why this score? — see what drove the B- grade
The composite is a weighted blend of 9 inputs, each scored 0–100. Each bar is that input's sub-score; the figure is the points it added to the 100-point composite (weight × sub-score).
- Cash flow +27.1/30.0
- DSCR +9.4/10.0
- ARV discount +7.5/15.0
- 1% rule +7.3/10.0
- Rent growth +4.1/5.0
- Condition / age +4.0/5.0
- Livability +3.8/5.0
- Schools +3.1/10.0
- Appreciation +0.0/10.0
$160,000
🖨 Deal sheet (PDF) 📄 Offer letter ✓ Due diligence
Listing remarks
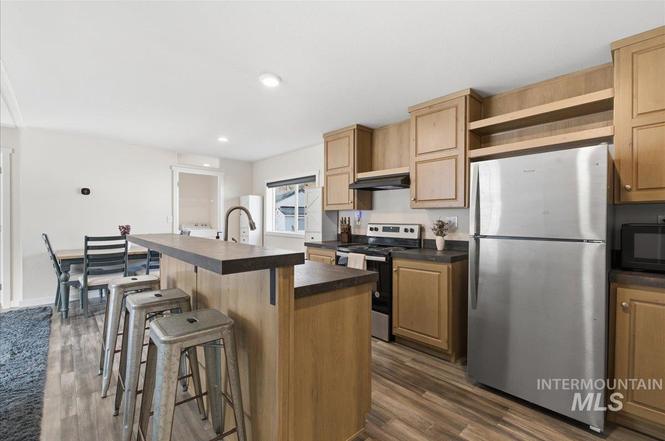
Welcome to Wild Horse Park, where comfort meets convenience in this 2025 manufactured home. This fully furnished doublewide offers 1,260 square feet of thoughtfully designed living space with 4 bedrooms and 2 full bathrooms, providing flexibility for family, guests, or a dedicated home office. The open concept layout creates a seamless flow between the living room and kitchen, making the space feel bright, functional, and perfect for everyday living or entertaining. The kitchen opens directly into the main living area, giving you a central gathering space that feels both spacious and welcoming. This home is a true turnkey opportunity. Whether you are looking for a primary residence, a low m
Key facts
- Open concept layout
- Built 2025
- Listed 67 days
Tags
Property features AI
Finance
- Other: Property is a mobile/manufactured home in a mobile home park
- HOA & community: Located in Wild Horse Park
Exterior
- Parking: Parking details not provided
- Utilities: City water service; Sewer connected; Broadband internet available; Electric water heater
- Home design: Mobile/manufactured home on a rented lot; All primary rooms on the main level; Built in 2025
- Construction: Frame construction; Composition roof; Built in 2025
- Exterior features: Composition roof; Storage shed; Located in a mobile home park (current use)
Interior
- Kitchen: Dishwasher; Disposal; Microwave; Freestanding oven/range; Refrigerator; Kitchen island; Breakfast bar; Laminate counters
- Bedrooms: 4 bedrooms, all on the main level
- Flooring: Laminate flooring (implied by laminate counters entry)
- Bathrooms: 2 bathrooms
- Heating & cooling: Electric forced-air heating; Central air conditioning
- Interior features: Split bedroom layout; Walk-in closet(s); Breakfast bar; Kitchen island; Laminate countertops
- Laundry & utility: Washer; Dryer; Main-level utility room; Electric water heater
Neighborhood map
What this means for you Summary
Snapshot
- This is a 4-bed/2.0-bath manufactured listed at $160k. Condition is rated good.
Deal economics
- At list price, monthly cash flow is $452 ($5k/yr) — positive.
- The deal already cash-flows at list — no discount required.
- Meets the 1% rule at list price ($2k rent vs $160k).
- Recommended offer: $150k (6.0% below list) — sets the bar for market timing.
- Cap rate 9.7% vs local median 3.0% in Mountain Home — top-decile yield for the area; either an underpriced asset or a hidden risk that comps aren't pricing in. Stress-test before assuming the spread holds.
Location & tenants
- Location reads 76/100 on livability (#26 in ID, #3,741 nationally) — a middle-class / working-renter tenant base. Strengths: cost of living A+, housing A+, health & safety A+; Watch: employment D, amenities F, commute F.
- Mountain Home District (town): math 28% / reading 44% proficiency, ranked #78 of 92 in ID (top 85%) — families likely to look elsewhere, expect single-tenant / working-renter base with shorter leases.
- Zoned schools: Mountain Home Sr High School (math 21% / reading 44%, grade F, #117 of 169 statewide, top 70%, 960 students, 33% FRL).
- Market conditions: Rents rising fast (+6.2%/yr); 355 active listings in the ZIP; 129 units permitted in Elmore County in 2024 (0 in 5+ unit buildings).
- This rent runs 37% of the median local income ($64k/yr) — at the standard rent-burdened threshold; future hikes will face affordability resistance.
Forward outlook
- Local home prices are declining (-3.0%/yr); year-one equity from $1k of loan paydown is wiped out by about $5k of value loss. Plan a longer hold.
- Elmore County population projected at -35% by 2050 — secular population decline; favor cash flow + early exit over multi-decade hold.
- At projected returns (-3.0% appreciation + 6.2% rent growth), your $45k cash investment doubles in ~8 years — after that, you're playing with house money.
Negotiation context
- It's been on market 68 days — a 6% lower offer ($150k) is reasonable based on typical stale-listing flexibility.
- 2 sale attempts; this cycle's ask has dropped $20k (11%) from the opening price — seller is motivated, your offer sets the floor, not the list.
Risks & watch-outs
- Climate carrying-cost: severe wildfire risk — expect insurance premiums to compound above CPI over the hold.
Questions for the listing agent
- It's been on market 68 days. Have you received any prior offers? Is the seller open to a 6% concession, seller financing, or rate buy-down credit?
- Why hasn't it sold? Are there any deal-killer items the seller is aware of (foundation, flood, title, zoning, code violations)?
- Is there a deadline driving the sale (1031 exchange, divorce, estate, relocation)? That informs how much negotiation room exists.
- What's the average days-on-market for RENTAL listings here right now (not sales)? A rising rental-DOM trend means longer vacancies and softer asking-rent achievability than the comps imply.
- What's the recent tenant-quality profile in this submarket — average credit score on applications, eviction rate, late-payment / NSF rate, and stable-employment percentage? A property-management company in the area should have these aggregated.
- How much new for-sale + rental construction is in the pipeline within 1–3 miles? Heavy new supply typically softens prices + rents 12–24 months out; constrained supply supports both.
Investment metrics
- 1% rule
- 1.23% ✓
- Cap rate
- 9.68%
- Cash-on-cash
- 12.09%
- DSCR
- 1.54
- GRM
- 6.8
CMA / ARV
- ARV (on-the-fly)
- $75,600
- Comps found
- 5
Show comp detail 5 sales within ~0.75 mi
| Address | Dist | Beds/Ba | Sqft | Sold | Price | $/sf | Match |
|---|---|---|---|---|---|---|---|
| 215 Colleen Dr | 0.27mi | 3/2.0 (-1) | 1,264 (+0%) | 0mo | $119,000 | $94 | 82 |
| 255 Dawn Dr | 0.21mi | 3/2.0 (-1) | 1,152 (-9%) | 13mo | $65,000 | $56 | 60 |
| 280 Dawn Dr | 0.20mi | 3/2.0 (-1) | 1,440 (+14%) | 9mo | $60,000 | $42 | 55 |
| 255 SW Colleen Dr | 0.23mi | 3/2.0 (-1) | 1,080 (-14%) | 11mo | $65,000 | $60 | 51 |
| 1360 S 10th | 0.61mi | 3/2.0 (-1) | 1,249 (-1%) | 21mo | $324,000 | $259 | 48 |
Match score weights: distance 35% · size 25% · config 20% · recency 20%. Top-matched comps best support the ARV.
Projected returns pro-forma
-3.0% appreciation · 6.23% rent growth · sell at horizon
- IRR
- 5.3%
- Equity multiple
- 1.21×
- Total profit
- $9,472
- Equity at exit
- $23,857
- IRR
- 17.5%
- Equity multiple
- 2.66×
- Total profit
- $74,399
- Equity at exit
- $13,834
Cash invested: $44,800 (down + closing). Projections, not guarantees.
Landlord ↔ Tenant lean methodology
- Overall (STATE)
- 91 Strongly Landlord-Friendly
- State Idaho
- 91 Strongly Landlord-Friendly · R+18
- County
- — inherits STATE
- City
- — inherits STATE
ZIP-level market 83647
- Home prices YoY
- -31.4%
- Rents YoY
- 6.2%
- Active inventory
- 355
- Price-to-rent
- 6.8×
Monthly cashflow live
- Estimated rent
- $1,971 medium interval (Pro) →
- Mortgage (P&I)
- −$839
- Tax est. 1.5%
- −$200 /mo · $2,400/yr
- Insurance
- −$67
- HOA
- −$0
- Vacancy / Maint / Mgmt
- −$414
- Net cashflow
- $452
Break-even live
Sensitivity live
| Price | -10% $562 | -5% $507 | +0% $452 | +5% $396 | +10% $341 |
|---|---|---|---|---|---|
| Rent | -10% $296 | -5% $374 | +0% $452 | +5% $529 | +10% $607 |
| Rate | -1.0pp $532 | -0.5pp $492 | base $452 | +0.5pp $410 | +1.0pp $368 |
UW: 25.0% down · 7.5% · 30yr · 1.5% tax · 5.0% vac · 8.0% maint · 8.0% mgmt
Financing live
Cash to close
- Down payment
- $40,000
- Closing costs
- $4,800
- Reserves months
- —
- Total cash needed
- —
Loan-product check · same deal, 3 products live
Conventional
25% down · 7.5% · 30yr
- Down + closing
- —
- Monthly P&I
- —
- Monthly cashflow
- —
- DSCR
- —
- Eligible?
- —
Personal DTI + credit; lowest rate.
DSCR
20% down · 8.5% · 30yr
- Down + closing
- —
- Monthly P&I
- —
- Monthly cashflow
- —
- DSCR
- —
- Eligible?
- —
No personal income docs; deal must DSCR.
Hard money
10% down · 12.0% · 12mo
- Down + closing
- —
- Monthly P&I
- —
- Monthly cashflow
- —
- DSCR
- —
- Eligible?
- —
Short-term bridge; refi at stabilization.
Listing history 21 events
-
2026-06-21days on market $160,000 Active 68 DOM
-
2026-06-19days on market $160,000 Active 66 DOM
-
2026-06-18days on market $160,000 Active 65 DOM
-
2026-06-17days on market $160,000 Active 64 DOM
-
2026-06-16days on market $160,000 Active 63 DOM
-
2026-06-15days on market $160,000 Active 62 DOM
-
2026-06-14days on market $160,000 Active 60 DOM
-
2026-06-12days on market $160,000 Active 59 DOM
-
2026-06-09days on market $160,000 Active 56 DOM
-
2026-06-08days on market $160,000 Active 55 DOM
-
2026-06-07days on market $160,000 Active 54 DOM
-
2026-06-07days on market $160,000 Active 53 DOM
-
2026-06-04days on market $160,000 Active 50 DOM
-
2026-06-02days on market $160,000 Active 49 DOM
-
2026-06-01days on market $160,000 Active 48 DOM
-
2026-05-31days on market $160,000 Active 47 DOM
-
2026-05-31days on market $160,000 Active 46 DOM
-
2026-04-21status Active
-
2026-04-21price $160,000
-
2026-03-11status Pending
-
2026-03-03$180,000 Active
ⓘ Source: listings_history table (triggers on properties + properties_extension) + one-shot
backfill from property_details.listing_events for pre-trigger history.
Climate risk First Street
- Flood 1/10 Low FEMA zone X · 0% chance over 30 yrs
- Wildfire 9/10 Extreme
- Heat 4/10 Moderate 6 d/yr ≥98°F today · 15 d/yr by 30 yrs out
- Wind 1/10 Low
- Air quality 7/10 Severe 11 unhealthy d/yr today · 13 by 30 yrs out
Nearby sold comps map
Loading sold comps map…
Walkable amenities ~0.75 mi
Loading nearby amenities…
Taxation est. · year 1
- Rental income
- $23,654
- − Mortgage interest
- −$8,962
- − Property taxes
- −$2,400
- − Insurance
- −$800
- − Repairs & maintenance
- −$1,892
- − Management
- −$1,892
- − Depreciation
- −$4,655
- Taxable income
- $3,052
- Est. tax owed @ 24.0%
- −$733
- After-tax cash flow
- $4,685/yr
For passive investors: Depreciation is non-cash, so a rental often shows a tax loss while cash-flowing — sheltering income. Rental losses are passive: they offset passive income freely, and up to $25,000/yr can offset ordinary (W-2) income if you actively participate and your MAGI is under $100k (phasing out to $0 by $150k); unused losses carry forward. On sale, claimed depreciation is recaptured at up to 25%, and gains may owe capital-gains tax (a 1031 exchange can defer both). Figures are a year-1 estimate at your 24.0% rate — not tax advice; consult a CPA.
Condition & rehab AI · 13 photos
This 2025 manufactured home is in good condition with a modern kitchen and well-maintained bathrooms. It offers a good investment opportunity with potential for modest improvements to boost its value.
Value-add opportunities
- Resale Painting the exterior siding — Fresh paint can enhance curb appeal and property value.
- Rental Landscaping the front yard — A well-maintained front yard can attract tenants and improve rental value.
- Resale Upgrading the kitchen appliances — Modern appliances can attract more buyers and increase the home's value.
- Both Adding a small garden or patio area — This can enhance both the resale and rental value by providing outdoor living space.
Renovation cost estimate screening
Value-add ROI direction
- Resale Painting the exterior siding — Fresh paint can enhance curb appeal and property value. ↑
- Rental Landscaping the front yard — A well-maintained front yard can attract tenants and improve rental value. ↑
- Resale Upgrading the kitchen appliances — Modern appliances can attract more buyers and increase the home's value. ↑
- Both Adding a small garden or patio area — This can enhance both the resale and rental value by providing outdoor living space. ↑
ⓘ Cost ranges are severity-bucket heuristics (US national rule-of-thumb). Get contractor quotes + a written scope before underwriting a rehab budget.
Schools (NCES district)
- District
- Mountain Home District
- NCES district ID
- 1602250
- Math proficiency
- 28% ▼ -5.00%
- Reading proficiency
- 44% ▲ 1.00%
- Median HH income
- $44,262
- Composite
- 30.57/100
- National rank
- #6203
- State rank
- #78 of 92 in ID
Livability — Mountain Home
- Score
- 76/100
- State rank
- #26
- US rank
- #3741
Category grades
Schools grade is shown separately in the Schools card above.
Census & demographics
- County
- Elmore County · 22,952 people
- City population
- 22,952
- Metro
- Mountain Home, ID
- Population (ZIP)
- 22,952
- Household income
- $63,760
- Rent vs Own
- Severe rent burden
- 317.0
Population outlook (Elmore County) Hauer SSP2
- Today (2025)
- 22,644 people
- By 2030
- 21,112 · -6.8%
- By 2040
- 17,768 · -21.5%
- By 2050
- 14,629 · -35.4%
- By 2075
- 9,144 · -59.6%
- By 2100
- 6,006 · -73.5%
Race, ethnicity, and origin ACS 2023
- Neighborhood character
- Predominantly White (72%)
- Race & ethnicity
- White 72% Hispanic / Latino 18% Two or more races 13% Asian 3% Black 2% Native American 1%
- Hispanic origin (detail)
- Mexican 15%
- Common ancestry
- Portuguese 4% Lithuanian 3% Scotch-Irish 3%
- Foreign-born
- 10% · Canada
- Languages at home
- 85% English-only · Spanish 10% Russian/Polish/Slavic 2% Chinese 1%
Political lean MEDSL · Elmore
- 2024 margin
- Solid R (+48.5) · D 24.5% · R 73.0% · Other 2.5%
- 2008→2024 swing
- -12.1pp toward R · 2008: -36.4pp · 2024: -48.5pp
- All cycles
- 2024: R+48.5 2020: R+45.5 2016: R+47.0 2012: R+33.9 2008: R+36.4
Not yet ingested
- Civics
- —
Market trends
- HPI YoY
- ▼ -108.42%
- Current HPI
- 236.3087
- Rent YoY
- ▲ 6.23%
- Metro
- Mountain Home, ID
- State GDP YoY
- ▲ 4.51%
- F500 in state
- 6
Industry mix (Fortune 500 HQ in ID)
| Industry | F500 HQs | Revenue |
|---|---|---|
| Retail | 1 | $79B |
|
||
| Technology | 1 | $25B |
|
||
| Food / Agriculture | 1 | $6B |
|
||
Price history
-11.1% since first listed4 events — show timeline
- 2026-04-21 Relisted — IMLS
- 2026-04-21 Price Changed $160,000 IMLS
- 2026-03-11 Pending — IMLS
- 2026-03-03 Listed $180,000 IMLS
Cash-flow waterfall
monthlySold comps — $/sqft
last 12 mo · ≤1 miLoading sold comps…