 5-Plex
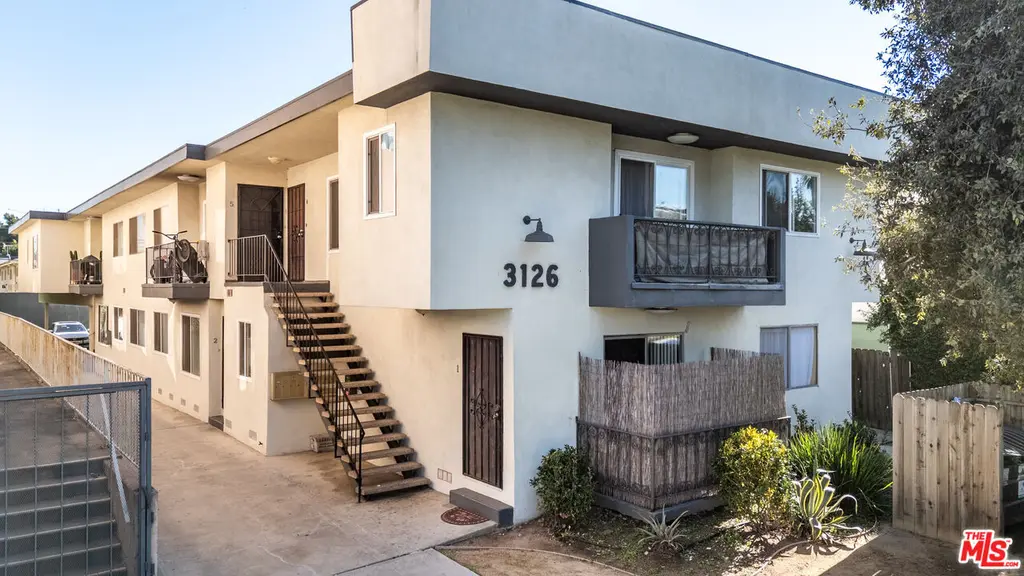
3126 S Canfield Ave · Los Angeles, CA
Flood risk 1/10 · Minimal
- FEMA flood zone
- X (unshaded)
- Chance of flooding over 30 yrs
- 0.0%
- Est. flood insurance / yr
- $507 – $1,088
Fire risk 1/10 · Minimal
- Est. fire insurance / yr
- $659 – $1,223
Heat risk 6/10 · Moderate
- Hot days now (above 86°F)
- 7 days/yr
- Hot days in 30 yrs
- 21 days/yr
Wind risk 1/10 · Minimal
- Chance of severe wind over 30 yrs
- —
Air-quality risk 4/10 · Minor
- Unhealthy air days now
- 6 days/yr
- Unhealthy air days in 30 yrs
- 7 days/yr
Risk factors via First Street. Map © Google.
Why this score? — see what drove the D grade
The composite is a weighted blend of 9 inputs, each scored 0–100. Each bar is that input's sub-score; the figure is the points it added to the 100-point composite (weight × sub-score).
- ARV discount +12.0/15.0
- Cash flow +11.3/30.0
- Schools +3.6/10.0
- Livability +3.4/5.0
- DSCR +3.3/10.0
- 1% rule +3.2/10.0
- Rent growth +2.6/5.0
- Condition / age +2.5/5.0
- Appreciation +0.0/10.0
$2,550,000
🖨 Deal sheet 📄 Offer letter ✓ Due diligence
Multi-family units
County records classify this as Multi-Family (5+ Unit). Listing-text estimate: 5 units. confirmed
5+ unit building — per-unit beds/baths from public records are typically unavailable; the breakdown below (if shown) is an estimate from the listing text.
Listing remarks MLS
3126 S. Canfield Avenue presents a substantial multifamily investment opportunity located in the upscale Castle Heights pocket of Palms. This impressive eight-unit complex, constructed in 1967, spans approximately 7,321 square feet of living area on an oversized 8,005-square-foot lot. The property features an exceptionally strong unit mix, including several expansive three-bedroom and two-bedroom floor plans that cater to the high-earning professional demographic and families drawn to the prestigious Hamilton High School. The location offers a unique "secluded but central" appeal, situated on a picturesque, tree-lined street that bridges the gap between the high-rise office towers of Century City and the vibrant energy of Downtown Culver City. Residents enjoy unparalleled access to the "Screenland" lifestyle, located just minutes from the world-class dining and entertainment scene at The Culver Steps, Ivy Station, and the historic Culver Hotel. The property's proximity to both the Palms and Culver City Metro E Line stations provides effortless access to the massive creative-tech campuses of Amazon MGM, Apple, and Warner Bros. Discovery, while also offering a quick commute to the beaches of Santa Monica or the cultural center of Beverly Hills. Lifestyle amenities in the area further enhance the property's desirability, with immediate access to local favorites like the Motor Avenue Farmers Market and the lush recreational green spaces of the Kenneth Hahn State Recreation Area. The surrounding landscape is characterized by Culver City's sophisticated mix of international dining, boutique fitness studios, and essential grocers like Trader Joe's and Whole Foods. For the strategic investor, 3126 S. Canfield Ave. offers a rare combination of significant scale, a prime location at the doorstep of the region's most explosive tech growth, and clear value-add potential through modern aesthetic upgrades, making it a future-proof addition to any sophisticated real estate portfolio.
Key facts
- Eight unit complex
- Strong unit mix
- Tree lined street
Tags
Neighborhood map
What this means for you Summary
Snapshot
- This is a 5 × 2-bed/?-bath units multifamily listed at $2.55M.
Deal economics
- At list price, monthly cash flow is $-922 ($-11k/yr) — negative. Per door: $-184/mo.
- To cash-flow at today's rent, offer at most $2.39M (6.4% below list).
- To meet the 1% rule (rent ≥ 1% of price), the offer needs to be $2.08M (18.5% below list).
- Recommended offer: $2.08M (18.5% below list) — sets the bar for 1% rule.
- Cap rate 5.9% vs local median 2.1% in Los Angeles — top-decile yield for the area; either an underpriced asset or a hidden risk that comps aren't pricing in. Stress-test before assuming the spread holds.
Location & tenants
- Location reads 68/100 on livability (#273 in CA) — a middle-class / working-renter tenant base. Strengths: amenities A+, commute A+, employment B; Watch: health & safety C-, schools D+, crime F.
- Los Angeles Unified (urban): math 29% / reading 54% proficiency, ranked #223 of 517 in CA (top 43%) — families likely to look elsewhere, expect single-tenant / working-renter base with shorter leases; 67% free/reduced lunch — lower-income household profile, screen leases tightly.
- Market conditions: Rents flat; 121 active listings in the ZIP; solid renter incomes; 19,697 units permitted in Los Angeles County in 2024 (9,426 in 5+ unit buildings).
- At $20,795/mo this rent would consume 236% of the median local household income ($106k/yr) (locally 4507% of renters already pay >50% of income on rent) — very limited rent-growth headroom before tenants either downsize or default.
Forward outlook
- Local home prices are declining (-3.0%/yr); year-one equity from $18k of loan paydown is wiped out by about $76k of value loss. Plan a longer hold.
- Los Angeles County population projected at +9% by 2050 — modest demand growth; plan on rents tracking national, not racing it.
Negotiation context
- It's been on market 133 days — a 12% lower offer ($2.24M) is reasonable based on typical stale-listing flexibility.
- 14 sale attempts since 29y ago with the ask held roughly flat each time — persistent listings suggest the price (not the market) is what's stuck; bring a comps-based counter.
Risks & watch-outs
- Climate carrying-cost: extreme-heat days projected 7→21/yr by 2055 (HVAC capex compounding) — expect insurance premiums to compound above CPI over the hold.
Questions for the listing agent
- What do current leases actually rent for vs. the listed asking? Can we see a recent rent roll and the last 12 months of T-12 income?
- It's been on market 133 days. Have you received any prior offers? Is the seller open to a 18% concession, seller financing, or rate buy-down credit?
- Can we see the unit-by-unit rent roll, current vacancy, and any below-market leases? What's the average tenancy length?
- What capital expenditures (roof, boiler, parking lot, exteriors) have been made in the last 5 years, and what's planned in the next 2?
- Built in 1967 — when were the roof, HVAC, electrical panel, plumbing, and water heater last replaced?
- Why hasn't it sold? Are there any deal-killer items the seller is aware of (foundation, flood, title, zoning, code violations)?
- Is there a deadline driving the sale (1031 exchange, divorce, estate, relocation)? That informs how much negotiation room exists.
- Schools are D-rated, which usually means shorter tenancies and higher turnover. Who's the typical renter profile here, and what's been the actual vacancy rate?
- Crime grade is F in this area — have there been break-ins, vandalism, or insurance claims at this property in the last 3 years? What carrier currently insures it and at what premium?
- The area grade is low — what's the realistic commute time and amenity access for the typical tenant pool here? Any planned neighborhood developments (good or bad) we should know about?
- What's the average days-on-market for RENTAL listings here right now (not sales)? A rising rental-DOM trend means longer vacancies and softer asking-rent achievability than the comps imply.
- What's the recent tenant-quality profile in this submarket — average credit score on applications, eviction rate, late-payment / NSF rate, and stable-employment percentage? A property-management company in the area should have these aggregated.
- How much new apartment / multifamily construction is in the pipeline within 1–3 miles? Heavy new supply (>2% of stock underway) typically softens rents 12–24 months out; light construction supports rent growth.
Investment metrics
- 1% rule
- 0.82% ✗
- Cap rate
- 5.86%
- Cash-on-cash
- -1.55%
- DSCR
- 0.93
- GRM
- 10.2
CMA / ARV
- ARV (median comp)
- $2,832,413
- List price
- $2,550,000
- Delta
- -9.97%
- Verdict
- FAIR
- Comps
- 20 within 1.0 mi
Show comp detail 2 sales within ~0.75 mi
| Address | Dist | Beds/Ba | Sqft | Sold | Price | $/sf | Match |
|---|---|---|---|---|---|---|---|
| 9117 National Blvd | 0.08mi | 12/12.0 (+1) | 6,734 (-8%) | 20mo | $2,478,400 | $368 | 57 |
| 3337 S Durango Ave | 0.14mi | 12/10.0 (+1) | 6,647 (-9%) | 9mo | $2,500,000 | $376 | 54 |
Match score weights: distance 35% · size 25% · config 20% · recency 20%. Top-matched comps best support the ARV.
Projected returns pro-forma
-3.0% appreciation · 0.3% rent growth · sell at horizon
- IRR
- -21.9%
- Equity multiple
- 0.26×
- Total profit
- $-526,797
- Equity at exit
- $380,213
- IRR
- -23.9%
- Equity multiple
- -0.05×
- Total profit
- $-747,602
- Equity at exit
- $220,477
Cash invested: $714,000 (down + closing). Projections, not guarantees.
Landlord ↔ Tenant lean methodology
- Overall (CITY)
- 0 Strongly Tenant-Friendly
- State California
- 18 Strongly Tenant-Friendly · D+13
- County
- — inherits STATE
- City Los Angeles
- 0 Strongly Tenant-Friendly · D+22
ZIP-level market 90034
- Rents YoY
- 0.3%
- Active inventory
- 121
- Price-to-rent
- 51.1×
Monthly cashflow live
- Estimated rent
- $20,795 high interval (Pro) →
- Mortgage (P&I)
- −$13,372
- Tax from tax record
- −$2,915 /mo · $34,981/yr
- Insurance
- −$1,062
- HOA
- −$0
- Vacancy / Maint / Mgmt
- −$4,367
- Net cashflow
- $-922
Break-even live
5-unit breakdown (identical units grouped — click to expand)
| Units | Beds | Baths | Est. rent |
|---|---|---|---|
| 5× units | 2 | — | $20,795 |
| #1 | 2 | — | $4,159 |
| #2 | 2 | — | $4,159 |
| #3 | 2 | — | $4,159 |
| #4 | 2 | — | $4,159 |
| #5 | 2 | — | $4,159 |
| Total (5 units) | $20,795 | ||
UW: 25.0% down · 7.5% · 30yr · 1.5% tax · 5.0% vac · 8.0% maint · 8.0% mgmt
Financing live
Cash to close
- Down payment
- $637,500
- Closing costs
- $76,500
- Reserves months
- —
- Total cash needed
- —
Loan-product check · same deal, 3 products live
Conventional
25% down · 7.5% · 30yr
- Down + closing
- —
- Monthly P&I
- —
- Monthly cashflow
- —
- DSCR
- —
- Eligible?
- —
Personal DTI + credit; lowest rate.
DSCR
20% down · 8.5% · 30yr
- Down + closing
- —
- Monthly P&I
- —
- Monthly cashflow
- —
- DSCR
- —
- Eligible?
- —
No personal income docs; deal must DSCR.
Hard money
10% down · 12.0% · 12mo
- Down + closing
- —
- Monthly P&I
- —
- Monthly cashflow
- —
- DSCR
- —
- Eligible?
- —
Short-term bridge; refi at stabilization.
Listing history 50 events
-
2026-06-18days on market $2,550,000 Active 133 DOM
-
2026-06-17days on market $2,550,000 Active 132 DOM
-
2026-06-16days on market $2,550,000 Active 131 DOM
-
2026-06-15days on market $2,550,000 Active 130 DOM
-
2026-06-13days on market $2,550,000 Active 128 DOM
-
2026-06-09days on market $2,550,000 Active 124 DOM
-
2026-06-08days on market $2,550,000 Active 123 DOM
-
2026-06-07days on market $2,550,000 Active 122 DOM
-
2026-06-04days on market $2,550,000 Active 119 DOM
-
2026-06-03days on market $2,550,000 Active 118 DOM
-
2026-06-02days on market $2,550,000 Active 117 DOM
-
2026-06-01days on market $2,550,000 Active 116 DOM
-
2026-05-31days on market $2,550,000 Active 115 DOM
-
2026-03-11status Active 2023-char remark
Show marketing remark (2023 chars)
3126 S. Canfield Avenue presents a substantial multifamily investment opportunity located in the upscale Castle Heights pocket of Palms. This impressive eight-unit complex, constructed in 1967, spans approximately 7,321 square feet of living area on an oversized 8,005-square-foot lot. The property features an exceptionally strong unit mix, including several expansive three-bedroom and two-bedroom floor plans that cater to the high-earning professional demographic and families drawn to the prestigious Hamilton High School. The location offers a unique "secluded but central" appeal, situated on a picturesque, tree-lined street that bridges the gap between the high-rise office towers of Century City and the vibrant energy of Downtown Culver City. Residents enjoy unparalleled access to the "Screenland" lifestyle, located just minutes from the world-class dining and entertainment scene at The Culver Steps, Ivy Station, and the historic Culver Hotel. The property's proximity to both the Palms and Culver City Metro E Line stations provides effortless access to the massive creative-tech campuses of Amazon MGM, Apple, and Warner Bros. Discovery, while also offering a quick commute to the beaches of Santa Monica or the cultural center of Beverly Hills. Lifestyle amenities in the area further enhance the property's desirability, with immediate access to local favorites like the Motor Avenue Farmers Market and the lush recreational green spaces of the Kenneth Hahn State Recreation Area. The surrounding landscape is characterized by Culver City's sophisticated mix of international dining, boutique fitness studios, and essential grocers like Trader Joe's and Whole Foods. For the strategic investor, 3126 S. Canfield Ave. offers a rare combination of significant scale, a prime location at the doorstep of the region's most explosive tech growth, and clear value-add potential through modern aesthetic upgrades, making it a future-proof addition to any sophisticated real estate portfolio.
-
2026-02-27historical Backup Offers Accepted 2023-char remark
Show marketing remark (2023 chars)
3126 S. Canfield Avenue presents a substantial multifamily investment opportunity located in the upscale Castle Heights pocket of Palms. This impressive eight-unit complex, constructed in 1967, spans approximately 7,321 square feet of living area on an oversized 8,005-square-foot lot. The property features an exceptionally strong unit mix, including several expansive three-bedroom and two-bedroom floor plans that cater to the high-earning professional demographic and families drawn to the prestigious Hamilton High School. The location offers a unique "secluded but central" appeal, situated on a picturesque, tree-lined street that bridges the gap between the high-rise office towers of Century City and the vibrant energy of Downtown Culver City. Residents enjoy unparalleled access to the "Screenland" lifestyle, located just minutes from the world-class dining and entertainment scene at The Culver Steps, Ivy Station, and the historic Culver Hotel. The property's proximity to both the Palms and Culver City Metro E Line stations provides effortless access to the massive creative-tech campuses of Amazon MGM, Apple, and Warner Bros. Discovery, while also offering a quick commute to the beaches of Santa Monica or the cultural center of Beverly Hills. Lifestyle amenities in the area further enhance the property's desirability, with immediate access to local favorites like the Motor Avenue Farmers Market and the lush recreational green spaces of the Kenneth Hahn State Recreation Area. The surrounding landscape is characterized by Culver City's sophisticated mix of international dining, boutique fitness studios, and essential grocers like Trader Joe's and Whole Foods. For the strategic investor, 3126 S. Canfield Ave. offers a rare combination of significant scale, a prime location at the doorstep of the region's most explosive tech growth, and clear value-add potential through modern aesthetic upgrades, making it a future-proof addition to any sophisticated real estate portfolio.
-
2026-02-04$2,550,000 Active 2023-char remark
Show marketing remark (2023 chars)
3126 S. Canfield Avenue presents a substantial multifamily investment opportunity located in the upscale Castle Heights pocket of Palms. This impressive eight-unit complex, constructed in 1967, spans approximately 7,321 square feet of living area on an oversized 8,005-square-foot lot. The property features an exceptionally strong unit mix, including several expansive three-bedroom and two-bedroom floor plans that cater to the high-earning professional demographic and families drawn to the prestigious Hamilton High School. The location offers a unique "secluded but central" appeal, situated on a picturesque, tree-lined street that bridges the gap between the high-rise office towers of Century City and the vibrant energy of Downtown Culver City. Residents enjoy unparalleled access to the "Screenland" lifestyle, located just minutes from the world-class dining and entertainment scene at The Culver Steps, Ivy Station, and the historic Culver Hotel. The property's proximity to both the Palms and Culver City Metro E Line stations provides effortless access to the massive creative-tech campuses of Amazon MGM, Apple, and Warner Bros. Discovery, while also offering a quick commute to the beaches of Santa Monica or the cultural center of Beverly Hills. Lifestyle amenities in the area further enhance the property's desirability, with immediate access to local favorites like the Motor Avenue Farmers Market and the lush recreational green spaces of the Kenneth Hahn State Recreation Area. The surrounding landscape is characterized by Culver City's sophisticated mix of international dining, boutique fitness studios, and essential grocers like Trader Joe's and Whole Foods. For the strategic investor, 3126 S. Canfield Ave. offers a rare combination of significant scale, a prime location at the doorstep of the region's most explosive tech growth, and clear value-add potential through modern aesthetic upgrades, making it a future-proof addition to any sophisticated real estate portfolio.
-
2025-02-12historical $2,100
-
2025-02-03$2,100
-
2024-02-12price
-
2023-06-07Active
-
2018-07-27historical Expired
-
2018-07-27historical
-
2018-05-28Active
-
2018-05-28$3,000,000
-
2016-08-15historical Cancelled
-
2016-08-15historical
-
2016-05-17Active
-
2016-05-16$2,760,000
-
2016-01-29soldstatus $2,385,000 Closed
-
2016-01-29soldstatus $2,385,000
-
2016-01-29soldstatus $2,385,000
-
2015-11-18status Pending
-
2015-09-28$2,550,000 Active
-
2015-09-28$2,550,000
-
2013-07-18soldstatus $841,000
-
2013-07-05soldstatus $1,825,000 Closed
-
2013-07-05soldstatus $1,826,000
-
2013-05-02status Pending
-
2013-04-18$1,795,000 Active
-
2012-02-02soldstatus $1,345,000 Closed
-
2012-02-02soldstatus $1,345,000
-
2012-01-25status Pending
-
2011-12-21status Backup Offers Accepted
-
2011-08-09price $1,449,000
-
2011-07-26$1,590,000 Active
-
1998-04-08soldstatus $482,500
-
1998-04-08soldstatus $482,500
-
1998-02-04historical
-
1997-12-08$495,000
-
1997-11-30historical
ⓘ Source: listings_history table (triggers on properties + properties_extension) + one-shot
backfill from property_details.listing_events for pre-trigger history.
Tax reassessment forecast CA · Resets to sale price
- Current annual tax
- $34,981 · $2,915/mo
- Projected year-2 tax
- $34,981 · $2,915/mo
- Expected delta
- $0/yr ($0/mo · 0.0%)
ⓘ Screening estimate from a state-policy table — verify with the county assessor before closing.
Climate risk First Street
- Flood 1/10 Low FEMA zone X (unshaded) · 0% chance over 30 yrs
- Wildfire 1/10 Low
- Heat 6/10 Major 7 d/yr ≥86°F today · 21 d/yr by 30 yrs out
- Wind 1/10 Low
- Air quality 4/10 Moderate 6 unhealthy d/yr today · 7 by 30 yrs out
Nearby sold comps map
Loading sold comps map…
Walkable amenities ~0.75 mi
Loading nearby amenities…
Taxation est. · year 1
- Rental income
- $249,540
- − Mortgage interest
- −$142,840
- − Property taxes
- −$34,981
- − Insurance
- −$12,750
- − Repairs & maintenance
- −$19,963
- − Management
- −$19,963
- − Depreciation
- −$74,182
- Taxable loss
- −$55,139
- Est. tax savings @ 24.0%
- +$13,233
- After-tax cash flow
- $2,169/yr
For passive investors: Depreciation is non-cash, so a rental often shows a tax loss while cash-flowing — sheltering income. Rental losses are passive: they offset passive income freely, and up to $25,000/yr can offset ordinary (W-2) income if you actively participate and your MAGI is under $100k (phasing out to $0 by $150k); unused losses carry forward. On sale, claimed depreciation is recaptured at up to 25%, and gains may owe capital-gains tax (a 1031 exchange can defer both). Figures are a year-1 estimate at your 24.0% rate — not tax advice; consult a CPA.
Schools (NCES district)
- District
- Los Angeles Unified
- NCES district ID
- 0622710
- Math proficiency
- 29% ▼ -4.00%
- Reading proficiency
- 54% ▲ 10.00%
- Median HH income
- $50,403
- Composite
- 35.67/100
- National rank
- #4875
- State rank
- #223 of 517 in CA
Livability — Los Angeles
- Score
- 68/100
- State rank
- #273
- US rank
- #9237
Category grades
Schools grade is shown separately in the Schools card above.
Census & demographics
- Census place
- Los Angeles, CA
- County
- Los Angeles County · 9,444,647 people
- City population
- 3,838,149
- Metro
- Los Angeles-Long Beach-Anaheim, CA
- Population (ZIP)
- 57,075
- Household income
- $105,701
- Rent vs Own
- Severe rent burden
- 4507.0
Population outlook (Los Angeles County) Hauer SSP2
- Today (2025)
- 10,940,515 people
- By 2030
- 11,256,481 · +2.9%
- By 2040
- 11,729,929 · +7.2%
- By 2050
- 11,948,407 · +9.2%
- By 2075
- 11,818,114 · +8.0%
- By 2100
- 10,842,928 · -0.9%
Race, ethnicity, and origin ACS 2023
- Neighborhood character
- Highly diverse neighborhood (Simpson 0.73)
- Race & ethnicity
- White 41% Hispanic / Latino 26% Asian 18% Two or more races 13% Black 9%
- Hispanic origin (detail)
- Mexican 16%
- Common ancestry
- Scotch-Irish 3% Romanian 3% Italian 2%
- Foreign-born
- 30% · Canada, China, South Korea
- Languages at home
- 58% English-only · Spanish 21% Other Indo-European 6% Chinese 4%
Political lean MEDSL · Los Angeles
- 2024 margin
- Solid D (+32.9) · D 64.8% · R 31.9% · Other 3.3%
- 2008→2024 swing
- -7.4pp toward R · 2008: 40.4pp · 2024: 32.9pp
- All cycles
- 2024: D+32.9 2020: D+44.2 2016: D+48.0 2012: D+40.0 2008: D+40.4
Not yet ingested
- Civics
- —
Market trends
- HPI YoY
- ▼ -1346.08%
- Current HPI
- 445.7709
- Rent YoY
- ▲ 0.30%
- Metro
- Los Angeles-Long Beach-Anaheim, CA
- State GDP YoY
- ▲ 3.21%
- F500 in state
- 116
Industry mix (Fortune 500 HQ in CA)
| Industry | F500 HQs | Revenue |
|---|---|---|
| Technology | 27 | $1,492B |
|
||
| Financial Services | 3 | $174B |
|
||
| Retail | 3 | $44B |
|
||
| Insurance | 3 | $26B |
|
||
| Media / Entertainment | 2 | $115B |
|
||
| Pharmaceuticals / Biotech | 2 | $62B |
|
||
Price history
+390.4% since first listed42 events — show timeline
- 2026-03-11 Relisted — TheMLS
- 2026-02-27 Contingent — TheMLS
- 2026-02-04 Listed $2,550,000 TheMLS
- 2025-02-12 Rental Removed $2,100 Avail
- 2025-02-03 Listed for Rent $2,100 Avail
- 2024-02-12 Price Changed — TheMLS
- 2023-06-07 Listed — TheMLS
- 2018-07-27 Listing Removed — SDMLS
- 2018-07-27 Delisted — TheMLS
- 2018-05-28 Listed $3,000,000 SDMLS
- 2018-05-28 Listed — TheMLS
- 2016-08-15 Listing Removed — SDMLS
- 2016-08-15 Delisted — TheMLS
- 2016-05-17 Listed — TheMLS
- 2016-05-16 Listed $2,760,000 SDMLS
- 2016-01-29 Sold (Public Records) $2,385,000 Public Records
- 2016-01-29 Sold (MLS) $2,385,000 SDMLS
- 2016-01-29 Sold (MLS) $2,385,000 TheMLS
- 2015-11-18 Pending — TheMLS
- 2015-09-28 Listed $2,550,000 TheMLS
- 2015-09-28 Listed $2,550,000 SDMLS
- 2013-07-18 Sold (Public Records) $841,000 Public Records
- 2013-07-05 Sold (Public Records) $1,826,000 Public Records
- 2013-07-05 Sold (MLS) $1,825,000 TheMLS
- 2013-05-02 Pending — TheMLS
- 2013-04-18 Listed $1,795,000 TheMLS
- 2012-02-02 Sold (Public Records) $1,345,000 Public Records
- 2012-02-02 Sold (MLS) $1,345,000 CRMLS
- 2012-01-25 Pending — CRMLS
- 2011-12-21 Pending — CRMLS
- 2011-08-09 Price Changed $1,449,000 CRMLS
- 2011-07-26 Listed $1,590,000 CRMLS
- 1998-04-08 Sold (Public Records) $482,500 Public Records
- 1998-04-08 Sold (MLS) $482,500 TheMLS
- 1998-02-04 Delisted — TheMLS
- 1997-12-08 Listed $495,000 TheMLS
- 1997-11-30 Delisted — TheMLS
- 1997-08-01 Listed — TheMLS
- 1995-06-02 Sold (Public Records) $400,000 Public Records
- 1988-10-14 Sold (Public Records) $618,000 Public Records
- 1987-12-07 Sold (Public Records) $520,000 Public Records
- 1987-12-07 Sold (Public Records) $520,000 Public Records
Property tax history
+7.7%/yrLatest (2025): $34,981 · +1.2% YoY. Source: county tax records.
Cash-flow waterfall
monthlySold comps — $/sqft
last 12 mo · ≤1 miLoading sold comps…