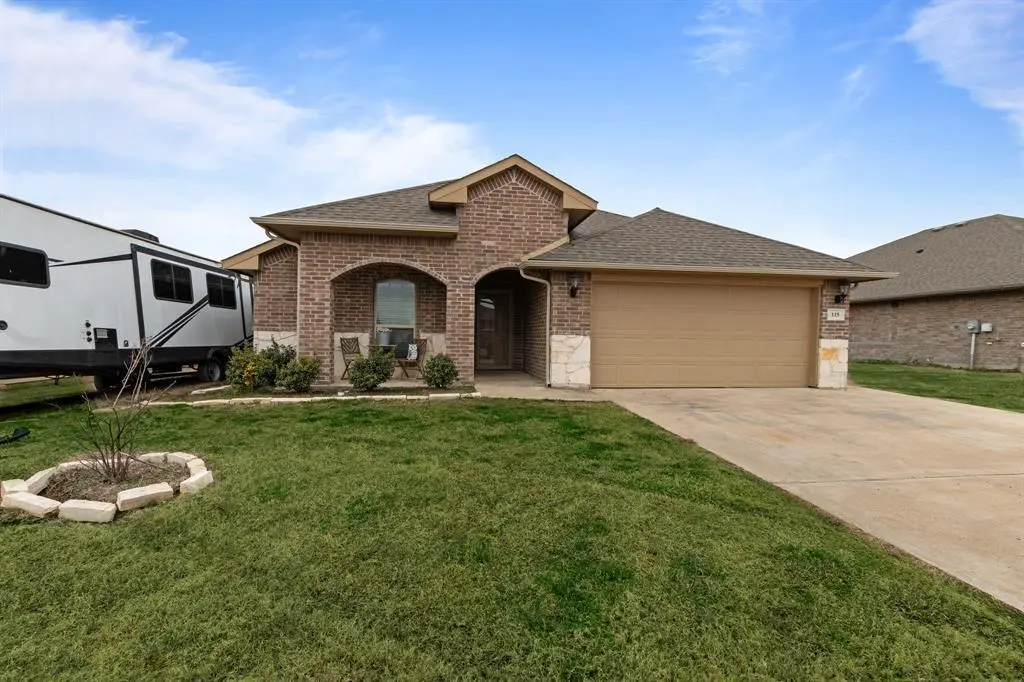
115 Oak Springs Loop · Mabank, TX
Flood risk 1/10 · Minimal
- FEMA flood zone
- X (unshaded)
- Chance of flooding over 30 yrs
- 0.0%
- Est. flood insurance / yr
- $507 – $1,088
Fire risk 3/10 · Minor
- Est. fire insurance / yr
- $1,222 – $2,270
Heat risk 7/10 · Major
- Hot days now (above 110°F)
- 7 days/yr
- Hot days in 30 yrs
- 27 days/yr
Wind risk 6/10 · Moderate
- Chance of severe wind over 30 yrs
- 58.0%
Air-quality risk 2/10 · Minimal
- Unhealthy air days now
- 0 days/yr
- Unhealthy air days in 30 yrs
- 1 days/yr
Risk factors via First Street. Map © Google.
Why this score? — see what drove the C grade
The composite is a weighted blend of 9 inputs, each scored 0–100. Each bar is that input's sub-score; the figure is the points it added to the 100-point composite (weight × sub-score).
- ARV discount +13.5/15.0
- Cash flow +11.4/30.0
- Appreciation +10.0/10.0
- Rent growth +4.5/5.0
- 1% rule +4.2/10.0
- Schools +3.8/10.0
- Livability +3.5/5.0
- DSCR +3.4/10.0
- Condition / age +2.5/5.0
$240,000
🖨 Deal sheet 📄 Offer letter ✓ Due diligence
Listing remarks MLS
Highly Motivated Seller! Spring Creek Estates community in Mabank. 4 bedrooms and 2 bathrooms, this open-concept layout offers a welcoming living room, a cozy breakfast nook, and a kitchen with ample counter and storage space for living and enjoying life. The primary suite features a generous bathroom complete with a walk-in shower, dual sinks, and a walk-in closet. Includes a two-car garage and off street parking. Minutes from grocery stores, shopping, dining and the highly-rated Mabank ISD schools.
Key facts
- 0.23 acre lot
- 2 garage spots
- Built 2019
Neighborhood map
What this means for you Summary
Snapshot
- This is a 4-bed/2.0-bath single-family listed at $240k.
Deal economics
- At list price, monthly cash flow is $-81 ($-976/yr) — negative.
- To cash-flow at today's rent, offer at most $226k (6.0% below list).
- To meet the 1% rule (rent ≥ 1% of price), the offer needs to be $220k (8.2% below list).
- Recommended offer: $211k (12.0% below list) — sets the bar for market timing.
- Cap rate 5.9% vs local median 3.1% in Mabank — top-decile yield for the area; either an underpriced asset or a hidden risk that comps aren't pricing in. Stress-test before assuming the spread holds.
Location & tenants
- Location reads 69/100 on livability (#446 in TX) — a middle-class / working-renter tenant base. Strengths: cost of living A+, housing A+, crime B+; Watch: amenities F, commute F, employment D-.
- Mabank ISD (town): math 47% / reading 44% proficiency, ranked #273 of 826 in TX (top 33%) — families likely to look elsewhere, expect single-tenant / working-renter base with shorter leases.
- Market conditions: Rents rising fast (+8.1%/yr); 214 active listings in the ZIP; 9 comparable units currently listed for rent nearby; rentals lingering (median 44d on market — plan ~5-8 weeks vacancy on turnover, expect pricing pressure); 89% of comp listings sitting > 30 days — soft ceiling on asking rent; 263 units permitted in Henderson County in 2024 (0 in 5+ unit buildings).
- At $2,203/mo this rent would consume 46% of the median local household income ($57k/yr) (locally 279% of renters already pay >50% of income on rent) — very limited rent-growth headroom before tenants either downsize or default.
Forward outlook
- In year one you build about $26k of equity ($2k loan paydown + $24k appreciation (10.0% local appreciation)).
- At projected returns (10.0% appreciation + 8.0% rent growth), your $67k cash investment doubles in ~3 years — after that, you're playing with house money.
- By year 2, paydown + projected appreciation supports a ~$41k cash-out refi (75% LTV) — recoverable capital for the next deal without selling this one.
Negotiation context
- It's been on market 239 days — a 12% lower offer ($211k) is reasonable based on typical stale-listing flexibility.
- 11 sale attempts since 2y ago; this cycle's ask has dropped $40k (14%) from the opening price — seller is motivated, your offer sets the floor, not the list.
Risks & watch-outs
- Climate carrying-cost: major wind risk, 58% chance of damaging wind over 30y; extreme-heat days projected 7→27/yr by 2055 (HVAC capex compounding) — expect insurance premiums to compound above CPI over the hold.
Questions for the listing agent
- What do current leases actually rent for vs. the listed asking? Can we see a recent rent roll and the last 12 months of T-12 income?
- It's been on market 239 days. Have you received any prior offers? Is the seller open to a 12% concession, seller financing, or rate buy-down credit?
- Why hasn't it sold? Are there any deal-killer items the seller is aware of (foundation, flood, title, zoning, code violations)?
- Is there a deadline driving the sale (1031 exchange, divorce, estate, relocation)? That informs how much negotiation room exists.
- What's the average days-on-market for RENTAL listings here right now (not sales)? A rising rental-DOM trend means longer vacancies and softer asking-rent achievability than the comps imply.
- What's the recent tenant-quality profile in this submarket — average credit score on applications, eviction rate, late-payment / NSF rate, and stable-employment percentage? A property-management company in the area should have these aggregated.
- How much new for-sale + rental construction is in the pipeline within 1–3 miles? Heavy new supply typically softens prices + rents 12–24 months out; constrained supply supports both.
Investment metrics
- 1% rule
- 0.92% ✗
- Cap rate
- 5.89%
- Cash-on-cash
- -1.45%
- DSCR
- 0.94
- GRM
- 9.1
CMA / ARV
- ARV (median comp)
- $277,031
- List price
- $240,000
- Delta
- -13.37%
- Verdict
- UNDERPRICED
- Comps
- 20 within 1.0 mi
Show comp detail 12 sales within ~0.75 mi
| Address | Dist | Beds/Ba | Sqft | Sold | Price | $/sf | Match |
|---|---|---|---|---|---|---|---|
| 106 Willowbend Loop | 0.15mi | 4/2.0 | 1,620 (-3%) | 1mo | $255,000 | $157 | 87 |
| 212 W Mcafee St | 0.32mi | 3/2.0 (-1) | 1,676 (+0%) | 1mo | $243,000 | $145 | 78 |
| 312 W Mcafee Dr | 0.31mi | 3/2.0 (-1) | 1,655 (-1%) | 1mo | $289,000 | $175 | 78 |
| 121 Willowbend Loop | 0.26mi | 4/2.0 | 1,620 (-3%) | 8mo | $263,000 | $162 | 76 |
| 314 W James St | 0.26mi | 3/2.0 (-1) | 1,523 (-9%) | 1mo | $289,000 | $190 | 67 |
| 314 W Alene Dr | 0.35mi | 3/2.0 (-1) | 1,576 (-6%) | 2mo | $289,900 | $184 | 67 |
| 123 Oak Springs Loop | 0.05mi | 3/2.0 (-1) | 1,454 (-13%) | 6mo | $245,000 | $169 | 66 |
| 300 W Mcafee St | 0.31mi | 3/2.0 (-1) | 1,910 (+14%) | 0mo | $319,000 | $167 | 56 |
| 211 W Mcafee Dr | 0.31mi | 3/2.0 (-1) | 1,438 (-14%) | 2mo | $209,000 | $145 | 56 |
| 293 Victory Dr | 0.72mi | 3/2.5 (-1) | 1,600 (-4%) | 2mo | $174,990 | $109 | 50 |
| 289 Victory Dr | 0.71mi | 4/2.0 | 1,510 (-10%) | 4mo | $188,090 | $125 | 47 |
| 305 Victory Dr | 0.75mi | 5/3.0 (+1) | 1,804 (+8%) | 5mo | $197,496 | $109 | 39 |
Match score weights: distance 35% · size 25% · config 20% · recency 20%. Top-matched comps best support the ARV.
Projected returns pro-forma
10.0% appreciation · 8.0% rent growth · sell at horizon
- IRR
- 25.1%
- Equity multiple
- 3.04×
- Total profit
- $137,306
- Equity at exit
- $216,211
- IRR
- 23.6%
- Equity multiple
- 7.51×
- Total profit
- $437,518
- Equity at exit
- $466,267
Cash invested: $67,200 (down + closing). Projections, not guarantees.
Landlord ↔ Tenant lean methodology
- Overall (STATE)
- 87 Strongly Landlord-Friendly
- State Texas
- 87 Strongly Landlord-Friendly · R+5
- County
- — inherits STATE
- City
- — inherits STATE
ZIP-level market 75147
- Home prices YoY
- 4.6%
- Rents YoY
- 8.1%
- Active inventory
- 214
- Price-to-rent
- 9.1×
Monthly cashflow live
- Estimated rent
- $2,203 high interval (Pro) →
- Mortgage (P&I)
- −$1,259
- Tax from tax record
- −$463 /mo · $5,553/yr
- Insurance
- −$100
- HOA
- −$0
- Vacancy / Maint / Mgmt
- −$463
- Net cashflow
- $-81
Break-even live
UW: 25.0% down · 7.5% · 30yr · 1.5% tax · 5.0% vac · 8.0% maint · 8.0% mgmt
Financing live
Cash to close
- Down payment
- $60,000
- Closing costs
- $7,200
- Reserves months
- —
- Total cash needed
- —
Loan-product check · same deal, 3 products live
Conventional
25% down · 7.5% · 30yr
- Down + closing
- —
- Monthly P&I
- —
- Monthly cashflow
- —
- DSCR
- —
- Eligible?
- —
Personal DTI + credit; lowest rate.
DSCR
20% down · 8.5% · 30yr
- Down + closing
- —
- Monthly P&I
- —
- Monthly cashflow
- —
- DSCR
- —
- Eligible?
- —
No personal income docs; deal must DSCR.
Hard money
10% down · 12.0% · 12mo
- Down + closing
- —
- Monthly P&I
- —
- Monthly cashflow
- —
- DSCR
- —
- Eligible?
- —
Short-term bridge; refi at stabilization.
Rent comps 9 comps
| Address | Beds | Baths | Sqft | Rent | $/sqft | DOM | Units | Dist |
|---|---|---|---|---|---|---|---|---|
| 112 Spring Crest St Mabank, TX | 3.0–4.0 | 2.0 | 1750 | $2,598 | $1.48 | 1d | 1 | 0.21mi |
| 813 S Sutton St Mabank, TX | 3.0 | 2.0 | 1197 | $1,399 | $1.17 | 43d | 1 | 0.88mi |
| 414 Shorty St Mabank, TX | 3.0 | 2.0 | 1405 | $1,564 | $1.11 | 43d | 1 | 0.91mi |
| 425 Shorty St Mabank, TX | 4.0 | 2.0 | 1788 | $1,614 | $0.90 | 43d | 1 | 0.96mi |
| 430 Shorty St Mabank, TX | 3.0 | 2.0 | 1571 | $1,614 | $1.03 | 43d | 1 | 0.97mi |
| 427 Shorty St Mabank, TX | 3.0 | 2.0 | 1571 | $1,664 | $1.06 | 43d | 1 | 0.97mi |
| 429 Shorty St Mabank, TX | 3.0 | 2.0 | 1405 | $1,499 | $1.07 | 43d | 1 | 0.98mi |
| 433 Shorty St Mabank, TX | 3.0 | 2.0 | 1571 | $1,664 | $1.06 | 43d | 1 | 0.99mi |
| 471 Bobbie St Mabank, TX | 3.0 | 2.0 | 1571 | $1,664 | $1.06 | 43d | 1 | 1.02mi |
Listing history 46 events
-
2026-06-19days on market $240,000 Active 239 DOM
-
2026-06-18days on market $240,000 Active 238 DOM
-
2026-06-17days on market $240,000 Active 237 DOM
-
2026-06-16days on market $240,000 Active 236 DOM
-
2026-06-15days on market $240,000 Active 235 DOM
-
2026-06-14days on market $240,000 Active 233 DOM
-
2026-06-12days on market $240,000 Active 232 DOM
-
2026-06-09days on market $240,000 Active 229 DOM
-
2026-06-08days on market $240,000 Active 228 DOM
-
2026-06-07days on market $240,000 Active 227 DOM
-
2026-06-05days on market $240,000 Active 224 DOM
-
2026-06-03days on market $240,000 Active 223 DOM
-
2026-06-02days on market $240,000 Active 222 DOM
-
2026-06-01days on market $240,000 Active 221 DOM
-
2026-05-31days on market $240,000 Active 220 DOM
-
2026-05-30days on market $240,000 Active 219 DOM
-
2026-04-21price $240,000 506-char remark
Show marketing remark (506 chars)
Highly Motivated Seller! Spring Creek Estates community in Mabank. 4 bedrooms and 2 bathrooms, this open-concept layout offers a welcoming living room, a cozy breakfast nook, and a kitchen with ample counter and storage space for living and enjoying life. The primary suite features a generous bathroom complete with a walk-in shower, dual sinks, and a walk-in closet. Includes a two-car garage and off street parking. Minutes from grocery stores, shopping, dining and the highly-rated Mabank ISD schools.
-
2026-02-21price $270,000 506-char remark
Show marketing remark (506 chars)
Highly Motivated Seller! Spring Creek Estates community in Mabank. 4 bedrooms and 2 bathrooms, this open-concept layout offers a welcoming living room, a cozy breakfast nook, and a kitchen with ample counter and storage space for living and enjoying life. The primary suite features a generous bathroom complete with a walk-in shower, dual sinks, and a walk-in closet. Includes a two-car garage and off street parking. Minutes from grocery stores, shopping, dining and the highly-rated Mabank ISD schools.
-
2026-01-10historical $1,600
-
2025-12-11price $1,600
-
2025-12-09price $275,000 506-char remark
Show marketing remark (506 chars)
Highly Motivated Seller! Spring Creek Estates community in Mabank. 4 bedrooms and 2 bathrooms, this open-concept layout offers a welcoming living room, a cozy breakfast nook, and a kitchen with ample counter and storage space for living and enjoying life. The primary suite features a generous bathroom complete with a walk-in shower, dual sinks, and a walk-in closet. Includes a two-car garage and off street parking. Minutes from grocery stores, shopping, dining and the highly-rated Mabank ISD schools.
-
2025-12-02price $1,700
-
2025-11-06price $1,800
-
2025-10-22$280,000 Active 506-char remark
Show marketing remark (506 chars)
Highly Motivated Seller! Spring Creek Estates community in Mabank. 4 bedrooms and 2 bathrooms, this open-concept layout offers a welcoming living room, a cozy breakfast nook, and a kitchen with ample counter and storage space for living and enjoying life. The primary suite features a generous bathroom complete with a walk-in shower, dual sinks, and a walk-in closet. Includes a two-car garage and off street parking. Minutes from grocery stores, shopping, dining and the highly-rated Mabank ISD schools.
-
2025-09-26$1,900
-
2025-08-09historical $1,900
-
2025-07-28historical
-
2025-07-15$1,900
-
2025-04-29price $275,000
-
2025-02-26$280,000 Active
-
2024-10-31soldstatus Closed
-
2024-10-31soldstatus Closed
-
2024-10-31soldstatus
-
2024-10-18historical
-
2024-10-18status Pending
-
2024-10-14status Active
-
2024-10-14historical Active Option Contract
-
2024-08-08$284,900 Active
-
2024-08-08$284,900 Active
-
2024-08-06historical
-
2024-05-30$284,900 Active
-
2024-05-30$284,900 Active
-
2024-05-28historical
-
2024-03-19$289,000 Active
-
2024-03-19$289,000 Active
-
2019-04-22soldstatus
ⓘ Source: listings_history table (triggers on properties + properties_extension) + one-shot
backfill from property_details.listing_events for pre-trigger history.
Tax reassessment forecast TX · Resets to sale price
- Current annual tax
- $5,553 · $463/mo
- Projected year-2 tax
- $5,553 · $463/mo
- Expected delta
- $0/yr ($0/mo · 0.0%)
ⓘ Screening estimate from a state-policy table — verify with the county assessor before closing.
Climate risk First Street
- Flood 1/10 Low FEMA zone X (unshaded) · 0% chance over 30 yrs
- Wildfire 3/10 Moderate
- Heat 7/10 Severe 7 d/yr ≥110°F today · 27 d/yr by 30 yrs out
- Wind 6/10 Major 58% chance of damaging wind over 30 yrs
- Air quality 2/10 Low 0 unhealthy d/yr today · 1 by 30 yrs out
Nearby sold comps map
Loading sold comps map…
Walkable amenities ~0.75 mi
Loading nearby amenities…
Taxation est. · year 1
- Rental income
- $26,431
- − Mortgage interest
- −$13,444
- − Property taxes
- −$5,553
- − Insurance
- −$1,200
- − Repairs & maintenance
- −$2,114
- − Management
- −$2,114
- − Depreciation
- −$6,982
- Taxable loss
- −$4,976
- Est. tax savings @ 24.0%
- +$1,194
- After-tax cash flow
- $219/yr
For passive investors: Depreciation is non-cash, so a rental often shows a tax loss while cash-flowing — sheltering income. Rental losses are passive: they offset passive income freely, and up to $25,000/yr can offset ordinary (W-2) income if you actively participate and your MAGI is under $100k (phasing out to $0 by $150k); unused losses carry forward. On sale, claimed depreciation is recaptured at up to 25%, and gains may owe capital-gains tax (a 1031 exchange can defer both). Figures are a year-1 estimate at your 24.0% rate — not tax advice; consult a CPA.
Schools (NCES district)
- District
- Mabank ISD
- NCES district ID
- 4828680
- Math proficiency
- 47% ▼ -19.00%
- Reading proficiency
- 44% ▼ -11.00%
- Median HH income
- $40,321
- Composite
- 38.15/100
- National rank
- #4267
- State rank
- #273 of 826 in TX
Livability — Mabank
- Score
- 69/100
- State rank
- #446
- US rank
- #9068
Category grades
Schools grade is shown separately in the Schools card above.
Census & demographics
- Census place
- Mabank, TX
- County
- Van Zandt County · 9,177 people
- Metro
- Dallas-Fort Worth-Arlington, TX
- Population (ZIP)
- 9,177
- Household income
- $56,940
- Rent vs Own
- Severe rent burden
- 279.0
Population outlook (Henderson County) Hauer SSP2
- Today (2025)
- 80,471 people
- By 2030
- 80,608 · +0.2%
- By 2040
- 80,087 · -0.5%
- By 2050
- 78,208 · -2.8%
- By 2075
- 72,423 · -10.0%
- By 2100
- 61,012 · -24.2%
Race, ethnicity, and origin ACS 2023
- Neighborhood character
- Predominantly White (86%)
- Race & ethnicity
- White 86% Hispanic / Latino 10% Two or more races 8% Black 2%
- Hispanic origin (detail)
- Mexican 10%
- Common ancestry
- Lithuanian 2% Serbian 2% Romanian 1%
- Foreign-born
- 2% · Canada
- Languages at home
- 95% English-only · Spanish 4%
Political lean MEDSL · Henderson
- 2024 margin
- Solid R (+63.5) · D 18.0% · R 81.4%
- 2008→2024 swing
- -18.8pp toward R · 2008: -44.6pp · 2024: -63.5pp
- All cycles
- 2024: R+63.5 2020: R+60.2 2016: R+60.0 2012: R+54.8 2008: R+44.6
Not yet ingested
- Civics
- —
Market trends
- HPI YoY
- ▲ 11.14%
- Current HPI
- 254.32
- Rent YoY
- ▲ 8.13%
- Metro
- Dallas-Fort Worth-Arlington, TX
- State GDP YoY
- ▲ 3.95%
- F500 in state
- 110
Industry mix (Fortune 500 HQ in TX)
| Industry | F500 HQs | Revenue |
|---|---|---|
| Energy | 16 | $1,198B |
|
||
| Technology | 5 | $198B |
|
||
| Engineering / Construction | 4 | $72B |
|
||
| Energy Services | 3 | $60B |
|
||
| Utilities | 3 | $41B |
|
||
| Healthcare | 2 | $330B |
|
||
Price history
-17.0% since first listed30 events — show timeline
- 2026-04-21 Price Changed $240,000 NTREIS
- 2026-02-21 Price Changed $270,000 NTREIS
- 2026-01-10 Rental Removed $1,600 NTREIS
- 2025-12-11 Price Changed $1,600 NTREIS
- 2025-12-09 Price Changed $275,000 NTREIS
- 2025-12-02 Price Changed $1,700 NTREIS
- 2025-11-06 Price Changed $1,800 NTREIS
- 2025-10-22 Listed $280,000 NTREIS
- 2025-09-26 Listed for Rent $1,900 NTREIS
- 2025-08-09 Rental Removed $1,900 NTREIS
- 2025-07-28 Listing Removed — NTREIS
- 2025-07-15 Listed for Rent $1,900 NTREIS
- 2025-04-29 Price Changed $275,000 NTREIS
- 2025-02-26 Listed $280,000 NTREIS
- 2024-10-31 Sold (Public Records) — Public Records
- 2024-10-31 Sold (MLS) — NTREIS
- 2024-10-31 Sold (MLS) — HCBOR
- 2024-10-18 Delisted — HCBOR
- 2024-10-18 Pending — NTREIS
- 2024-10-14 Relisted — NTREIS
- 2024-10-14 Contingent — NTREIS
- 2024-08-08 Listed $284,900 NTREIS
- 2024-08-08 Listed $284,900 HCBOR
- 2024-08-06 Listing Removed — NTREIS
- 2024-05-30 Listed $284,900 HCBOR
- 2024-05-30 Listed $284,900 NTREIS
- 2024-05-28 Listing Removed — NTREIS
- 2024-03-19 Listed $289,000 NTREIS
- 2024-03-19 Listed $289,000 HCBOR
- 2019-04-22 Sold (Public Records) — Public Records
Property tax history
+80.9%/yrLatest (2025): $5,553 · +0.4% YoY. Source: county tax records.
Cash-flow waterfall
monthlySold comps — $/sqft
last 12 mo · ≤1 miLoading sold comps…