 Multi-family
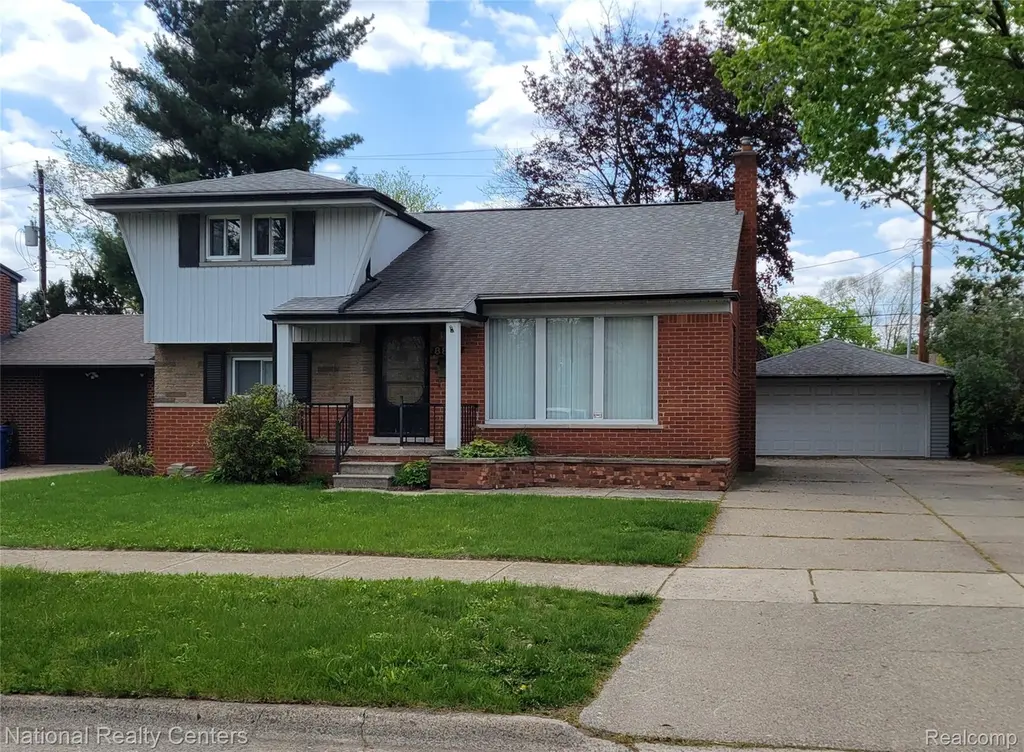
8831 Sioux · Redford, MI
Flood risk 1/10 · Minimal
- FEMA flood zone
- X (unshaded)
- Chance of flooding over 30 yrs
- 0.0%
- Est. flood insurance / yr
- $507 – $1,088
Fire risk 1/10 · Minimal
- Est. fire insurance / yr
- $784 – $1,456
Heat risk 3/10 · Minor
- Hot days now (above 98°F)
- 7 days/yr
- Hot days in 30 yrs
- 15 days/yr
Wind risk 2/10 · Minimal
- Chance of severe wind over 30 yrs
- —
Air-quality risk 3/10 · Minor
- Unhealthy air days now
- 2 days/yr
- Unhealthy air days in 30 yrs
- 3 days/yr
Risk factors via First Street. Map © Google.
Why this score? — see what drove the D+ grade
The composite is a weighted blend of 9 inputs, each scored 0–100. Each bar is that input's sub-score; the figure is the points it added to the 100-point composite (weight × sub-score).
- Cash flow +16.7/30.0
- ARV discount +12.2/15.0
- 1% rule +5.2/10.0
- DSCR +5.2/10.0
- Rent growth +3.3/5.0
- Livability +2.5/5.0
- Condition / age +2.5/5.0
- Schools +1.8/10.0
- Appreciation +0.0/10.0
$219,900
🖨 Deal sheet 📄 Offer letter ✓ Due diligence
Multi-family units
County records classify this as Multi-Family (2-4 Unit). Listing-text estimate: 1 unit. estimate disagrees with records
Listing remarks MLS
BRICK TRI-LEVEL CONTEMPORARY HOME WITH THREE BEDROOMS AND COMMON BATHROOM ON UPPER LEVEL. VERY LARGE FAMILY ROOM IN LOWER LEVEL WITH BAR AND RAISED BARK FIREPLACE. 2 CAR DETACHED GARAGE WITH SEPARATE WORKSHOP. ALL OFFERS ARE REQUIRED TO HAVE A 3% EMD DEPOSIT, CASH OFFERS REQUIRE 25% DOWN PAYMENT. PLEASE ALLOW 2-3 BUSINESS DAYS FOR SELLER RESPONSE. HIGHEST AND BEST OFFERS BEING SUBMITTED 02/14/2014 AT 3PM.
Key facts
- 6,534 sq ft lot
- 2 garage spots
- Built 1957
Property features AI
Finance
- Other: Subdivision: Tains Brothers Sub
Exterior
- Parking: Detached 2-car garage
- Utilities: Public water; Public sewer
- Home design: Single-family residential property; One story (above-grade finished area 1,883 square feet)
- Construction: Aluminum siding and brick exterior; Asphalt roof; Slab foundation
- Exterior features: Paved road frontage; Lot approximately 0.15 acres (62 x 105)
Interior
- Bathrooms: 1 full bathroom; 1 half bathroom
- Heating & cooling: Central air conditioning; Forced air heating; Natural gas heating
- Interior features: 3 total rooms; Ground-level entry with steps; Sidewalks on the block
Neighborhood map
What this means for you Summary
Snapshot
- This is a 3-bed/1.5-bath multifamily listed at $220k.
Deal economics
- At list price, monthly cash flow is $138 ($2k/yr) — positive.
- The deal already cash-flows at list — no discount required.
- Meets the 1% rule at list price ($2k rent vs $220k).
Location & tenants
- Location reads: area grade D — affects rentability + tenant quality, not the cash-flow math above.
- South Redford School District (suburban): math 11% / reading 29% proficiency, ranked #455 of 540 in MI (top 84%) — low school quality limits family demand, transient renter base, plan for 1-2y turnover.
- Market conditions: Rents rising (+3.2%/yr); 188 active listings in the ZIP; 6 comparable units currently listed for rent nearby; rentals lingering (median 44d on market — plan ~5-8 weeks vacancy on turnover, expect pricing pressure); 50% of comp listings sitting > 30 days — soft ceiling on asking rent; 2,639 units permitted in Wayne County in 2024 (1,216 in 5+ unit buildings).
- This rent runs 38% of the median local income ($71k/yr) — at the standard rent-burdened threshold; future hikes will face affordability resistance.
Forward outlook
- Local home prices are declining (-3.0%/yr); year-one equity from $2k of loan paydown is wiped out by about $7k of value loss. Plan a longer hold.
- Wayne County population projected at -17% by 2050 — secular population decline; favor cash flow + early exit over multi-decade hold.
Negotiation context
- Only 6 days on market — expect competitive offers; lowballing is unlikely to land.
- 5 sale attempts since 23y ago with the ask held roughly flat each time — persistent listings suggest the price (not the market) is what's stuck; bring a comps-based counter.
- Current owner paid $50k; list at $220k implies a 340% gain — meaningful room to come down on a strong offer.
Risks & watch-outs
- Watch-outs: built in 1957 — expect roof / HVAC / electrical / plumbing capex.
Questions for the listing agent
- Built in 1957 — when were the roof, HVAC, electrical panel, plumbing, and water heater last replaced?
- Is there a deadline driving the sale (1031 exchange, divorce, estate, relocation)? That informs how much negotiation room exists.
- The area grade is low — what's the realistic commute time and amenity access for the typical tenant pool here? Any planned neighborhood developments (good or bad) we should know about?
- What's the average days-on-market for RENTAL listings here right now (not sales)? A rising rental-DOM trend means longer vacancies and softer asking-rent achievability than the comps imply.
- What's the recent tenant-quality profile in this submarket — average credit score on applications, eviction rate, late-payment / NSF rate, and stable-employment percentage? A property-management company in the area should have these aggregated.
- How much new apartment / multifamily construction is in the pipeline within 1–3 miles? Heavy new supply (>2% of stock underway) typically softens rents 12–24 months out; light construction supports rent growth.
Investment metrics
- 1% rule
- 1.02% ✓
- Cap rate
- 7.05%
- Cash-on-cash
- 2.69%
- DSCR
- 1.12
- GRM
- 8.2
CMA / ARV
- ARV (median comp)
- $245,553
- List price
- $219,900
- Delta
- -10.45%
- Verdict
- UNDERPRICED
- Comps
- 20 within 1.0 mi
Projected returns pro-forma
-3.0% appreciation · 3.25% rent growth · sell at horizon
- IRR
- -11.7%
- Equity multiple
- 0.57×
- Total profit
- $-26,183
- Equity at exit
- $32,788
- IRR
- -2.1%
- Equity multiple
- 0.86×
- Total profit
- $-8,733
- Equity at exit
- $19,013
Cash invested: $61,572 (down + closing). Projections, not guarantees.
Landlord ↔ Tenant lean methodology
- Overall (STATE)
- 62 Landlord-Friendly
- State Michigan
- 62 Landlord-Friendly · EVEN
- County
- — inherits STATE
- City
- — inherits STATE
ZIP-level market 48239
- Rents YoY
- 3.2%
- Active inventory
- 188
- Price-to-rent
- 8.2×
Monthly cashflow live
- Estimated rent
- $2,245 high interval (Pro) →
- Mortgage (P&I)
- −$1,153
- Tax from tax record
- −$391 /mo · $4,695/yr
- Insurance
- −$92
- HOA
- −$0
- Vacancy / Maint / Mgmt
- −$472
- Net cashflow
- $138
Break-even live
UW: 25.0% down · 7.5% · 30yr · 1.5% tax · 5.0% vac · 8.0% maint · 8.0% mgmt
Financing live
Cash to close
- Down payment
- $54,975
- Closing costs
- $6,597
- Reserves months
- —
- Total cash needed
- —
Loan-product check · same deal, 3 products live
Conventional
25% down · 7.5% · 30yr
- Down + closing
- —
- Monthly P&I
- —
- Monthly cashflow
- —
- DSCR
- —
- Eligible?
- —
Personal DTI + credit; lowest rate.
DSCR
20% down · 8.5% · 30yr
- Down + closing
- —
- Monthly P&I
- —
- Monthly cashflow
- —
- DSCR
- —
- Eligible?
- —
No personal income docs; deal must DSCR.
Hard money
10% down · 12.0% · 12mo
- Down + closing
- —
- Monthly P&I
- —
- Monthly cashflow
- —
- DSCR
- —
- Eligible?
- —
Short-term bridge; refi at stabilization.
Rent comps 6 comps
| Address | Beds | Baths | Sqft | Rent | $/sqft | DOM | Units | Dist |
|---|---|---|---|---|---|---|---|---|
| 25615 Tireman St Dearborn Heights, MI | 3.0 | 1.5 | 1855 | $1,900 | $1.02 | 43d | 1 | 0.96mi |
| 11726 Deering St Livonia, MI | 4.0 | 1.5 | 1248 | $2,125 | $1.70 | 1d | 1 | 1.17mi |
| 26101 W Warren St Dearborn Heights, MI | 4.0 | 1.5 | 2359 | $4,200 | $1.78 | 43d | 1 | 1.21mi |
| 6810 Rosemary St Dearborn Heights, MI | 3.0 | 1.5 | 1700 | $2,000 | $1.18 | 1d | 1 | 1.32mi |
| 6644 Cronin Dr Dearborn Heights, MI | 3.0 | 1.5 | 2250 | $2,000 | $0.89 | 43d | 1 | 1.43mi |
| 11141 Karen St Livonia, MI | 3.0 | 1.0 | 1322 | $1,950 | $1.48 | 10d | 1 | 1.43mi |
Listing history 12 events
-
2026-05-11status Pending
-
2026-05-11status Pending
-
2026-05-05$219,900 Active
-
2026-05-05$219,900 Active
-
2014-03-14soldstatus $50,000
Show marketing remark (408 chars)
BRICK TRI-LEVEL CONTEMPORARY HOME WITH THREE BEDROOMS AND COMMON BATHROOM ON UPPER LEVEL. VERY LARGE FAMILY ROOM IN LOWER LEVEL WITH BAR AND RAISED BARK FIREPLACE. 2 CAR DETACHED GARAGE WITH SEPARATE WORKSHOP. ALL OFFERS ARE REQUIRED TO HAVE A 3% EMD DEPOSIT, CASH OFFERS REQUIRE 25% DOWN PAYMENT. PLEASE ALLOW 2-3 BUSINESS DAYS FOR SELLER RESPONSE. HIGHEST AND BEST OFFERS BEING SUBMITTED 02/14/2014 AT 3PM.
-
2014-02-20historical
-
2014-02-12$37,900
Show marketing remark (408 chars)
BRICK TRI-LEVEL CONTEMPORARY HOME WITH THREE BEDROOMS AND COMMON BATHROOM ON UPPER LEVEL. VERY LARGE FAMILY ROOM IN LOWER LEVEL WITH BAR AND RAISED BARK FIREPLACE. 2 CAR DETACHED GARAGE WITH SEPARATE WORKSHOP. ALL OFFERS ARE REQUIRED TO HAVE A 3% EMD DEPOSIT, CASH OFFERS REQUIRE 25% DOWN PAYMENT. PLEASE ALLOW 2-3 BUSINESS DAYS FOR SELLER RESPONSE. HIGHEST AND BEST OFFERS BEING SUBMITTED 02/14/2014 AT 3PM.
-
2003-09-09soldstatus $168,500
-
2003-06-20soldstatus $168,500
-
2003-04-02$168,500
ⓘ Source: listings_history table (triggers on properties + properties_extension) + one-shot
backfill from property_details.listing_events for pre-trigger history.
Tax reassessment forecast MI · Partial reset (capped growth)
- Current annual tax
- $4,695 · $391/mo
- Projected year-2 tax
- $4,695 · $391/mo
- Expected delta
- $0/yr ($0/mo · 0.0%)
ⓘ Screening estimate from a state-policy table — verify with the county assessor before closing.
Climate risk First Street
- Flood 1/10 Low FEMA zone X (unshaded) · 0% chance over 30 yrs
- Wildfire 1/10 Low
- Heat 3/10 Moderate 7 d/yr ≥98°F today · 15 d/yr by 30 yrs out
- Wind 2/10 Low
- Air quality 3/10 Moderate 2 unhealthy d/yr today · 3 by 30 yrs out
Nearby sold comps map
Loading sold comps map…
Walkable amenities ~0.75 mi
Loading nearby amenities…
Taxation est. · year 1
- Rental income
- $26,945
- − Mortgage interest
- −$12,318
- − Property taxes
- −$4,695
- − Insurance
- −$1,100
- − Repairs & maintenance
- −$2,156
- − Management
- −$2,156
- − Depreciation
- −$6,397
- Taxable loss
- −$1,876
- Est. tax savings @ 24.0%
- +$450
- After-tax cash flow
- $2,104/yr
For passive investors: Depreciation is non-cash, so a rental often shows a tax loss while cash-flowing — sheltering income. Rental losses are passive: they offset passive income freely, and up to $25,000/yr can offset ordinary (W-2) income if you actively participate and your MAGI is under $100k (phasing out to $0 by $150k); unused losses carry forward. On sale, claimed depreciation is recaptured at up to 25%, and gains may owe capital-gains tax (a 1031 exchange can defer both). Figures are a year-1 estimate at your 24.0% rate — not tax advice; consult a CPA.
Schools (NCES district)
- District
- South Redford School District
- NCES district ID
- 2632280
- Math proficiency
- 11% ▼ -9.00%
- Reading proficiency
- 29% ▼ -7.00%
- Median HH income
- $52,775
- Composite
- 18.1/100
- National rank
- #8972
- State rank
- #455 of 540 in MI
Livability — Redford
No livability data for this city. (Only ~50 U.S. cities are tracked.)
Census & demographics
- County
- Wayne County · 1,562,939 people
- City population
- 36,976
- Metro
- Detroit-Warren-Dearborn, MI
- Population (ZIP)
- 36,976
- Household income
- $71,151
- Rent vs Own
- Severe rent burden
- 1052.0
Population outlook (Wayne County) Hauer SSP2
- Today (2025)
- 1,675,273 people
- By 2030
- 1,620,300 · -3.3%
- By 2040
- 1,502,341 · -10.3%
- By 2050
- 1,384,039 · -17.4%
- By 2075
- 1,124,592 · -32.9%
- By 2100
- 881,193 · -47.4%
Race, ethnicity, and origin ACS 2023
- Neighborhood character
- Majority Black (58%)
- Race & ethnicity
- Black 58% White 34% Hispanic / Latino 4% Two or more races 4%
- Common ancestry
- Romanian 7% Slovak 2% Lithuanian 2%
- Foreign-born
- 2% · Canada
- Languages at home
- 96% English-only · Spanish 1% Other Indo-European 1% Arabic 1%
Political lean MEDSL · Wayne
- 2024 margin
- Strong D (+29.0) · D 62.7% · R 33.7% · Other 3.6%
- 2008→2024 swing
- -20.5pp toward R · 2008: 49.5pp · 2024: 29.0pp
- All cycles
- 2024: D+29.0 2020: D+38.1 2016: D+37.3 2012: D+46.9 2008: D+49.5
Not yet ingested
- Civics
- —
Market trends
- HPI YoY
- ▼ -202.97%
- Current HPI
- 236.1136
- Rent YoY
- ▲ 3.25%
- Metro
- Detroit-Warren-Dearborn, MI
- State GDP YoY
- ▲ 1.37%
- F500 in state
- 28
Industry mix (Fortune 500 HQ in MI)
| Industry | F500 HQs | Revenue |
|---|---|---|
| Automotive Parts | 3 | $48B |
|
||
| Automotive | 2 | $372B |
|
||
| Chemicals | 1 | $45B |
|
||
| Automotive Retail | 1 | $29B |
|
||
| Healthcare / Medical Devices | 1 | $23B |
|
||
| Automotive Technology | 1 | $20B |
|
||
Price history
+30.5% since first listed12 events — show timeline
- 2026-05-11 Pending — MiRealSource-MiMLS
- 2026-05-11 Pending — REALCOMP
- 2026-05-05 Listed $219,900 REALCOMP
- 2026-05-05 Listed $219,900 MiRealSource-MiMLS
- 2014-03-14 Sold (MLS) $50,000 MiRealSource-MiMLS
- 2014-03-14 Sold (MLS) $50,000 REALCOMP
- 2014-02-20 Listing Removed — MiRealSource-MiMLS
- 2014-02-12 Listed $37,900 MiRealSource-MiMLS
- 2014-02-12 Listed $37,900 REALCOMP
- 2003-09-09 Sold (Public Records) $168,500 Public Records
- 2003-06-20 Sold (MLS) $168,500 REALCOMP
- 2003-04-02 Listed $168,500 REALCOMP
Property tax history
+5.9%/yrLatest (2025): $4,695 · -4.7% YoY. Source: county tax records.
Cash-flow waterfall
monthlySold comps — $/sqft
last 12 mo · ≤1 miLoading sold comps…